HDMI ケーブル市場 - 2031 年の成長予測、統計、事実
過去データ : 2021-2022 | 基準年 : 2023 | 予測期間 : 2023-2031HDMIケーブル市場の規模と予測(2021-2031年)、世界および地域のシェア、トレンド、成長機会分析レポートの対象範囲:タイプ(標準HDMIケーブル、イーサネット対応標準HDMIケーブル、高速HDMIケーブル、イーサネット対応高速HDMIケーブル)、グレード(HDMI 1.4、HDMI 2.0、HDMI 2.1)、アプリケーション(ゲーム機、プレーヤー、テレビ、携帯電話、パソコン、タブレット、自動車システム)、および地域
- ステータス : 公開されたデータ
- レポートコード : TIPTE100001367
- カテゴリー : エレクトロニクスおよび半導体
- ページ数 : 150
- 利用可能なレポート形式 :


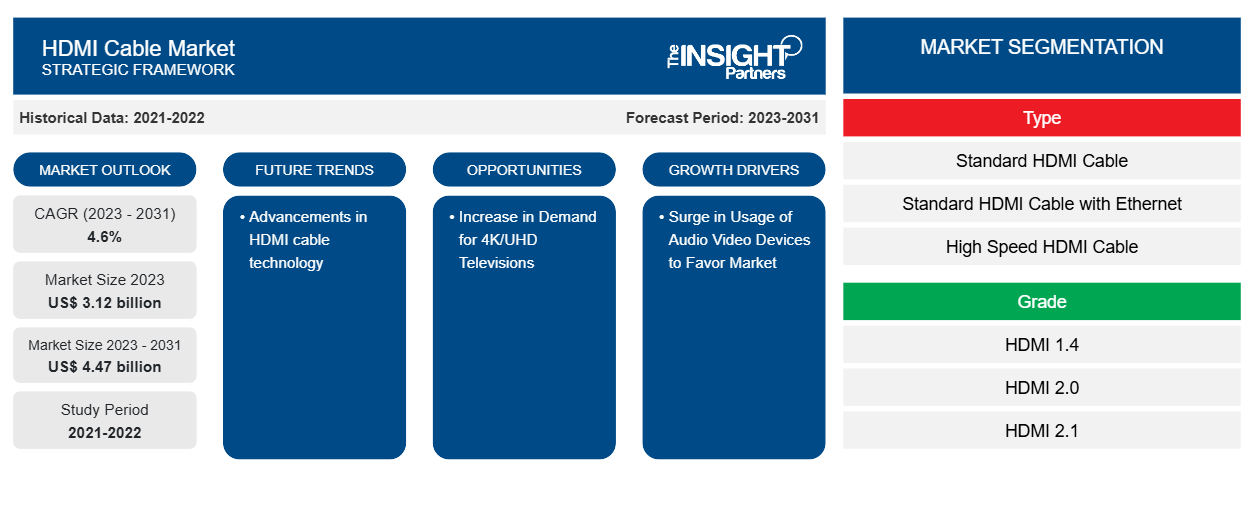
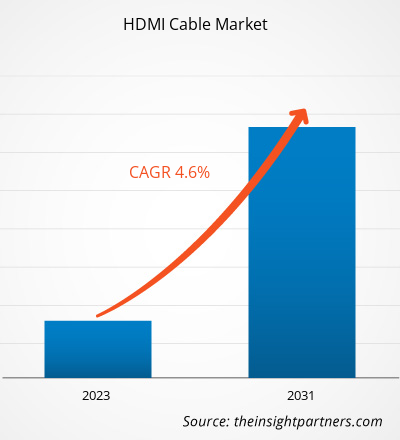
HDMI ケーブル市場規模は、2023 年の 31 億 2,000 万米ドルから 2031 年には 44 億 7,000 万米ドルに成長すると予想されており、2023 年から 2031 年にかけて 4.6% の CAGR で拡大すると予想されています。HDMI ケーブル技術の進歩は、今後も HDMI ケーブル市場の主要なトレンドであり続けると思われます。
HDMIケーブル市場分析
テレビ、ゲーム機、オーディオ プレーヤーなどのオーディオおよびビデオ デバイスの使用の増加は、HDMI ケーブル市場の主な推進力となっています。HDMI ケーブルの需要は、これらのデバイスを接続し、高品質のオーディオおよびビデオ伝送を確保する必要性に直接結びついています。
HDMIケーブル市場の概要
HDMI は、High-Definition Multimedia Interface の略で、デバイス間で高解像度のオーディオおよびビデオ信号を伝送するために広く使用されているケーブルです。商業用と家庭用の両方の環境で、ディスプレイ コントローラー、コンピューター モニター、デジタル テレビ、その他のオーディオビジュアル (AV) 機器で一般的に使用されています。
さらに、ビジネスおよび公共機関の分野では、HDMI はデバイス間で高品質のオーディオおよびビデオ信号を伝送するための標準となっています。教育、プレゼンテーション、デジタル サイネージ、小売ディスプレイで広く使用されています。HDMI はラップトップやパーソナル コンピューターでもますます利用されるようになり、企業および商業市場で推奨されるインターフェイスとしての地位をさらに固めています。
要件に合わせてレポートをカスタマイズする
このレポートの一部、国レベルの分析、Excelデータパックなど、あらゆるレポートを無料でカスタマイズできます。また、スタートアップや大学向けのお得なオファーや割引もご利用いただけます。
HDMIケーブル市場:戦略的洞察
-
このレポートの主要な市場動向を入手してください。この無料サンプルには、市場動向から見積もりや予測に至るまでのデータ分析が含まれます。
HDMIケーブル市場の推進要因と機会
オーディオビデオ機器の使用急増が市場を有利に導く
HDMI接続を備えたオーディオビデオマルチメディアデバイスの利用が急増しています。この成長は、モノのインターネット(IoT)や人工知能(AI)などの最新技術の採用の増加に起因しており、HDMIポートを備えたホームシアターシステムなどのオーディオビデオ機器の需要が高まっています。これらのシステムには、AlexaやGoogle AssistantなどのAIソフトウェアが統合されていることが多く、消費者に組み込みのインテリジェンスと利便性を提供しています。その結果、住宅市場ではHDMIケーブルの需要が著しく増加すると予想されています。この需要は、DVDプレーヤーや音楽システムなどのマルチメディア機器の普及によってさらに促進されています。これらの機器は、ビデオパネルとのシームレスな統合にコネクタを必要とし、その逆も同様です。特に、Bose Lifetime 650ホームエンターテイメントシステムは、AV I/OサポートにHDMIケーブルを使用しています。
4K/UHDテレビの需要増加
ディスプレイ技術の進歩によりテレビの価格が下がったことで、中所得層の消費者層が多数を占めるようになりました。その結果、住宅環境では 4K または超高精細テレビの採用が大幅に増加しました。これらのテレビは、高転送速度をサポートする複数の HDMI ポートを備えているため、ユーザーはゲーム機やホームシアター システムなどのさまざまなエンターテイメント システムを接続できます。4 つの HDMI 入力、HDCP2.3、HDMI-CEC、HDMI オーディオ リターン チャネル (ARC) などの機能も利用できるようになったことで、HDMI ケーブルの需要がさらに高まりました。この傾向は、テレビの進歩と、住宅部門の消費者の高まるニーズに応える複数の HDMI ポートの提供によって推進されています。
HDMIケーブル市場レポートのセグメンテーション分析
HDMI ケーブル市場分析の導出に貢献した主要なセグメントは、タイプ、グレード、およびアプリケーションです。
- タイプに基づいて、市場は標準HDMIケーブル、イーサネット付き標準HDMIケーブル、高速HDMIケーブル、イーサネット付き高速HDMIケーブルに分かれています。標準HDMIケーブルセグメントは2023年に大きな市場シェアを占めました。
- グレードに基づいて、市場はHDMI 1.4、HDMI 2.0、HDMI 2.1に分かれています。HDMI 2.0セグメントは2023年に大きな市場シェアを占めました。
- アプリケーション別に見ると、市場はゲーム機、プレーヤーとテレビ、携帯電話、パソコンとタブレット、自動車システムに分かれています。ゲーム機セグメントは2023年に大きな市場シェアを占めました。
HDMIケーブル市場シェアの地域別分析
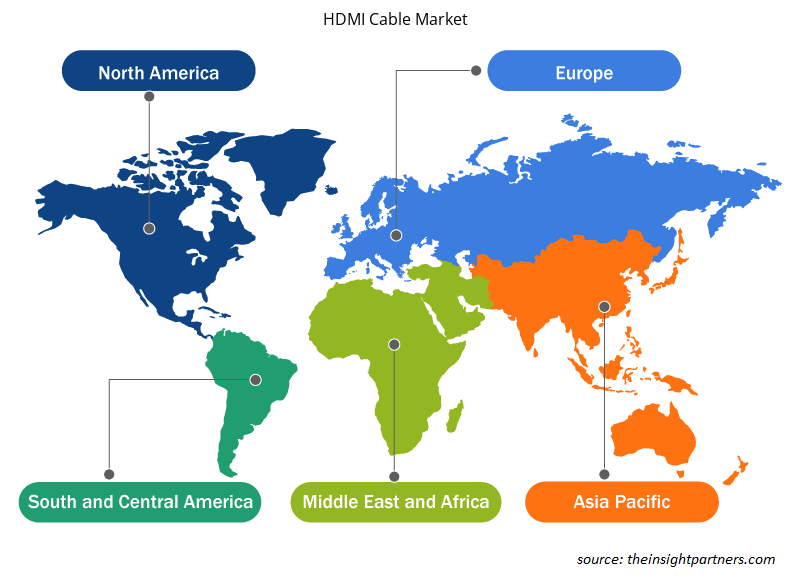
HDMIケーブル市場レポートの地理的範囲は、主に北米、アジア太平洋、ヨーロッパ、中東およびアフリカ、南米/中南米の5つの地域に分かれています。北米は2023年にHDMIケーブル市場を支配しました。マルチメディアおよびオーディオ/ビデオデバイスの発達により、北米、特に米国でのHDMIケーブルの採用が増加しています。ディスプレイ技術の進歩により、HDMIケーブルの市場シェアが増加すると予測されています。北米でのインターネットの急激な増加により、信号伝送用のHDMIケーブルの需要が高まっています。ディスプレイデバイスの進歩により、4K、8K、その他の解像度用のHDMIケーブルなど、新しいトレンドが生まれました。北米はHDMIケーブル業界の成長に大きく貢献しています。eコマース市場の拡大で知られるアイルランドに拠点を置く企業であるeShopWorldが北米で実施した世論調査によると、顧客の84%以上がHDMIケーブルを購入しています。
HDMIケーブル市場の地域別分析
予測期間を通じて HDMI ケーブル市場に影響を与える地域的な傾向と要因は、Insight Partners のアナリストによって徹底的に説明されています。このセクションでは、北米、ヨーロッパ、アジア太平洋、中東およびアフリカ、南米および中米にわたる HDMI ケーブル市場のセグメントと地理についても説明します。
- HDMIケーブル市場の地域別データを入手
HDMIケーブル市場レポートの範囲
| レポート属性 | 詳細 |
|---|---|
| 2023年の市場規模 | 31億2千万米ドル |
| 2031年までの市場規模 | 44億7000万米ドル |
| 世界のCAGR(2023年~2031年) | 4.6% |
| 履歴データ | 2021-2022 |
| 予測期間 | 2023-2031 |
| 対象セグメント |
タイプ別
|
| 対象地域と国 |
北米
|
| 市場リーダーと主要企業プロフィール |
|
HDMI ケーブル市場のプレーヤー密度: ビジネスダイナミクスへの影響を理解する
HDMI ケーブル市場は、消費者の嗜好の変化、技術の進歩、製品の利点に対する認識の高まりなどの要因により、エンドユーザーの需要が高まり、急速に成長しています。需要が高まるにつれて、企業は提供を拡大し、消費者のニーズを満たすために革新し、新たなトレンドを活用し、市場の成長をさらに促進しています。
市場プレーヤー密度とは、特定の市場または業界内で活動している企業または会社の分布を指します。これは、特定の市場スペースに、その市場規模または総市場価値に対してどれだけの競合相手 (市場プレーヤー) が存在するかを示します。
HDMIケーブル市場で事業を展開している主要企業は次のとおりです。
- ベルキンインターナショナル
- ピュアファイ
- ソニー株式会社
- 日立
- クレイマーエレクトロニクス株式会社
- アテンアドバンス
免責事項:上記の企業は、特定の順序でランク付けされていません。
- HDMIケーブル市場のトップキープレーヤーの概要を入手
HDMIケーブル市場のニュースと最近の動向
HDMI ケーブル市場は、重要な企業出版物、協会データ、データベースを含む一次調査と二次調査後の定性的および定量的データを収集することによって評価されます。以下は、市場の動向の一覧です。
- 2022 年 12 月、業界をリードする AV/IT 接続および管理ソリューションのプロバイダーである ATEN Advanced は、ワークフローの効率を高めるように設計された CS22HF 2 ポート USB FHD HDMI ケーブル KVM スイッチを発表しました。CS22HF を使用すると、ボタンを押すだけで 2 台のコンピューターをシームレスに切り替えることができます。両方のコンピューターを制御するには、ユーザーは USB および HDMI 接続を利用して、1 つのマウス、キーボード、ディスプレイを備えたデスクトップ コンソールを構成するだけです。
(出典:ATEN Advance、プレスリリース、2022年)
- 2022 年 11 月、プロフェッショナル オーディオビジュアル (Pro A/V) 市場向けのプレミアム接続ソリューションの大手プロバイダーである Pure-Fi は、新しい超高速 HDMI アクティブ光ケーブル (AOC) を発表しました。この革新的なケーブルは、長距離での 60 Hz での 8K ビデオ コンテンツの伝送など、HDMI 2.1a 機能をサポートするように設計されています。超高速 HDMI AOC は、Pro A/V 用に特別に調整されており、デジタル サイネージ アプリケーションに最適です。
(出典:Pure-Fi、プレスリリース、2022年)
HDMIケーブル市場レポートの対象範囲と成果物
「HDMI ケーブル市場の規模と予測 (2021 ~ 2031 年)」レポートでは、以下の分野をカバーする市場の詳細な分析を提供しています。
- 対象範囲に含まれるすべての主要市場セグメントの世界、地域、国レベルでの市場規模と予測
- 市場の動向(推進要因、制約、主要な機会など)
- 今後の主な動向
- 詳細なPEST/ポーターの5つの力とSWOT分析
- 主要な市場動向、主要プレーヤー、規制、最近の市場動向を網羅した世界および地域の市場分析
- 市場集中、ヒートマップ分析、主要プレーヤー、最近の動向を網羅した業界の状況と競争分析
- 詳細な企業プロフィール

Naveenは、カスタム、シンジケート、コンサルティングの各プロジェクトにおいて9年以上の実績を持つ、経験豊富な市場調査およびコンサルティングのプロフェッショナルです。現在はアソシエイトバイスプレジデントを務め、プロジェクトバリューチェーン全体にわたるステークホルダー管理を成功させ、100件以上の調査レポートと30件以上のコンサルティング案件を執筆しています。産業および政府機関のプロジェクトに幅広く携わり、クライアントの成功とデータに基づく意思決定に大きく貢献しています。
Naveenは、カルナータカ州VTUで電子通信工学の学位を取得し、マニパル大学でマーケティング&オペレーションズのMBAを取得しています。IEEEの会員として9年間活動し、会議や技術シンポジウムへの参加、セクションレベルおよび地域レベルでのボランティア活動に積極的に取り組んでいます。現職以前は、IndustryARCでアソシエイト戦略コンサルタント、Hewlett Packard(HP Global)で産業用サーバーコンサルタントを務めていました。
- 過去2年間の分析、基準年、CAGRによる予測(7年間)
- PEST分析とSWOT分析
- 市場規模価値/数量 - 世界、地域、国
- 業界と競争環境
- Excel データセット
お客様の声
Insight PartnersのSCADAシステム市場レポートは包括的で、現在のトレンドと将来の予測に関する貴重な洞察が含まれています。チームは終始、非常にプロフェッショナルで、対応が早く、サポートも充実していました。私たちは彼らのサービスに非常に満足しており、強くお勧めします。
ラン・ケデム パートナー, レアリテクノロジーズ株式会社非常に特殊なソフトウェア市場に関するレポートを依頼したところ、チームは数日でレポートを作成してくれました。情報は非常に関連性が高く、分かりやすくまとめられていました。その後、レポートにいくつか修正と追加を依頼しましたが、チームは非常に迅速に対応し、1週間も経たないうちに最終レポートを受け取ることができました。
ジャン=エルヴェ・ジェン 会長, フューチャー・アナリティカ重要な市場調査と予測のために、The Insight Partnersと協力しました。彼らは機会とリスクに関する明確な洞察を提供し、私たちの計画策定に役立ちました。彼らの調査は使いやすく、確かなデータに基づいており、賢明で自信に満ちた意思決定に役立ちました。彼らを強くお勧めします。
ピユーシュ・ナグパル 上級副社長, ハイビームグローバルInsight Partnersは、深い専門知識に基づき、洞察力に富み、構造化された市場調査を提供しました。チームは終始プロフェッショナルで、対応力も抜群でした。ユーザーフレンドリーなウェブサイトにより、業界レポートへのアクセスもスムーズでした。信頼性の高い高品質な調査サービスをお探しなら、Insight Partnersを強くお勧めします。
安達幸彦 最高経営責任者(CEO), ディープブルーLLC。The Insight Partnersから市場レポートを購入するのは今回が初めてです。最初は不安でしたが、ウェブサイトを見て、リスクを負ってでも購入してみようという気持ちになりました。レポートの品質とカスタマーサービスには大変満足しています。最初のレポートにはいくつか質問やコメントがありましたが、アナリストとメールで何度かやり取りした結果、戦略策定プロセスへのインプットとして活用できるレポートが完成しました。貴重なお時間を割いていただき、貴重な体験をさせていただき、誠にありがとうございました。他の方にもぜひお勧めしたいですし、今後さらに市場データが必要になった際には、まずThe Insight Partnersにご連絡させていただきます。
ジョン・スズキ 社長兼最高経営責任者、取締役, BKテクノロジーズナイジェリアの感染症IVD市場に関する情報提供依頼に対し、ご対応いただいた際、ご尽力とプロフェッショナルな姿勢に深く感謝申し上げます。忍耐強く、的確なアドバイスをいただき、また、最終的に取引成立に至った割引のご提供にも深く感謝申し上げます。今回の最初の出会いで得た強い印象のおかげで、今後もThe Insight Partnersとの連携を心待ちにしております。
チジオケ博士 オニア マネージングディレクター, パインクレストヘルスケア株式会社購入理由
- 情報に基づいた意思決定
- 市場動向の理解
- 競合分析
- 顧客インサイト
- 市場予測
- リスク軽減
- 戦略計画
- 投資の正当性
- 新興市場の特定
- マーケティング戦略の強化
- 業務効率の向上
- 規制動向への対応


 無料サンプルを入手 - HDMIケーブル市場