
騒音線量計市場分析と予測 - 規模、シェア、成長、トレンド 2031 年
騒音線量計市場の規模と予測(2021年〜2031年)、世界および地域のシェア、傾向、成長機会分析レポートの対象範囲:タイプ別(ソフトウェアとハードウェア)、デバイスの配置別(体内騒音線量計、自由音場騒音線量計、耳内/近傍騒音線量計)、アプリケーション別(航空宇宙および防衛、自動車、建設、工場および企業)および地理別。
- ステータス : 公開されたデータ
- レポートコード : TIPEL100001356
- カテゴリー : エレクトロニクスおよび半導体
- ページ数 : 150
- 利用可能なレポート形式 :


- 最終更新日 : August 28, 2024

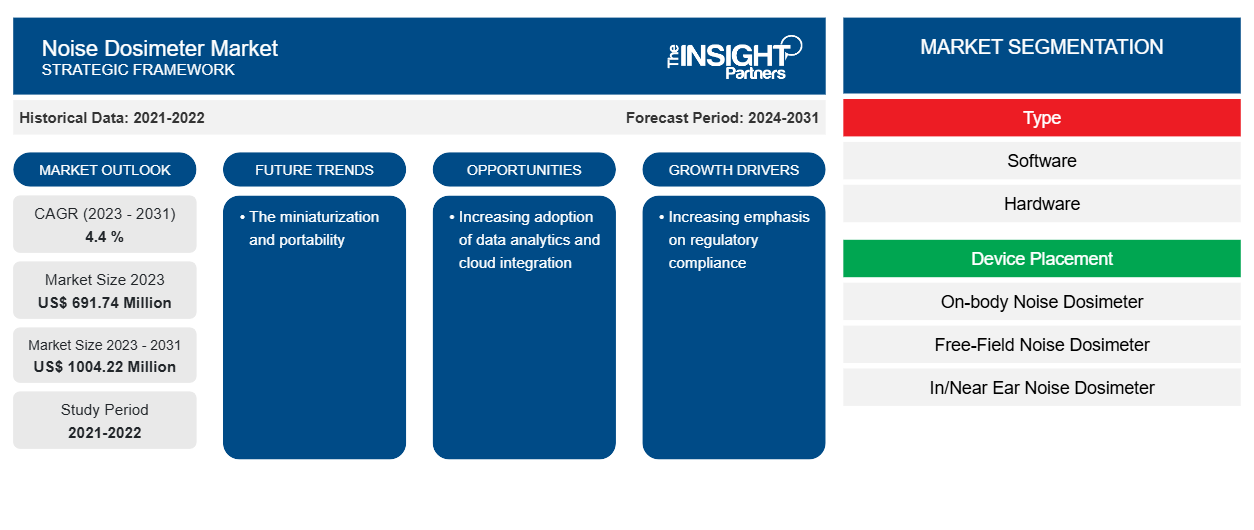
騒音線量計の市場規模は、2023年の6億9,174万米ドルから2031年には10億422万米ドルに達すると予測されています。市場は2023年から2031年の間に4.4%のCAGRを記録すると予想されています。小型化と携帯性は、引き続き市場の主要なトレンドとなると思われます。
騒音計市場分析
市場の需要は、個人用騒音線量計の使用増加に起因しています。今日の健康および安全の専門家や産業衛生士にとって、職場の騒音対策は不可欠です。先進国の多くの製造施設では、依然として高いレベルの騒音が存在します。さまざまな地域では、作業員の騒音線量を確認するために個人用デバイスを使用することを好んでいます。同時に、他の国では、手持ち式騒音レベル計と少数の個人用騒音線量計を組み合わせて使用しています。オフィスで対処しなければならない追加のリスクが多数ある可能性のある忙しい人にとって、個人用騒音線量計の利点は、現在使用されている多くのシステムと新しいシステムです。
騒音計市場の概要
職業上の騒音を測定するための単一の方法や手法は存在しません。聴覚安全衛生の専門家は、さまざまな機器を利用して騒音を測定し、いくつかの機器やソフトウェアから選択して測定値を調べることができます。職業上の騒音を分析および測定するための特定の機器とアプローチの選択は、測定の理由や測定が行われる環境など、さまざまな要因によって異なります。騒音レベルが一定で、作業シフト中に作業者が基本的に動かない場合は、騒音計で騒音を測定するプロセスは比較的簡単です。騒音レベルが変動したり断続的である場合は、作業者の騒音曝露を測定するために騒音線量計を使用することをお勧めします。
要件に合わせてレポートをカスタマイズする
このレポートの一部、国レベルの分析、Excelデータパックなど、あらゆるレポートを無料でカスタマイズできます。また、スタートアップや大学向けのお得なオファーや割引もご利用いただけます。
騒音計市場:戦略的洞察
-
このレポートの主要な市場動向を入手してください。この無料サンプルには、市場動向から見積もりや予測に至るまでのデータ分析が含まれます。
騒音計市場の推進要因と機会
規制遵守の重要性の高まり
マルチチャンネル騒音線量計は、作業員の騒音曝露を評価し、SNR、HML、またはオクターブバンドを使用して聴覚保護を選択するために必要なすべてのパラメータを同時に測定できます。各チャンネルは、騒音測定の標準、規制、またはガイドラインを満たすように個別に構成できます。これにより、線量計は幅広いデータを測定し、職業上の騒音基準を満たすために必要な情報を提供できます。したがって、規制遵守の重要性が高まるにつれて、騒音線量計の需要が高まっています。
データ分析とクラウド統合の採用の増加
騒音測定の次の大きな革命は、騒音の測定と監視の方法を変えるものとなるでしょう。クラウド テクノロジーを騒音の規模に統合することは、業界にとって画期的な出来事であり、世界中の組織が従業員と環境を極度の騒音暴露のリスクから保護する方法の開発を約束します。クラウド接続の騒音観測装置は、1 つのサイトまたは複数のサイトのさまざまな場所に設置でき、可能な限り広い地理的領域をカバーします。クラウド テクノロジーは、複数のサイトでの運用で発生する課題を克服し、従来の方法よりも効率的でアクセスしやすい騒音監視を実現します。したがって、データ分析とクラウド統合の採用が増えることで、市場にさらなる機会が生まれます。
騒音計市場レポートのセグメンテーション分析
騒音線量計市場分析の導出に貢献した主要なセグメントは、タイプ、デバイスの配置、およびアプリケーションです。
- 騒音線量計市場は、種類によってハードウェアとソフトウェアに分かれています。2023年にはソフトウェア部門がより大きな市場シェアを占めました。
- デバイスの配置によって、市場は体内装着型騒音線量計、自由音場型騒音線量計、耳内/耳近傍型騒音線量計に分類されます。
- 用途別に見ると、市場は航空宇宙および防衛、自動車、建設、工場および企業に分類されます。
地域別騒音計市場シェア分析
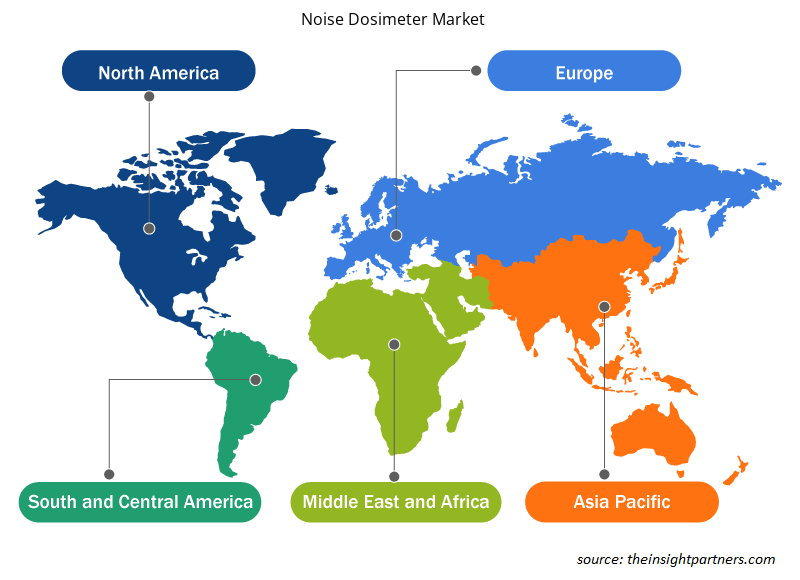
騒音線量計市場レポートの地理的範囲は、主に北米、アジア太平洋、ヨーロッパ、中東およびアフリカ、南米および中米の 5 つの地域に分かれています。
アジア太平洋地域は騒音計市場を独占しています。産業騒音の推定は、交通騒音の推定とは大きく異なります。入力データセットのコレクションを使用して予測できる交通騒音とは対照的に、産業騒音には同様のアプローチはありません。産業源がどれだけの量を放出するかを判断する唯一の方法は、それを測定することです。産業騒音放出の増加とそれを制御する必要性が高まっているため、アジア太平洋地域のいくつかの業界では騒音計が導入されています。
騒音計市場の地域別分析
予測期間を通じて騒音線量計市場に影響を与える地域的な傾向と要因は、Insight Partners のアナリストによって徹底的に説明されています。このセクションでは、北米、ヨーロッパ、アジア太平洋、中東、アフリカ、南米、中米にわたる騒音線量計市場のセグメントと地理についても説明します。
- 騒音計市場の地域別データを入手
騒音計市場レポートの範囲
| レポート属性 | 詳細 |
|---|---|
| 2023年の市場規模 | 6億9,174万米ドル |
| 2031年までの市場規模 | 10億422万米ドル |
| 世界のCAGR(2023年~2031年) | 4.4 % |
| 履歴データ | 2021-2022 |
| 予測期間 | 2024-2031 |
| 対象セグメント |
タイプ別
|
| 対象地域と国 |
北米
|
| 市場リーダーと主要企業プロフィール |
|
騒音計市場のプレーヤー密度:ビジネスダイナミクスへの影響を理解する
騒音線量計市場は、消費者の嗜好の変化、技術の進歩、製品の利点に対する認識の高まりなどの要因により、エンドユーザーの需要が高まり、急速に成長しています。需要が高まるにつれて、企業は提供を拡大し、消費者のニーズを満たすために革新し、新たなトレンドを活用し、市場の成長をさらに促進しています。
市場プレーヤー密度とは、特定の市場または業界内で活動している企業または会社の分布を指します。これは、特定の市場スペースに、その規模または総市場価値と比較して、どれだけの競合相手 (市場プレーヤー) が存在するかを示します。
騒音線量計市場で事業を展開している主要企業は次のとおりです。
- ブリュエル&ケアー
- カセラ(IDEAL INDUSTRIES,INC.)
- チェスバインストルメンツSLU
- 3M
- スヴァンテック
- シーラス・リサーチ
免責事項:上記の企業は、特定の順序でランク付けされていません。
- 騒音線量計市場のトップキープレーヤーの概要を入手
騒音計市場のニュースと最近の動向
騒音線量計市場は、主要な企業出版物、協会データ、データベースなどの一次調査と二次調査後の定性的および定量的データを収集することによって評価されます。騒音線量計市場の動向のいくつかを以下に示します。
- TSI は、最新の騒音線量測定法である Quest™ Edge 7 個人用騒音線量計を発売しました。騒音の多い作業環境では、作業員の聴覚を保護することが安全と健康の維持に不可欠です。TSI® Quest™ Edge 個人用騒音線量計は、聴覚障害の脅威を特定し、聴覚保護プログラムと工学的制御の設計に役立つように設計された強力で直感的な計測器です。(出典: TSI、プレスリリース、2023 年 7 月)
- 新しい SKC NoiseCHEK 個人用騒音計のご紹介 職場で高レベルの騒音に過度にさらされると、労働者は難聴やその他の健康問題を引き起こす可能性があるため、Safe Work Australia が制定した騒音暴露基準で規制されています。適切な安全装置を使用して、騒音暴露が 8 時間平均 85 デシベルまたはピーク 140 デシベルを超えないようにすることは、チームの安全を守るために不可欠です。(出典: SKC NoiseCHEK、プレスリリース、2023 年 9 月)
騒音計市場レポートの対象範囲と成果物
「騒音線量計市場規模と予測(2021〜2031年)」レポートでは、以下の分野をカバーする市場の詳細な分析を提供しています。
- 騒音線量計の市場規模と予測(対象範囲に含まれるすべての主要市場セグメントについて、世界、地域、国レベルで)
- 騒音計市場の動向、および推進要因、制約、主要な機会などの市場動向
- 詳細なPEST/ポーターの5つの力とSWOT分析
- 主要な市場動向、世界および地域の枠組み、主要プレーヤー、規制、最近の市場動向を網羅した騒音線量計市場分析
- 市場集中、ヒートマップ分析、主要プレーヤー、騒音線量計市場の最近の動向を網羅した業界展望と競争分析
- 詳細な企業プロフィール

Naveenは、カスタム、シンジケート、コンサルティングの各プロジェクトにおいて9年以上の実績を持つ、経験豊富な市場調査およびコンサルティングのプロフェッショナルです。現在はアソシエイトバイスプレジデントを務め、プロジェクトバリューチェーン全体にわたるステークホルダー管理を成功させ、100件以上の調査レポートと30件以上のコンサルティング案件を執筆しています。産業および政府機関のプロジェクトに幅広く携わり、クライアントの成功とデータに基づく意思決定に大きく貢献しています。
Naveenは、カルナータカ州VTUで電子通信工学の学位を取得し、マニパル大学でマーケティング&オペレーションズのMBAを取得しています。IEEEの会員として9年間活動し、会議や技術シンポジウムへの参加、セクションレベルおよび地域レベルでのボランティア活動に積極的に取り組んでいます。現職以前は、IndustryARCでアソシエイト戦略コンサルタント、Hewlett Packard(HP Global)で産業用サーバーコンサルタントを務めていました。
- 包括的な市場規模および予測分析
- 詳細なセグメンテーション分析
- 市場動向(ダイナミクス)の徹底的な評価
- 地域および国別のインサイト
- 競争環境および企業ベンチマーク
- 戦略的ビジネスインテリジェンス
お客様の声
Insight PartnersのSCADAシステム市場レポートは包括的で、現在のトレンドと将来の予測に関する貴重な洞察が含まれています。チームは終始、非常にプロフェッショナルで、対応が早く、サポートも充実していました。私たちは彼らのサービスに非常に満足しており、強くお勧めします。
ラン・ケデム パートナー, レアリテクノロジーズ株式会社非常に特殊なソフトウェア市場に関するレポートを依頼したところ、チームは数日でレポートを作成してくれました。情報は非常に関連性が高く、分かりやすくまとめられていました。その後、レポートにいくつか修正と追加を依頼しましたが、チームは非常に迅速に対応し、1週間も経たないうちに最終レポートを受け取ることができました。
ジャン=エルヴェ・ジェン 会長, フューチャー・アナリティカ重要な市場調査と予測のために、The Insight Partnersと協力しました。彼らは機会とリスクに関する明確な洞察を提供し、私たちの計画策定に役立ちました。彼らの調査は使いやすく、確かなデータに基づいており、賢明で自信に満ちた意思決定に役立ちました。彼らを強くお勧めします。
ピユーシュ・ナグパル 上級副社長, ハイビームグローバルInsight Partnersは、深い専門知識に基づき、洞察力に富み、構造化された市場調査を提供しました。チームは終始プロフェッショナルで、対応力も抜群でした。ユーザーフレンドリーなウェブサイトにより、業界レポートへのアクセスもスムーズでした。信頼性の高い高品質な調査サービスをお探しなら、Insight Partnersを強くお勧めします。
安達幸彦 最高経営責任者(CEO), ディープブルーLLC。The Insight Partnersから市場レポートを購入するのは今回が初めてです。最初は不安でしたが、ウェブサイトを見て、リスクを負ってでも購入してみようという気持ちになりました。レポートの品質とカスタマーサービスには大変満足しています。最初のレポートにはいくつか質問やコメントがありましたが、アナリストとメールで何度かやり取りした結果、戦略策定プロセスへのインプットとして活用できるレポートが完成しました。貴重なお時間を割いていただき、貴重な体験をさせていただき、誠にありがとうございました。他の方にもぜひお勧めしたいですし、今後さらに市場データが必要になった際には、まずThe Insight Partnersにご連絡させていただきます。
ジョン・スズキ 社長兼最高経営責任者、取締役, BKテクノロジーズナイジェリアの感染症IVD市場に関する情報提供依頼に対し、ご対応いただいた際、ご尽力とプロフェッショナルな姿勢に深く感謝申し上げます。忍耐強く、的確なアドバイスをいただき、また、最終的に取引成立に至った割引のご提供にも深く感謝申し上げます。今回の最初の出会いで得た強い印象のおかげで、今後もThe Insight Partnersとの連携を心待ちにしております。
チジオケ博士 オニア マネージングディレクター, パインクレストヘルスケア株式会社購入理由
- 情報に基づいた意思決定
- 市場動向の理解
- 競合分析
- 顧客インサイト
- 市場予測
- リスク軽減
- 戦略計画
- 投資の正当性
- 新興市場の特定
- マーケティング戦略の強化
- 業務効率の向上
- 規制動向への対応


