眼科用機器市場の成長、規模、シェア、傾向、主要プレーヤーの分析、2031年までの予測
過去データ : 2021-2022 | 基準年 : 2023 | 予測期間 : 2024-2031眼科用機器市場の規模と予測(2021年 - 2031年)、世界および地域別のシェア、トレンド、成長機会分析レポートの対象範囲:製品別(視力ケア製品、外科用機器、診断およびモニタリング機器)、適応症別(白内障、緑内障、屈折異常、その他の適応症)、エンドユーザー別(病院および眼科クリニック、学術研究機関、その他のエンドユーザー)、および地域別(北米、ヨーロッパ、アジア太平洋、中東およびアフリカ、南米および中米)
- ステータス : 公開されたデータ
- レポートコード : TIPRE00008650
- カテゴリー : ライフサイエンス
- ページ数 : 150
- 利用可能なレポート形式 :


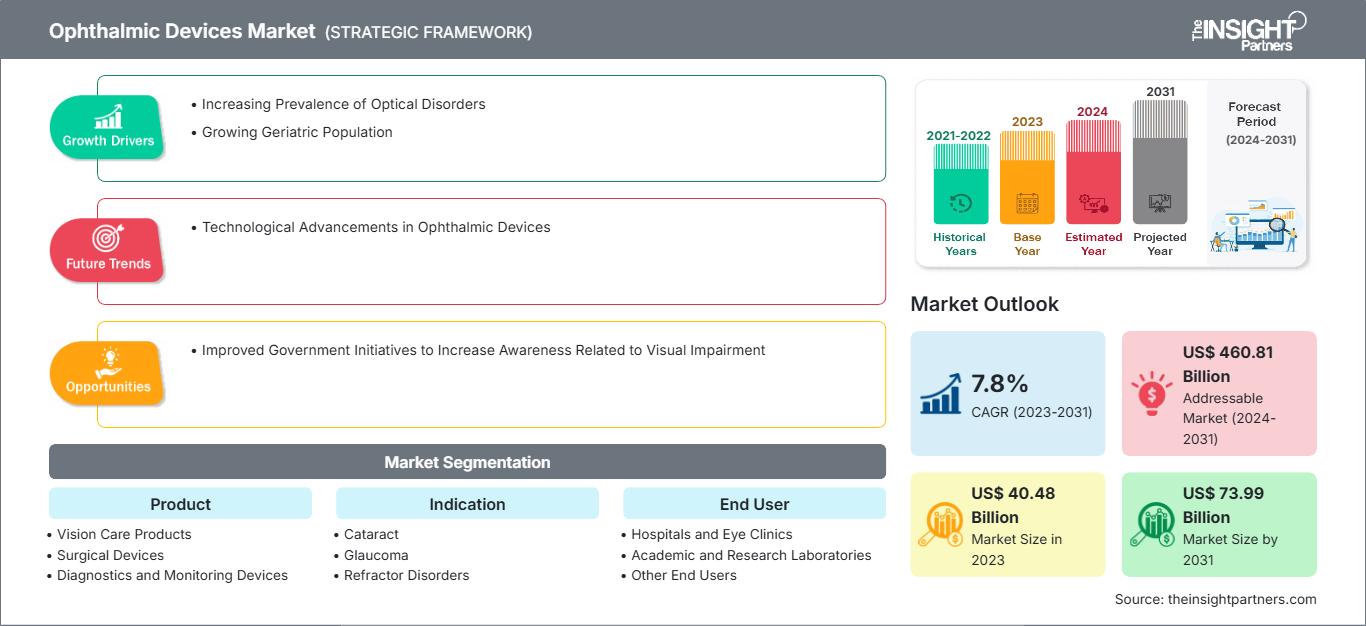
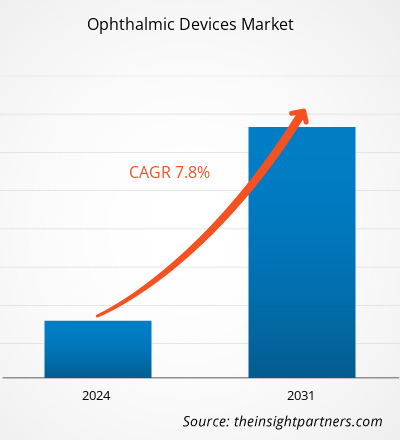
眼科機器市場規模は、2023年の404億8,000万米ドルから2031年には739億9,000万米ドルに達すると予測されており、2023年から2031年にかけて7.8%の年平均成長率(CAGR)を記録すると見込まれています。
眼科機器は、視力矯正、診断、手術目的で使用される医療機器です。緑内障、白内障、その他の視力関連疾患の症例増加に伴い、近年、眼科機器の認知度と普及が急速に進んでいます。高齢化人口の増加と視覚障害の有病率の急上昇は、今後数年間で眼科機器市場の成長を促進すると予測されています。眼科用機器市場の動向には、眼科用機器における技術的進歩が含まれており、これが将来的に市場の成長を後押しするでしょう。
成長ドライバー:
米国、英国、カナダ、日本などの先進国、および中国、インド、韓国などの発展途上国では、医療施設の近代化と医療サービスの向上により老年人口が急増しており、これらの国では平均寿命が延びています。人口の高齢化は、世界の社会的、経済的側面に大きな影響を与えています。世界中のさまざまな国で、高齢者を安全かつ効果的に治療するための新しい技術が採用されています。したがって、生活の質の向上は死亡率の低下につながり、老年人口の急増を引き起こしています。世界保健機関の2022年のデータによると、2030年までに6人に1人が60歳以上になります。 60歳以上の人口は、2021年の9億人から2050年までに20億人に増加すると予想されています。この年齢層の世界人口の割合は、2015年の12%から2050年までに22%に倍増するでしょう。経済社会省の2019年の国連報告書によると、約7億300万人が65歳以上であり、その数は2050年までに15億人に倍増すると予測されています。
緑内障は、60歳以上の人々の間で失明の主な原因であり、60歳を超えると緑内障を発症する可能性が6倍高くなります。国立緑内障研究ファクトシート2022によると、300万人以上のアメリカ人が緑内障を患っており、そのうち270万人が40歳以上です。失明の他の原因としては、糖尿病網膜症、加齢黄斑変性、網膜剥離などが挙げられます。米国疾病管理予防センター(CDC)によると、2021年の米国における糖尿病網膜症の有病率は、25歳未満で最も低く(13.0%)、65~79歳で最も高く(28.4%)なっています。加齢性眼疾患は、米国における失明や視力低下の主な原因としても挙げられています。高齢化社会では、早期診断と治療が必要な様々な眼疾患にかかりやすく、それが眼科機器の需要を押し上げ、眼科機器市場の成長に貢献しています。
要件に合わせてレポートをカスタマイズ
レポートの一部、国レベルの分析、Excelデータパックなどを含め、スタートアップ&大学向けに特別オファーや割引もご利用いただけます(無償)
眼科機器市場: 戦略的洞察
-
このレポートの主要な市場動向を入手してください。この無料サンプルには、市場動向から見積もりや予測に至るまでのデータ分析が含まれます。
レポートのセグメンテーションと範囲:
眼科用機器市場分析は、製品、適応症、エンドユーザー、および地理のセグメントを考慮して実施されています。製品に基づいて、市場は視力ケア製品、外科用機器、および診断およびモニタリング機器に分割されています。適応症の点では、市場は白内障、緑内障、屈折異常、およびその他の適応症に分類されます。エンドユーザーに基づいて、市場は病院と眼科クリニック、学術研究機関、およびその他のエンドユーザーに分類されます。眼科用機器市場レポートの範囲は、北米(米国、カナダ、メキシコ)、ヨーロッパ(フランス、ドイツ、イギリス、スペイン、イタリア、その他のヨーロッパ)、アジア太平洋(中国、日本、インド、韓国、オーストラリア、その他のアジア太平洋)、中東およびアフリカ(サウジアラビア、南アフリカ、UAE、その他の中東およびアフリカ)、南アフリカおよび
セグメント分析:
眼科用機器市場は、製品別に、視力ケア製品、外科用機器、診断およびモニタリング機器に分類されています。視力ケア製品セグメントは、2023年に大きな市場シェアを占めました。2023~2031年には市場で最高のCAGRを記録すると予想されています。
適応症に基づいて、市場は白内障、緑内障、屈折異常、およびその他の適応症に分類されています。緑内障セグメントは、2023年に眼科用機器市場で大きなシェアを占め、2023~2031年には最高のCAGRを記録すると予測されています。
エンドユーザーに基づいて、市場は病院や眼科クリニック、学術研究機関、その他のエンドユーザーに分割されています。病院と眼科クリニック部門は、2023年に眼科機器市場で大きなシェアを占め、2023~2031年に最高のCAGRを記録すると予想されています。
地域分析:
地理的には、眼科機器市場は北米、ヨーロッパ、アジア太平洋、南米および中米、中東およびアフリカに分割されています。2023年には、北米が市場の大きなシェアを獲得しました。2023年には、米国がこの地域の眼科機器市場を支配しました。北米の市場成長は、白内障、緑内障、糖尿病網膜症、加齢黄斑変性(AMD)、屈折疾患などの眼疾患の負担の増大、高齢者人口の増加、技術的に高度な眼科機器の急速な普及、およびこの地域における重要な市場プレーヤーの存在に起因しています。米国では65歳以上の人口増加に伴い、AMDなどの加齢性疾患の症例が増加しています。米国国立衛生研究所の報告書によると、AMD患者数は2000年から2010年にかけて18%増加し、2000年の175万人から2010年には207万人に達しました。2050年には、その数は207万人から544万人に達すると予測されています。2023年に発表された研究「2021年の米国における糖尿病網膜症の有病率」によると、2021年の米国では約960万人が糖尿病網膜症を患っており、約180万人が視力を脅かす糖尿病網膜症を患っています。これにより、眼科診断ツールの需要が高まり、この地域の眼科機器市場の成長が促進されます。
眼科機器市場
The Insight Partnersのアナリストは、予測期間を通じて眼科機器市場に影響を与える地域的な動向と要因を詳細に解説しています。このセクションでは、北米、ヨーロッパ、アジア太平洋、中東・アフリカ、中南米における眼科機器市場のセグメントと地域についても解説しています。
眼科機器市場レポートの範囲
| レポート属性 | 詳細 |
|---|---|
| の市場規模 2023 | US$ 40.48 Billion |
| 市場規模別 2031 | US$ 73.99 Billion |
| 世界的なCAGR (2023 - 2031) | 7.8% |
| 過去データ | 2021-2022 |
| 予測期間 | 2024-2031 |
| 対象セグメント |
By 製品
|
| 対象地域と国 |
北米
|
| 市場リーダーと主要企業の概要 |
|
眼科用機器市場のプレーヤー密度:ビジネスダイナミクスへの影響を理解する
眼科用機器市場は、消費者の嗜好の変化、技術の進歩、製品メリットへの認知度の高まりといった要因によるエンドユーザーの需要増加に牽引され、急速に成長しています。需要の増加に伴い、企業は製品ラインナップの拡充、消費者ニーズへの対応のためのイノベーション、そして新たなトレンドの活用を進めており、これが市場の成長をさらに加速させています。
- 入手 眼科機器市場 主要プレーヤーの概要
業界の発展と将来の機会:
眼科機器市場レポートには、市場における競合他社のパフォーマンスを評価するための企業の位置付けと集中が含まれています。各社のプレスリリースによると、市場で活動している主要企業が講じているいくつかの取り組みは次のとおりです。
- 2021年7月、トプコン株式会社は、イタリアのフィレンツェ郊外に本社を置く眼科機器メーカーであるVISIA Imaging Srlを買収しました。この買収により、トプコンは眼底カメラや光干渉断層撮影法など、優位な眼底イメージング機器のポートフォリオをさらに強化する予定です。この買収により、トプコンの前眼部機器とソフトウェアの開発・生産能力が強化されます。この買収は、眼科診断ツールのトップメーカーとしてのトプコンの地位を強化することも目的としています。
- 2021年3月、Iridex CorporationはTopcon Corporationと戦略的提携を締結しました。Iridex Corporationは、緑内障や網膜疾患の治療のための革新的な眼科用レーザーベースの医療製品の有名なプロバイダーです。Iridexは、独自のMicroPulseテクノロジーとTopconのPASCALレーザープラットフォームを組み合わせたTopconのPASCAL製品ラインを買収し、網膜スキャンレーザー製品市場でのシェアを拡大しました。
競合状況と主要企業:
眼科機器市場の予測は、利害関係者が成長戦略を計画するのに役立ちます。アルコン、Topcon、Bausch + Lomb、Carl Zeiss Meditec、Haag Streit Holding、Essilor、Johnson & Johnson Vision、Nidek Co. Ltd、Hoya Corporation、CooperVisionなどが、市場で紹介されている著名な企業です。これらの企業は、世界中で高まる消費者需要を満たすために、新しいハイテク製品の導入、既存製品の改良、地理的拡大に重点を置いています。

ムリナル氏は、ライフサイエンス分野の市場インテリジェンスとコンサルティングで8年以上の経験を持つ、経験豊富なリサーチアナリストです。戦略的な思考と揺るぎない卓越性へのコミットメントに基づき、医薬品市場予測、市場機会評価、業界ベンチマークの開発において深い専門知識を培ってきました。彼女の業務は、クライアントが情報に基づいた戦略的意思決定を行えるよう、実用的なインサイトを提供することに重点を置いています。
ムリナル氏の強みは、複雑な定量データセットを有意義なビジネスインテリジェンスへと変換することにあります。彼女の分析力は、医薬品および医療機器分野における市場開拓(GTM)戦略の策定と成長機会の発掘に大きく貢献しています。信頼できるコンサルタントとして、ワークフロープロセスの合理化とベストプラクティスの確立に常に注力し、クライアントのイノベーションと業務効率の向上に貢献しています。
- 過去2年間の分析、基準年、CAGRによる予測(7年間)
- PEST分析とSWOT分析
- 市場規模価値/数量 - 世界、地域、国
- 業界と競争環境
- Excel データセット
お客様の声
Insight PartnersのSCADAシステム市場レポートは包括的で、現在のトレンドと将来の予測に関する貴重な洞察が含まれています。チームは終始、非常にプロフェッショナルで、対応が早く、サポートも充実していました。私たちは彼らのサービスに非常に満足しており、強くお勧めします。
ラン・ケデム パートナー, レアリテクノロジーズ株式会社非常に特殊なソフトウェア市場に関するレポートを依頼したところ、チームは数日でレポートを作成してくれました。情報は非常に関連性が高く、分かりやすくまとめられていました。その後、レポートにいくつか修正と追加を依頼しましたが、チームは非常に迅速に対応し、1週間も経たないうちに最終レポートを受け取ることができました。
ジャン=エルヴェ・ジェン 会長, フューチャー・アナリティカ重要な市場調査と予測のために、The Insight Partnersと協力しました。彼らは機会とリスクに関する明確な洞察を提供し、私たちの計画策定に役立ちました。彼らの調査は使いやすく、確かなデータに基づいており、賢明で自信に満ちた意思決定に役立ちました。彼らを強くお勧めします。
ピユーシュ・ナグパル 上級副社長, ハイビームグローバルInsight Partnersは、深い専門知識に基づき、洞察力に富み、構造化された市場調査を提供しました。チームは終始プロフェッショナルで、対応力も抜群でした。ユーザーフレンドリーなウェブサイトにより、業界レポートへのアクセスもスムーズでした。信頼性の高い高品質な調査サービスをお探しなら、Insight Partnersを強くお勧めします。
安達幸彦 最高経営責任者(CEO), ディープブルーLLC。The Insight Partnersから市場レポートを購入するのは今回が初めてです。最初は不安でしたが、ウェブサイトを見て、リスクを負ってでも購入してみようという気持ちになりました。レポートの品質とカスタマーサービスには大変満足しています。最初のレポートにはいくつか質問やコメントがありましたが、アナリストとメールで何度かやり取りした結果、戦略策定プロセスへのインプットとして活用できるレポートが完成しました。貴重なお時間を割いていただき、貴重な体験をさせていただき、誠にありがとうございました。他の方にもぜひお勧めしたいですし、今後さらに市場データが必要になった際には、まずThe Insight Partnersにご連絡させていただきます。
ジョン・スズキ 社長兼最高経営責任者、取締役, BKテクノロジーズナイジェリアの感染症IVD市場に関する情報提供依頼に対し、ご対応いただいた際、ご尽力とプロフェッショナルな姿勢に深く感謝申し上げます。忍耐強く、的確なアドバイスをいただき、また、最終的に取引成立に至った割引のご提供にも深く感謝申し上げます。今回の最初の出会いで得た強い印象のおかげで、今後もThe Insight Partnersとの連携を心待ちにしております。
チジオケ博士 オニア マネージングディレクター, パインクレストヘルスケア株式会社購入理由
- 情報に基づいた意思決定
- 市場動向の理解
- 競合分析
- 顧客インサイト
- 市場予測
- リスク軽減
- 戦略計画
- 投資の正当性
- 新興市場の特定
- マーケティング戦略の強化
- 業務効率の向上
- 規制動向への対応


 無料サンプルを入手 - 眼科機器市場