シャープスコンテナ市場戦略、トッププレーヤー、成長機会、分析、2030年までの予測
過去データ : 2020-2021 | 基準年 : 2022 | 予測期間 : 2023-20302030年までのシャープス容器市場予測 - 製品別(多目的容器、病室用容器、採血容器)、用途別(再利用可能容器、使い捨て容器)、廃棄物の種類別(感染性廃棄物、非感染性廃棄物)、廃棄物発生元別(病院、製薬会社、研究所、診療所、医師の診療所、その他)、容器サイズ別(1~3ガロン、4~6ガロン、7~8ガロン、その他)、流通チャネル別(医療用品会社、薬局、オンライン販売、その他)、地域別グローバル分析
- ステータス : 出版
- レポートコード : TIPMD00002581
- カテゴリー : ライフサイエンス
- ページ数 : 213
- 利用可能なレポート形式 :


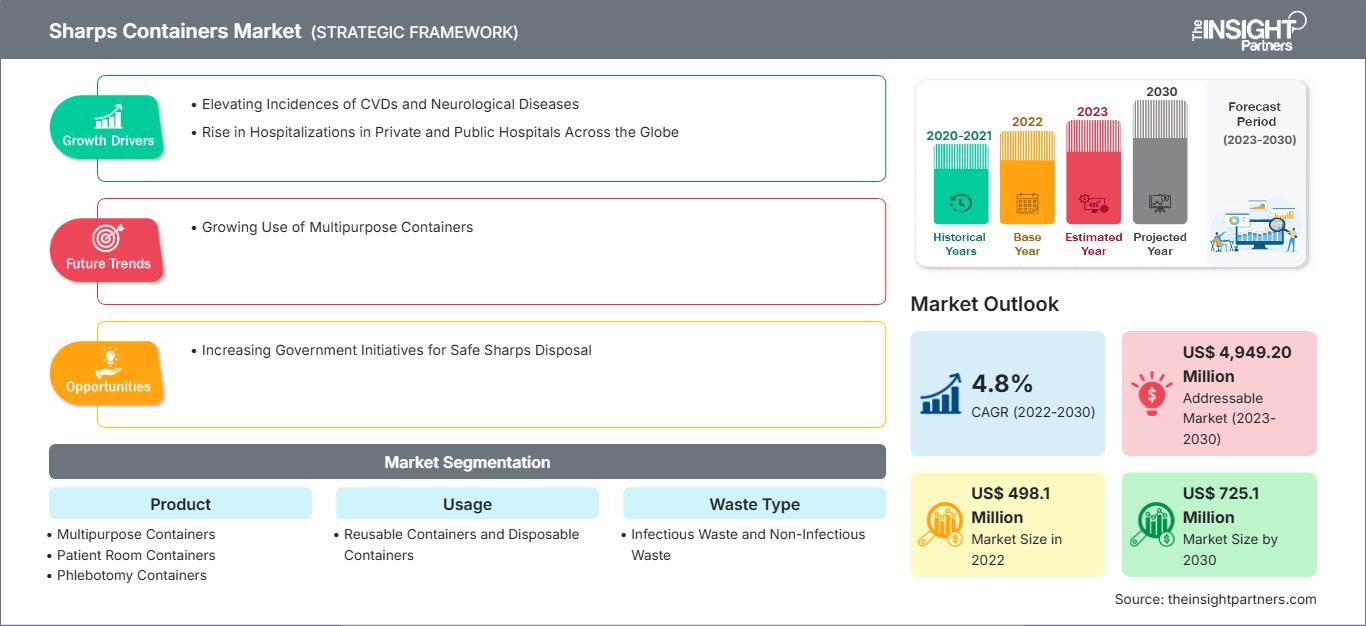
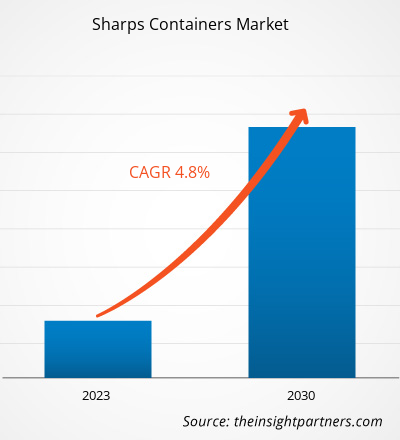
[調査レポート] 鋭利物容器市場は2022年に4億9,810万米ドルと評価され、2030年には7億2,510万米ドルに達すると予測されています。また、2022年から2030年にかけて4.8%の年平均成長率(CAGR)を記録すると予想されています。
市場分析とアナリストの見解:
「鋭利物」とは、針、注射器、割れたガラス、ランセット、自動注射器、点滴セット、接続針など、皮膚に穴を開けたり切ったりする可能性のある鋭利な先端または縁を持つ物体を指します。鋭利物容器は、使用済みの針やその他の鋭利な医療廃棄物を廃棄するために特別に設計されています。鋭利物使用者やその他の下流作業員を含む病院職員を、針やその他の鋭利器具との接触による鋭利物傷害から保護するように設計されています。鋭利物廃棄容器は、硬くて穴が開きにくいプラスチックまたは金属でできており、側面と底部は漏れにくく、ぴったりとフィットする穴が開きにくい蓋には鋭利物を保管するための開口部があります。医療廃棄物の発生増加と世界中の私立および公立病院の入院増加により、予測期間中に鋭利物容器市場の成長が促進されると予想されます。
成長要因と課題:
医療施設は、発生する医療廃棄物、感染性廃棄物、および危険廃棄物の収集、分別、処分の主な責任を負っています。感染症の蔓延の増加、病院への来院および入院件数の増加、診断および臨床検査の需要の増加は、大量の使い捨て廃棄物の発生に寄与しています。世界保健機関(WHO)によると、世界中で毎年1,600万本の注射剤が使用されていますが、適切な処分方法が必要です。高度な医療施設を有する米国では、針などの鋭利物による血液媒介性病原体への曝露が深刻な問題となっており、年間38万5000件の事例が発生しています。発生する医療廃棄物の85%は一般的な非有害廃棄物であり、残りの15%は有害な微生物を含む有害廃棄物です。そのため、医療廃棄物の処理は喫緊の課題であり、世界中で鋭利物容器の需要が高まっています。
2020年9月に発表された「ユニバーサル・ヘルス・カバレッジ(UHC)適用下の都市コミュニティにおける外科手術の列挙によるインドにおける国家外科ニーズの推定」と題された調査研究によると、世界の疾病負担の約11%は外科手術または麻酔ケア、あるいはその両方を必要としており、インドの人口の外科ニーズを満たすには年間3,646件の手術が必要になると推定されています。これは、世界全体で推定される10万人あたり5,000件の手術と比較して高い数値です。そのため、慢性疾患の負担増加に伴い、世界中で外科手術が増加しており、メス、針、静脈注射器などの鋭利な医療器具が広く使用されるようになっています。これにより、鋭利物容器の需要が増加すると予想されます。
要件に合わせてレポートをカスタマイズ
レポートの一部、国レベルの分析、Excelデータパックなどを含め、スタートアップ&大学向けに特別オファーや割引もご利用いただけます(無償)
シャープスコンテナマーケット: 戦略的洞察
-
このレポートの主要な市場動向を入手してください。この無料サンプルには、市場動向から見積もりや予測に至るまでのデータ分析が含まれます。
しかし、鋭利物の適切な廃棄に関する認識の欠如が、鋭利物容器市場の成長を妨げています。臨床現場では、確立された基準があれば、汚染された物質を安全に廃棄することが容易になります。しかし、医療現場以外では、適切に設計された鋭利物容器の使用を義務付ける基準はありません。糖尿病患者のほとんどは、鋭利物廃棄のベストプラクティス、つまり、指定された鍵付きの廃棄物容器に鋭利物を廃棄する手順に従っていません。保管ベイに適切な鋭利物コンパートメントがないため、収集後に廃棄物が混ざり合っています。WHOによると、鋭利物やその他の医療廃棄物の安全な廃棄に関連する最も一般的な問題は、健康被害に対する認識の欠如です。これは、トレーニングが不十分で、適切な廃棄物管理への優先順位が低いことが原因です。
レポートのセグメンテーションと範囲:
「世界の鋭利器材容器市場」は、製品、用途、廃棄物の種類、廃棄物発生者、容器サイズ、流通チャネル、および地域に基づいてセグメント化されています。製品に基づいて、鋭利器材容器市場は、多目的容器、病室用容器、および瀉血容器に細分化されています。用途に基づいて、鋭利器材容器市場は、再利用可能な容器と使い捨て容器に細分化されています。廃棄物の種類に基づいて、鋭利器材容器市場は感染性廃棄物と非感染性廃棄物に二分されています。廃棄物発生者に基づいて、鋭利器材容器市場は、病院、製薬会社、研究所、診療所、診療所、その他に細分化されています。容器サイズに基づいて、鋭利物容器市場は1~3ガロン、4~6ガロン、7~8ガロン、その他に分類されます。流通チャネルに基づいて、鋭利物容器市場は医療用品会社、薬局、オンライン販売、その他に分類されます。地域に基づいて、鋭利物容器市場は北米(米国、カナダ、メキシコ)、ヨーロッパ(ドイツ、フランス、イタリア、英国、スペイン、その他ヨーロッパ)、アジア太平洋(オーストラリア、中国、日本、インド、韓国、その他アジア太平洋)、中東およびアフリカ(南アフリカ、サウジアラビア、UAE、その他中東およびアフリカ)、南アフリカおよび米国に分類されます。中央アメリカ(ブラジル、アルゼンチン、その他中南米)
セグメント分析:
製品別に見ると、鋭利物容器市場は多目的容器、病室用容器、瀉血用容器に分類されます。多目的容器セグメントは、鋭利物容器市場で最大のシェアを占めています。同セグメントは、予測期間中に市場で最も高いCAGR(年平均成長率)である5.2%を記録すると予想されています。多目的鋭利物容器は、一時的および恒久的な閉鎖機構を備え、さまざまなサイズの鋭利物に対応します。この製品は大型の鋭利物に対応するように設計されており、フリップ、スライド、回転式など、さまざまな蓋の選択肢があります。多目的容器は、特定のスペースや機能に限定されるものではなく、さまざまな環境で簡単に使用でき、組み立てが簡単で安価です。さらに、医療従事者にとって最大限の安全性を提供し、環境にも優しい製品です。したがって、医療廃棄物の増加、複数の手術、および他のタイプよりも多目的容器の機能が多目的容器の成長をもたらし、それによって鋭利物容器市場を押し上げると予想されます。
使用方法に基づいて、鋭利物容器市場は再利用可能な容器と使い捨て容器に分かれています。2022年には、再利用可能な容器セグメントが市場で大きなシェアを占めました。ただし、使い捨て容器セグメントは、予測期間中に市場で5.4%という高いCAGRを記録すると予想されています。使い捨て容器は、シングルユース鋭利物容器とも呼ばれます。使い捨て鋭利物容器は、病室での鋭利物廃棄物の収集に便利です。一般に、鋭利物廃棄容器は、FDAによってクラスIIデバイスとして規制されており、市販前通知[510(k)]要件の対象となります(21 CFR 880.5570、製品コードMKKおよびFMI)。 FDA承認済みの鋭利物廃棄容器は、外出時に使用できる小型の旅行用サイズなど、様々なサイズで提供されています。前述の要因は、使い捨て容器セグメントの市場成長を促進すると予想されます。
廃棄物の種類に基づいて、鋭利物容器市場は感染性廃棄物と非感染性廃棄物に分類されます。2022年には、感染性廃棄物セグメントが市場でより大きなシェアを占め、予測期間中に5.0%という高いCAGRを記録すると予想されています。鋭利物からの廃棄物は感染性廃棄物の一部であり、注射器、針、ランセット、割れたガラス、および皮膚を貫通する可能性のあるその他の物質が含まれます。病原体汚染と皮膚バリアを貫通する能力の組み合わせにより、鋭利物は最も危険な医療廃棄物の1つとなっています。世界保健機関(WHO)によると、年間160億回の注射のうち、鋭利物および鋭利物廃棄物の大部分は注射器です。
廃棄物発生者に基づいて、鋭利物容器市場は、病院、製薬会社、研究所、診療所、診療所、その他に分類されています。 2022年には、病院セグメントが市場で最大のシェアを占め、同じセグメントは予測期間中に市場で5.5%という最高のCAGRを記録すると予想されています。 病院は廃棄物発生の重要な場所です。病院のすべての部門で廃棄物が発生し、全体としてさまざまな種類の廃棄物になります。これらのアイテムは病原性があり、環境に有害である可能性があります。これらの廃棄物は、危険な医療廃棄物とも呼ばれます。病院は鋭利廃棄物容器の主な消費者です。
容器のサイズに基づいて、鋭利物容器市場は1~3ガロン、4~6ガロン、7~8ガロンなどに分類されています。2022年には、1~3ガロンのセグメントが市場で最大のシェアを占め、同じセグメントは予測期間中に市場で5.2%という最高のCAGRを記録すると予想されています。鋭利容器の容量は1~3ガロンです。これらの鋭利物容器のサイズは、主に医療業界で使用されています。この製品は壁に取り付けることも、カウンタートップで使用することもできます。大きな水平開口部により、廃棄が容易です。研究所、診療所、診療所、病院、手術センターなどの医療施設が、これらの製品の主な消費者です。さらに、4ガロンの鋭利物容器は、廃棄物の量が多い病院や製薬会社で一般的に使用されています。これらの容器は主に、病院、研究室、診断室で発生する外科廃棄物などのバイオハザード物質を処分します。
流通チャネルに基づいて、鋭利物容器市場は、医療用品会社、薬局、オンライン販売、その他に分類されています。 2022年には、医療用品会社セグメントが市場で最大のシェアを占めました。 オンライン販売セグメントは、予測期間中に市場で最も高いCAGR 5.3%を記録すると予想されています。
地域分析:
地理に基づいて、鋭利物容器市場は、北米、ヨーロッパ、アジア太平洋、南米および中米、中東およびアフリカの5つの主要地域に分かれています。 北米の鋭利物容器市場は、米国、カナダ、メキシコの3つの主要国に基づいて分析されています。 米国は、予測期間中に最大の鋭利物容器市場シェアを保持すると推定されています。米国における鋭利物容器市場の成長は、糖尿病や針刺し事故の増加、そして政府の取り組みの強化に起因しています。自己注射薬で治療可能なクローン病や糖尿病などの慢性疾患の有病率は、米国全土で増加しています。例えば、CDCの2022年全国糖尿病統計報告書の推定によると、米国では1億3000万人以上の成人が糖尿病または糖尿病前症を患っています。薬剤投与や検査の重要性から、注射器は慢性疾患の治療におけるほとんどの診断および治療技術に必要であり、鋭利物容器の需要を押し上げています。
ヨーロッパは鋭利物容器の2番目に大きな市場です。ドイツは予測期間中、ヨーロッパの鋭利物容器市場で最大のシェアを占めると予想されています。ドイツやイギリスなどの高成長国は、この地域の鋭利物容器市場の成長に貢献しています。フランスとスペインは、サプライチェーンの改善と廃棄物管理への意識向上に取り組んでおり、これがこの地域の市場成長の重要な推進力となるでしょう。欧州の規制当局は、環境に優しく費用対効果の高い再利用可能な鋭利器材容器に関する、有利かつ厳格なガイドラインの導入に取り組んでいます。さらに、糖尿病などの疾患の蔓延やCOVID-19ワクチン接種キャンペーンにより、適切な処分を必要とする鋭利器材とその廃棄物が大量に発生し、鋭利器材容器市場が拡大しています。しかし、経済力の弱いヨーロッパ諸国におけるコンプライアンスの欠如と使い捨て鋭利物容器の導入は、この地域の成長を阻害すると予想されています。
COVID-19の影響:
2022年6月にJournal Virusesに掲載された「科学者が抗SARS-CoV-2薬スクリーニングに適したヒト細胞株を開発」と題された研究によると、研究者らは、重症急性呼吸器症候群(SARS-CoV-2)を引き起こすコロナウイルス2を標的とした抗ウイルス薬のハイスループット試験に適したヒト細胞株の作成について報告しています。ウイルスの侵入に必要な2つの必須宿主タンパク質であるアンジオテンシン変換酵素2(ACE2)と膜貫通型セリンプロテアーゼ2(TMPRSS2)は、ヒト肺癌細胞株A549で高レベルに発現するように設計されました。その結果、COVID-19を管理するための細胞株がさらに開発され、パンデミック中の鋭利物容器市場に大きな影響を与えました。したがって、パンデミックは鋭利物容器市場にプラスの影響を与えました。
シャープス容器市場の地域別分析
予測期間全体を通してシャープス容器市場に影響を与える地域的な傾向と要因は、The Insight Partnersのアナリストによって徹底的に説明されています。このセクションでは、シャープス容器市場のセグメントと地域についても、北米、ヨーロッパ、アジア太平洋、中東・アフリカ、中南米に分けて解説しています。
シャープス容器市場レポートの範囲
| レポート属性 | 詳細 |
|---|---|
| の市場規模 2022 | US$ 498.1 Million |
| 市場規模別 2030 | US$ 725.1 Million |
| 世界的なCAGR (2022 - 2030) | 4.8% |
| 過去データ | 2020-2021 |
| 予測期間 | 2023-2030 |
| 対象セグメント |
By 製品
|
| 対象地域と国 |
北米
|
| 市場リーダーと主要企業の概要 |
|
シャープス容器市場のプレーヤー密度:ビジネスダイナミクスへの影響を理解する
シャープス容器市場は、消費者の嗜好の変化、技術の進歩、製品の利点に対する認知度の高まりといった要因によるエンドユーザーの需要増加に牽引され、急速に成長しています。需要の増加に伴い、企業は製品ラインナップの拡充、消費者ニーズへの対応のための革新、そして新たなトレンドの活用を進めており、これが市場の成長をさらに加速させています。
- 入手 シャープスコンテナマーケット 主要プレーヤーの概要
競争環境と主要企業:
世界の鋭利物容器市場で事業を展開している主要企業には、Sanypick Plastic SA、Bondtech Corp、Mauser Group NV、EnviroTain LLC、Stericycle Inc、Dailymag Magnetic Technology Ltd、GPC Medical Ltd、Bemis Co Inc、Becton Dickinson and Co、The Harloff Coなどが挙げられます。これらの企業は、世界中で高まる消費者需要に対応し、専門分野の製品ラインナップを拡充するため、新製品の発売と地理的拡大に注力しています。世界中に広く展開することで、幅広い顧客にサービスを提供し、鋭利物容器市場シェアを拡大しています。

ムリナル氏は、ライフサイエンス分野の市場インテリジェンスとコンサルティングで8年以上の経験を持つ、経験豊富なリサーチアナリストです。戦略的な思考と揺るぎない卓越性へのコミットメントに基づき、医薬品市場予測、市場機会評価、業界ベンチマークの開発において深い専門知識を培ってきました。彼女の業務は、クライアントが情報に基づいた戦略的意思決定を行えるよう、実用的なインサイトを提供することに重点を置いています。
ムリナル氏の強みは、複雑な定量データセットを有意義なビジネスインテリジェンスへと変換することにあります。彼女の分析力は、医薬品および医療機器分野における市場開拓(GTM)戦略の策定と成長機会の発掘に大きく貢献しています。信頼できるコンサルタントとして、ワークフロープロセスの合理化とベストプラクティスの確立に常に注力し、クライアントのイノベーションと業務効率の向上に貢献しています。
- 過去2年間の分析、基準年、CAGRによる予測(7年間)
- PEST分析とSWOT分析
- 市場規模価値/数量 - 世界、地域、国
- 業界と競争環境
- Excel データセット
お客様の声
Insight PartnersのSCADAシステム市場レポートは包括的で、現在のトレンドと将来の予測に関する貴重な洞察が含まれています。チームは終始、非常にプロフェッショナルで、対応が早く、サポートも充実していました。私たちは彼らのサービスに非常に満足しており、強くお勧めします。
ラン・ケデム パートナー, レアリテクノロジーズ株式会社非常に特殊なソフトウェア市場に関するレポートを依頼したところ、チームは数日でレポートを作成してくれました。情報は非常に関連性が高く、分かりやすくまとめられていました。その後、レポートにいくつか修正と追加を依頼しましたが、チームは非常に迅速に対応し、1週間も経たないうちに最終レポートを受け取ることができました。
ジャン=エルヴェ・ジェン 会長, フューチャー・アナリティカ重要な市場調査と予測のために、The Insight Partnersと協力しました。彼らは機会とリスクに関する明確な洞察を提供し、私たちの計画策定に役立ちました。彼らの調査は使いやすく、確かなデータに基づいており、賢明で自信に満ちた意思決定に役立ちました。彼らを強くお勧めします。
ピユーシュ・ナグパル 上級副社長, ハイビームグローバルInsight Partnersは、深い専門知識に基づき、洞察力に富み、構造化された市場調査を提供しました。チームは終始プロフェッショナルで、対応力も抜群でした。ユーザーフレンドリーなウェブサイトにより、業界レポートへのアクセスもスムーズでした。信頼性の高い高品質な調査サービスをお探しなら、Insight Partnersを強くお勧めします。
安達幸彦 最高経営責任者(CEO), ディープブルーLLC。The Insight Partnersから市場レポートを購入するのは今回が初めてです。最初は不安でしたが、ウェブサイトを見て、リスクを負ってでも購入してみようという気持ちになりました。レポートの品質とカスタマーサービスには大変満足しています。最初のレポートにはいくつか質問やコメントがありましたが、アナリストとメールで何度かやり取りした結果、戦略策定プロセスへのインプットとして活用できるレポートが完成しました。貴重なお時間を割いていただき、貴重な体験をさせていただき、誠にありがとうございました。他の方にもぜひお勧めしたいですし、今後さらに市場データが必要になった際には、まずThe Insight Partnersにご連絡させていただきます。
ジョン・スズキ 社長兼最高経営責任者、取締役, BKテクノロジーズナイジェリアの感染症IVD市場に関する情報提供依頼に対し、ご対応いただいた際、ご尽力とプロフェッショナルな姿勢に深く感謝申し上げます。忍耐強く、的確なアドバイスをいただき、また、最終的に取引成立に至った割引のご提供にも深く感謝申し上げます。今回の最初の出会いで得た強い印象のおかげで、今後もThe Insight Partnersとの連携を心待ちにしております。
チジオケ博士 オニア マネージングディレクター, パインクレストヘルスケア株式会社購入理由
- 情報に基づいた意思決定
- 市場動向の理解
- 競合分析
- 顧客インサイト
- 市場予測
- リスク軽減
- 戦略計画
- 投資の正当性
- 新興市場の特定
- マーケティング戦略の強化
- 業務効率の向上
- 規制動向への対応


 無料サンプルを入手 - シャープスコンテナマーケット