
シングルペアイーサネット市場の規模、シェア、および2031年までの成長予測
シングルペアイーサネット市場の規模と予測(2021~2031年)、世界および地域別のシェア、トレンド、成長機会分析 - タイプ別(インフラストラクチャおよびデバイスコンポーネント、ソフトウェアおよびサービス)、インフラストラクチャおよびデバイスコンポーネント(ケーブル、コネクタ、その他)、ケーブルタイプ別(10Base-T1、100Base-T1、1000Base-T1)、アプリケーション別(ロボット工学および自動化、自動車および輸送、エネルギー、機械、その他)、および地域別(北米、ヨーロッパ、アジア太平洋、中東およびアフリカ、南米)
- ステータス : 出版
- レポートコード : TIPRE00026367
- カテゴリー : エレクトロニクスおよび半導体
- ページ数 : 252
- 利用可能なレポート形式 :


- 最終更新日 : November 28, 2025

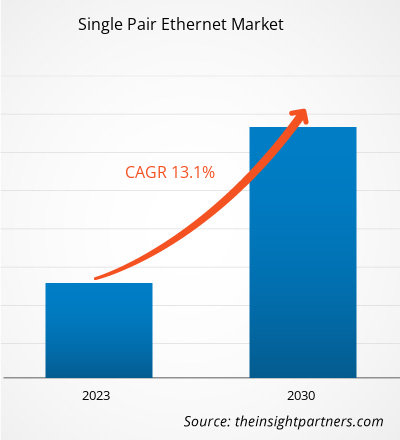
シングルペアイーサネット市場規模は、2024年に28億8,000万米ドルに達すると予測されており、2031年までに72億米ドルに達すると予想されています。シングルペアイーサネット市場は、2025年から2031年の間に14.26%のCAGRを記録すると予測されています。
シングルペアイーサネット市場分析
より高速な通信と、ダウンタイムの少ない自己診断レポートへの需要が、世界各地でSPEの需要を生み出しています。さらに、より高速な通信と、ダウンタイムの少ない自己診断レポートへの需要は、世界各地でSPEの需要を生み出すもう一つの要因であり、市場の成長を支えています。
シングルペアイーサネット市場の概要
SPEは、産業用IoT(IIoT)ベースのアプリケーションとインダストリー4.0のバックボーンとして考えられています。現代の機械、設備、システムは複雑なタスクを実行するため、メーカーはデバイス、機械、設備、システム間で安定した情報の流れを確保するために、信頼性が高く強力なデータネットワークシステムを導入することが求められています。
このレポートの一部、国レベルの分析、Excelデータパックなど、あらゆるレポートを無料でカスタマイズできます。また、スタートアップや大学向けのお得なオファーや割引もご利用いただけます。
シングルペアイーサネット市場:戦略的洞察

-
このレポートの主要な市場動向を入手してください。この無料サンプルには、市場動向から見積もりや予測に至るまでのデータ分析が含まれます。
シングルペアイーサネット市場の推進要因と機会
市場の推進要因:
- 産業オートメーションの採用拡大 SPE は多数のセンサーやエッジ デバイスを接続できるため、ネットワーク アーキテクチャがシンプルになり、生産環境での迅速かつ安価な実装が容易になります。
- ケーブルの小型化と軽量化の要件 SPEテクノロジーは、ケーブルのサイズと重量を大幅に削減することを可能にし、ケーブルのサイズと重量を100分の1程度削減します。ケーブルのサイズと重量の削減は、コンパクトな設計と重量の最適化が主要な要素となる自動車産業、ロボット工学、ビルディングオートメーション分野にとって非常に重要であり、スペースが限られた現代のアプリケーションにおいてSPEは最適なソリューションとなっています。
- Power over Data Lines(PoDL)のサポート。電力とデータ伝送を1組のケーブルに統合することで、必要な配線数が最小限に抑えられ、システムのセットアッププロセスが簡素化されるほか、アクセスが困難な遠隔地にもデバイスを配備することが可能になります。このスマートなデュアルユース技術は、スマートビルディングやインダストリアルIoT(IIoT)アプリケーションなどで大きなメリットとなります。
市場機会:
- スマート ビルディングとビルディング オートメーション システムの拡張 ビル管理、照明、セキュリティ、HVAC システムの統合ソリューションの使用が増えるにつれ、単一のネットワーク インフラストラクチャを通じてデバイスの接続と管理を容易にするテクノロジである SPE に多くのチャンスが生まれます。
- 自動車業界の変革 車載エレクトロニクスの増加と先進運転支援システム (ADAS) の登場が、軽量で高帯域幅の車載ネットワークに SPE を採用する主な理由です。
- IIoT とスマート ファクトリー イニシアチブの成長 インダストリー 4.0 と IIoT の導入により、SPE が分散したセンサー、アクチュエーター、ロボットを接続するための主要チャネルとなり、製造、プロセス産業、物流の分野で新たな市場を開拓するチャンスが生まれます。
シングルペアイーサネット市場レポートのセグメンテーション分析
シングルペアイーサネット市場は、その仕組み、成長の可能性、そして最新のトレンドをより明確に把握するために、様々なセグメントに分割されています。以下は、業界レポートで用いられる標準的なセグメント分けの手法です。
タイプ別:
- インフラストラクチャおよびデバイス コンポーネント: インフラストラクチャおよびデバイス コンポーネント セグメントは、単一のツイスト ペア ケーブルを介した SPE の高速かつ低遅延のデータ伝送を可能にするために不可欠なコネクタ、ケーブル、スイッチ、コントローラ、および物理層 (PHY) デバイスで構成されます。
- ソフトウェアおよびサービス:ソフトウェアおよびサービス部門には、ネットワーク管理、プロトコルスタックソリューション、構成ツール、保守サービスが含まれます。これらは、産業、自動車、スマート製造環境におけるSPEネットワークのシームレスな統合、リアルタイム診断、サイバーセキュリティ、リモート監視を可能にします。
用途別:
- ロボット工学と自動化:ロボットのハンドリングと動作はますます高度化しています。多軸動作には、追加のモーターとアクチュエータの使用が必要です。SPEは、ケーブルサイズを縮小し、帯域幅を拡大することで、コントローラ、モーター、アクチュエータ、センサー間の通信を可能にします。
- 自動車・輸送
- エネルギー
- 機械
- その他
インフラストラクチャおよびデバイス コンポーネント別:
- ケーブル
- コネクタ
- その他
ケーブルタイプ別:
- 10Base-T1
- 100Base-T1
- 1000Base-T1
地理別:
- 北米
- ヨーロッパ
- アジア太平洋
- 南アメリカ
- 中東・アフリカ
シングルペアイーサネット市場の地域別分析
予測期間全体を通してシングルペアイーサネット市場に影響を与える地域的なトレンドと要因については、The Insight Partnersのアナリストが詳細に解説しています。このセクションでは、北米、ヨーロッパ、アジア太平洋、中東・アフリカ、中南米におけるシングルペアイーサネット市場のセグメントと地域についても解説します。
シングルペアイーサネット市場レポートの範囲
| レポート属性 | 詳細 |
|---|---|
| 2024年の市場規模 | 28億8000万米ドル |
| 2031年までの市場規模 | 72億ドル |
| 世界のCAGR(2025年~2031年) | 14.3% |
| 履歴データ | 2021-2023 |
| 予測期間 | 2025~2031年 |
| 対象セグメント |
タイプ別
|
| 対象地域と国 |
北米
|
| 市場リーダーと主要企業の概要 |
|
シングルペアイーサネット市場のプレーヤー密度:ビジネスダイナミクスへの影響を理解する
シングルペアイーサネット市場は、消費者の嗜好の変化、技術の進歩、製品メリットへの認知度の向上といった要因によるエンドユーザー需要の増加に牽引され、急速に成長しています。需要の増加に伴い、企業は製品ラインナップの拡充、消費者ニーズへの対応、新たなトレンドの活用を進めており、これが市場の成長をさらに加速させています。
- シングルペアイーサネット市場のトップキープレーヤーの概要を入手
シングルペアイーサネット市場シェアの地域別分析
北米は世界第2位の自動車市場を擁しており、世界有数の自動車市場を有しています。ゼネラルモーターズ、フォード、シボレー、フォルクスワーゲン、テスラ、ダッジ、トヨタ、ホンダ、ヒュンダイ、ルノーといった企業が北米に多くの製造拠点を置いています。さらに、米国とカナダの政府は2035年までにガソリン車を段階的に廃止する計画を発表しており、電気自動車(EV)の生産が促進されています。こうした取り組みが、北米におけるシングルペアイーサネット市場の成長を牽引しています。
以下は地域別の市場シェアと傾向の概要です。
1. 北米
- 市場シェア: 高度な産業オートメーション、広範な製造インフラストラクチャ、高いロボット密度、およびインダストリー 4.0 プラクティスの積極的な導入により、特に米国で最大の市場となっています。
-
主な推進要因:
- IIoTとスマート製造ソリューションに対する需要の急増
- 電気自動車(EV)への移行が進む自動車産業の好調
- トレンド: 工場車両の近代化、スマートグリッドおよびスマートシティの導入の増加、主要な業界連合からの強力な戦略的コミットメント。
2. ヨーロッパ
- 市場シェア: ロボット密度の高さ、産業基盤の多様化、積極的なエネルギー移行政策の実施により、EMEA 地域内で最大のシェアを維持しています。
-
主な推進要因:
- EVとADASへの採用
- 再生可能エネルギー(風力と太陽光)の急速な統合
- トレンド: 車両の近代化、自律走行車のサポート、クリーン エネルギーの導入の加速、高密度工場での SPE の広範な利用。
3. アジア太平洋
- 市場シェア: 広範な工業化、デジタル インフラストラクチャへの投資、自動車製造の成長によって拡大する市場。
-
主な推進要因:
- スマートシティと産業IoTの迅速な展開
- 自動化、ロボット工学、ハイテク産業分野の促進に向けた政府の取り組み
- トレンド: 都市部と農村部の両方でデジタル化を推進し、スマート製造に積極的に投資しています。
4. 中東およびアフリカ
- 市場シェア: 湾岸、南アフリカ、北アフリカ地域における自動化およびスマート シティ プロジェクトへの投資の影響を主に受け、成長軌道にある新興市場セグメント。
- 主な推進要因:
-
- インフラ(建設、エネルギー、公共事業)の大規模な拡張
- デジタル変革とスマートシティへの政府投資の増加
- トレンド: 産業および都市ネットワークの継続的な強化、コスト効率の高い接続が主な関心事であり、近代化パートナーシップ。
5. 南アメリカ
·
市場占有率:
ブラジル、アルゼンチン、チリにおける製造、輸送、エネルギー部門の近代化に大きく支えられ、成長を続ける市場です。
·
主な推進要因:
-
- 急速に拡大する自動車、エネルギー、鉱業の事業分野
- インフラ開発の取り組みとスマートグリッドの展開
- 産業のコネクティビティを近代化するための官民連携
·
トレンド:
新しい製造拠点の統合、輸送自動化の拡張、エネルギー プロジェクトと監視のための SPE の活用。
シングルペアイーサネット市場のプレーヤー密度:ビジネスダイナミクスへの影響を理解する
中規模市場の密度と競争
Analog Devices Inc、Belden Inc、HARTING Applied Technologies GmbH、Weidmuller Interface GmbH & Co KG、Würth Elektronik GmbH & Co KGといった既存企業の存在により、競争は熾烈です。また、地域企業やニッチな企業も、様々な地域で競争を激化させています。
この高いレベルの競争により、企業は次のようなものを提供して差別化を図ろうとしています。
- 高度なネットワークセキュリティとデータ整合性機能
- 付加価値接続および統合サービス
- 柔軟で費用対効果の高い価格モデル
- 包括的な顧客サポートとソリューションのカスタマイズ
機会と戦略的動き
- SPE ソリューション サプライヤーは、エコシステムとの互換性を高め、工場、ビル、輸送ネットワークへの実装を加速するために、オートメーション ベンダー、産業機器メーカー、IoT プラットフォーム企業との関係を拡大しています。
- 主要ベンダーは、ケーブル、コネクタ、デバイス インターフェイスを簡単に拡張できる、モジュール式で柔軟な SPE ソリューションを提示しており、これを使用することで、さまざまなアプリケーション要件を満たすことができます。
免責事項:上記の企業は、特定の順序でランク付けされているわけではありません。
調査の過程で分析した他の企業:
- ベルデン
- オムニトロンシステムズ
- 灸
- フェニックスコンタクト
- ボットブロックス
- ヘルカベルUSA
シングルペアイーサネット市場のニュースと最近の動向
- Belden Inc.は、Lumberg Automationとの共同開発によるBEETLEシングルペアイーサネット(SPE)Liteマネージドスイッチの発売を発表しました。この新しいBEETLEスイッチは、より細く軽量なSPEケーブルを導入することで、1対のケーブルで接続できるため、組織はネットワークの複雑さを軽減できます。
- LAPPは革新的なシングルペアイーサネット(SPE)ポートフォリオを発表しました。LAPPは、産業オートメーションにおける大きな進歩を象徴する革新的なSPEポートフォリオを発表しました。この幅広い製品群は、業界における新たな技術とソリューションの開拓に対するLAPPのコミットメントを体現しています。
シングルペアイーサネット市場レポートの対象範囲と成果物
「シングルペアイーサネット市場の規模と予測(2021〜2031年)」レポートでは、以下の分野を網羅した市場の詳細な分析を提供しています。
- シングルペアイーサネット市場の規模と予測(対象範囲に含まれるすべての主要市場セグメントの世界、地域、国レベル)
- シングルペアイーサネット市場の動向、および推進要因、制約、主要な機会などの市場動向
- 詳細なPEST分析とSWOT分析
- 主要な市場動向、世界および地域の枠組み、主要プレーヤー、規制、最近の市場動向を網羅したシングルペアイーサネット市場分析
- 市場集中、ヒートマップ分析、主要プレーヤー、シングルペアイーサネット市場の最近の動向を網羅した業界の展望と競争分析
- 詳細な企業プロフィール

Naveenは、カスタム、シンジケート、コンサルティングの各プロジェクトにおいて9年以上の実績を持つ、経験豊富な市場調査およびコンサルティングのプロフェッショナルです。現在はアソシエイトバイスプレジデントを務め、プロジェクトバリューチェーン全体にわたるステークホルダー管理を成功させ、100件以上の調査レポートと30件以上のコンサルティング案件を執筆しています。産業および政府機関のプロジェクトに幅広く携わり、クライアントの成功とデータに基づく意思決定に大きく貢献しています。
Naveenは、カルナータカ州VTUで電子通信工学の学位を取得し、マニパル大学でマーケティング&オペレーションズのMBAを取得しています。IEEEの会員として9年間活動し、会議や技術シンポジウムへの参加、セクションレベルおよび地域レベルでのボランティア活動に積極的に取り組んでいます。現職以前は、IndustryARCでアソシエイト戦略コンサルタント、Hewlett Packard(HP Global)で産業用サーバーコンサルタントを務めていました。
- 包括的な市場規模および予測分析
- 詳細なセグメンテーション分析
- 市場動向(ダイナミクス)の徹底的な評価
- 地域および国別のインサイト
- 競争環境および企業ベンチマーク
- 戦略的ビジネスインテリジェンス
お客様の声
Insight PartnersのSCADAシステム市場レポートは包括的で、現在のトレンドと将来の予測に関する貴重な洞察が含まれています。チームは終始、非常にプロフェッショナルで、対応が早く、サポートも充実していました。私たちは彼らのサービスに非常に満足しており、強くお勧めします。
ラン・ケデム パートナー, レアリテクノロジーズ株式会社非常に特殊なソフトウェア市場に関するレポートを依頼したところ、チームは数日でレポートを作成してくれました。情報は非常に関連性が高く、分かりやすくまとめられていました。その後、レポートにいくつか修正と追加を依頼しましたが、チームは非常に迅速に対応し、1週間も経たないうちに最終レポートを受け取ることができました。
ジャン=エルヴェ・ジェン 会長, フューチャー・アナリティカ重要な市場調査と予測のために、The Insight Partnersと協力しました。彼らは機会とリスクに関する明確な洞察を提供し、私たちの計画策定に役立ちました。彼らの調査は使いやすく、確かなデータに基づいており、賢明で自信に満ちた意思決定に役立ちました。彼らを強くお勧めします。
ピユーシュ・ナグパル 上級副社長, ハイビームグローバルInsight Partnersは、深い専門知識に基づき、洞察力に富み、構造化された市場調査を提供しました。チームは終始プロフェッショナルで、対応力も抜群でした。ユーザーフレンドリーなウェブサイトにより、業界レポートへのアクセスもスムーズでした。信頼性の高い高品質な調査サービスをお探しなら、Insight Partnersを強くお勧めします。
安達幸彦 最高経営責任者(CEO), ディープブルーLLC。The Insight Partnersから市場レポートを購入するのは今回が初めてです。最初は不安でしたが、ウェブサイトを見て、リスクを負ってでも購入してみようという気持ちになりました。レポートの品質とカスタマーサービスには大変満足しています。最初のレポートにはいくつか質問やコメントがありましたが、アナリストとメールで何度かやり取りした結果、戦略策定プロセスへのインプットとして活用できるレポートが完成しました。貴重なお時間を割いていただき、貴重な体験をさせていただき、誠にありがとうございました。他の方にもぜひお勧めしたいですし、今後さらに市場データが必要になった際には、まずThe Insight Partnersにご連絡させていただきます。
ジョン・スズキ 社長兼最高経営責任者、取締役, BKテクノロジーズナイジェリアの感染症IVD市場に関する情報提供依頼に対し、ご対応いただいた際、ご尽力とプロフェッショナルな姿勢に深く感謝申し上げます。忍耐強く、的確なアドバイスをいただき、また、最終的に取引成立に至った割引のご提供にも深く感謝申し上げます。今回の最初の出会いで得た強い印象のおかげで、今後もThe Insight Partnersとの連携を心待ちにしております。
チジオケ博士 オニア マネージングディレクター, パインクレストヘルスケア株式会社購入理由
- 情報に基づいた意思決定
- 市場動向の理解
- 競合分析
- 顧客インサイト
- 市場予測
- リスク軽減
- 戦略計画
- 投資の正当性
- 新興市場の特定
- マーケティング戦略の強化
- 業務効率の向上
- 規制動向への対応


