
スマート動物捕獲器市場の成長、イノベーション、予測2034
スマート動物捕獲器市場の規模と予測(2021年 - 2034年)、世界および地域別のシェア、トレンド、成長機会分析レポートの対象範囲:ハードウェア(センサー、カメラ、その他)、アプリケーション(住宅用および商業用)、コンポーネント(ハードウェア、ソフトウェア、サービス)別
- ステータス : 公開されたデータ
- レポートコード : TIPRE00029508
- カテゴリー : エレクトロニクスおよび半導体
- ページ数 : 150
- 利用可能なレポート形式 :


- 最終更新日 : January 22, 2026

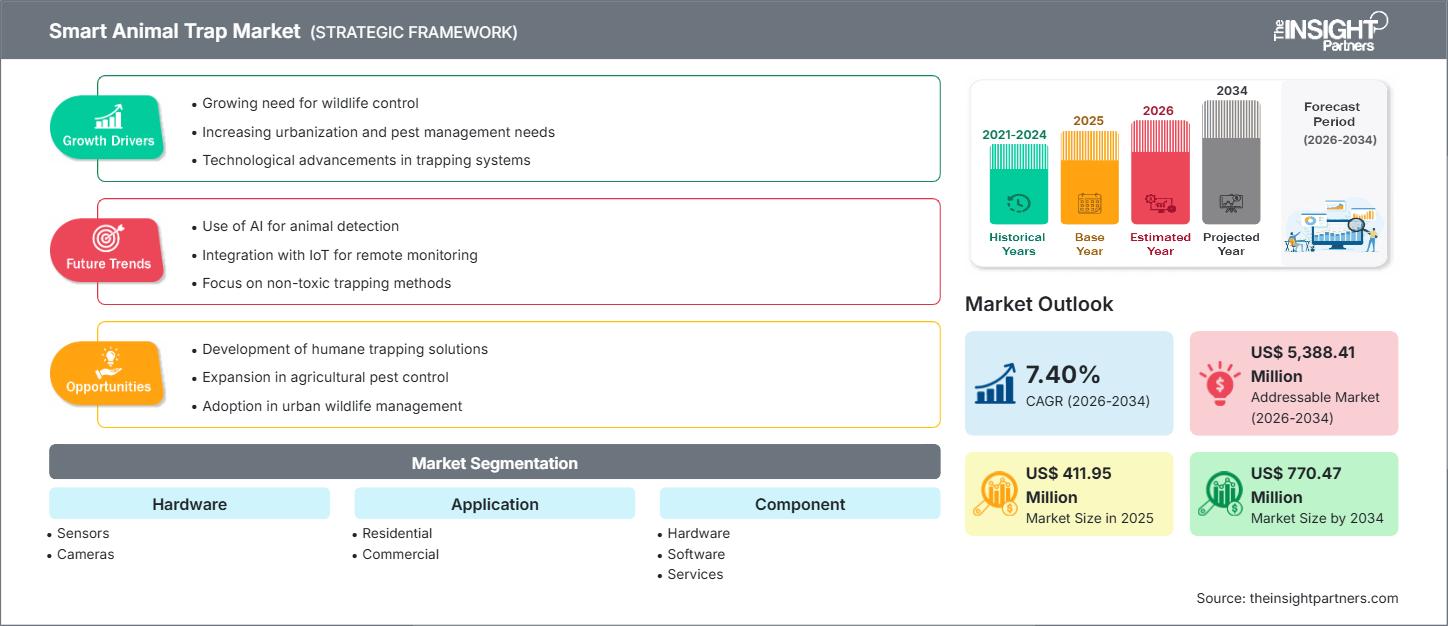
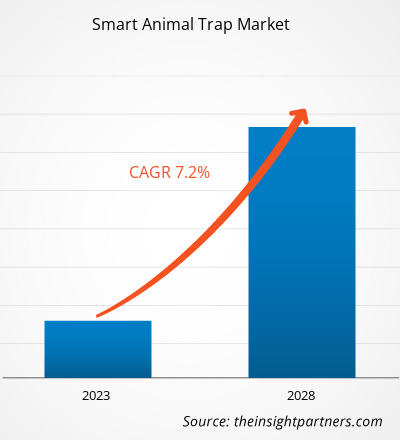
スマート動物捕獲器の市場規模は、2025年の4億1,195万米ドルから2034年には7億7,047万米ドルに達すると予想されています。市場は2026年から2034年の間に7.40%のCAGRを記録すると予想されています。
スマート動物捕獲器市場分析
スマート動物トラップ市場は成長を続けており、野生動物や害虫の駆除において、人道的で効率的、かつネットワーク化された方法へのニーズが高まっています。主な技術実現要因としては、IoTセンサー、無線通信(セルラー、LoRa)、カメラ、そして動物を検知・捕獲できる自動化メカニズムなどが挙げられます。スマートトラップは、遠隔監視、行動データの取得、研究のための非致死的捕獲を可能にします。農家は、フェンスや化学薬品の使用が困難な場合に、イノシシやシカなどの野生動物による農作物の被害を防ぐためにスマートトラップを活用しています。また、リアルタイムアラートによって毒物の使用を最小限に抑えられるという利点があり、都市部におけるげっ歯類の駆除にも活用されています。テクノロジー、センサー、クラウド、AI、衛星/LPWAN接続の融合により、これらのトラップは人口密度の高い都市から遠隔地の農村部まで、あらゆる場所で運用可能になりつつあります。
スマート動物捕獲器市場の概要
スマート動物捕獲器市場は、野生動物管理エコシステム全体における発展途上のサブセクションであり、野生動物の人道的かつ効率的な捕獲とモニタリングに取り組んでいます。スマートトラップは、様々なセンサー、カメラ、モバイル接続技術を組み合わせ、動物の動きや行動に関する関連データをほぼリアルタイムで収集・提供します。都市部の拡大と野生動物管理の必要性が続く中、スマートトラップ市場は成長期を迎えています。この成長は、動物福祉への意識の高まりと、環境に配慮した代替手段への関心の高まりによってさらに促進されています。
要件に合わせてレポートをカスタマイズ
このレポートの一部、国レベルの分析、Excelデータパックなど、あらゆるレポートを無料でカスタマイズできます。また、スタートアップや大学向けのお得なオファーや割引もご利用いただけます。
スマート動物捕獲器市場:戦略的洞察
-
このレポートの主要な市場動向を入手してください。この無料サンプルには、市場動向から見積もりや予測に至るまでのデータ分析が含まれます。
スマート動物捕獲器市場の推進要因と機会
市場の推進要因:
- 人間と野生動物の衝突の増加: 都市化が進むにつれて、人間と野生動物 (または害獣) との接触がより頻繁になり、スマートで非致死的な解決策に対する需要が高まっています。
- 技術の進歩: IoT、低電力センサー、接続性の向上 (セルラー、LPWAN) の統合により、スマート トラップの信頼性とコスト効率が向上します。
- 動物福祉と規制: 非人道的な捕獲と野生動物保護に関する規制の強化により、人道的なスマートトラップの導入が促進されています。
- 研究および保全のための資金: 野生生物の監視と保全に対する政府および NGO の資金の増加により、スマートトラッピング システムの導入が促進されます。
市場機会:
- プラットフォームベースの管理ソリューション: 企業は、ユーザーがトラップ データを監視および分析するためのトラップ管理プラットフォーム (アプリ + ダッシュボード) を提供できます。
- 予測分析: 動物の移動、繁殖サイクル、紛争のホットスポットを予測するためのデータの使用。
- 新興市場への拡大:人間と動物の衝突が拡大している地域(アジア太平洋、ラテンアメリカなど)には大きなチャンスがあります。
- 農業向けカスタムソリューション: 作物に被害を与える特定の種 (イノシシ、シカ、サル) に合わせたトラップを開発できます。
スマート動物トラップ市場レポートのセグメンテーション分析
スマート動物捕獲器の市場シェアは、様々なセグメントにわたって分析され、その構造、成長の可能性、そして新たなトレンドをより明確に理解することができます。以下は、ほとんどの業界レポートで使用されている標準的なセグメンテーション手法です。
ハードウェア別:
- センサー
- カメラ
用途別:
- 居住の
- コマーシャル
コンポーネント別:
- ハードウェア
- ソフトウェア
- サービス
地理別:
- 北米
- ヨーロッパ
- アジア太平洋
- ラテンアメリカ
- 中東・アフリカ
スマート動物トラップ市場の地域別分析
予測期間全体を通してスマート動物捕獲器市場に影響を与える地域的な傾向と要因は、The Insight Partnersのアナリストによって徹底的に説明されています。このセクションでは、北米、ヨーロッパ、アジア太平洋、中東・アフリカ、中南米におけるスマート動物捕獲器市場のセグメントと地域についても説明します。
スマート動物捕獲器市場レポートの範囲
| レポート属性 | 詳細 |
|---|---|
| 2025年の市場規模 | 4億1,195万米ドル |
| 2034年までの市場規模 | 7億7,047万米ドル |
| 世界のCAGR(2026年~2034年) | 7.40% |
| 履歴データ | 2021-2024 |
| 予測期間 | 2026~2034年 |
| 対象セグメント |
ハードウェア別
|
| 対象地域と国 |
北米
|
| 市場リーダーと主要企業の概要 |
|
スマート動物トラップ市場のプレーヤー密度:ビジネスダイナミクスへの影響を理解する
スマート動物捕獲器市場は、消費者の嗜好の変化、技術の進歩、製品の利点に対する認知度の高まりといった要因によるエンドユーザーの需要増加に牽引され、急速に成長しています。需要の増加に伴い、企業は製品ラインナップの拡充、消費者ニーズへの対応のための革新、そして新たなトレンドの活用を進めており、これが市場の成長をさらに加速させています。
- スマート動物トラップ市場のトップキープレーヤーの概要を入手
スマート動物捕獲器市場シェアの地域別分析
スマート動物捕獲器市場は北米が圧倒的なシェアを占めています。この地域の優位性は、資金が潤沢な野生生物保護プログラム、害虫駆除におけるIoTとスマートテクノロジーの普及率の高さ、そして人道的な捕獲方法を奨励する強力な規制枠組みの組み合わせによるものです。アジア太平洋、ラテンアメリカ、中東、アフリカの新興市場は、スマート動物捕獲器プロバイダーにとって未開拓の成長機会を提供しています。
スマート動物捕獲器市場は、人間と野生動物の衝突の激しさ、農業への依存度、技術導入、保全資金といった要因により、地域ごとに異なる成長軌道を示しています。以下は、地域別の市場シェアとトレンドの概要です。
1. 北米
- 市場シェア: コネクテッド野生生物および害虫管理ソリューションの導入をリードする米国とカナダが牽引し、世界最大の市場シェアを占めています。
-
主な推進要因:
- IoT 対応およびセンサーベースのスマートトラップの採用率が高い。
- 野生生物の保護と研究プロジェクトに対する政府と民間からの資金提供。
- 人道的な動物の捕獲と福祉の遵守を重視する厳格な規制。
-
トレンド:
- スマートトラップをモバイル アプリやクラウドベースのダッシュボードと統合し、リアルタイム監視を実現します。
2. ヨーロッパ
- 市場シェア: 強力な野生生物保護政策と研究の取り組みにより、ドイツ、フランス、英国などの国で着実に成長し、大きな市場シェアを獲得しています。
-
主な推進要因:
- 厳格な動物福祉規制により、人道的かつ監視された罠が奨励されています。
- 保全と害虫駆除における官民パートナーシップ。
- 野生生物管理を統合したスマート農業技術の導入。
-
トレンド:
- 農業と都市の害虫駆除の両方にカメラ対応およびセンサーベースのトラップを導入します。
3. アジア太平洋地域
- 市場シェア: 都市部および農村部における人間と野生動物の衝突の増加、農業損失、中国、インド、東南アジアでのスマート農業の導入により、最も急速に成長している地域市場です。
-
主な推進要因:
- 政府が支援するデジタル農業および野生生物監視プログラム。
- 人道的な捕獲と害虫駆除に対する意識の高まり。
- 地方での遠隔監視を可能にする接続型 IoT インフラストラクチャの拡張。
-
トレンド:
- 大規模農場や森林地帯でのスマートトラップの使用により、農作物の被害を軽減します。
4. ラテンアメリカ
- 市場シェア: 農業ニーズや都市の野生生物の管理により、ブラジル、アルゼンチン、メキシコなどの国で需要が拡大している新興市場。
-
主な推進要因:
- スマートトラッピングシステムを含むアグリテックソリューションの拡張。
- 人道的な野生動物管理の実践に対する意識が高まっています。
- 家畜および農作物の保護のためのデジタルおよび IoT 対応監視システムへの投資。
-
トレンド:
- 大規模農業における連結トラップの使用。
5. 中東およびアフリカ
- 市場シェア: 特に UAE、サウジアラビア、南アフリカ、ケニアなどの国では、高い潜在能力を持つ新興地域。
-
主な推進要因:
- 野生生物の保護と都市害虫駆除を推進するための政府の取り組み。
- 保護区および農場におけるスマートトラップの導入の増加。
- リモート監視のための接続テクノロジーへの関心が高まっています。
-
トレンド:
- スマート トラップは、モバイル ネットワークと低電力広域ネットワーク (LPWAN) テクノロジと統合されています。
スマート動物トラップ市場のプレーヤー密度と競争環境
スマート動物捕獲器市場は、世界的な大手テクノロジープロバイダーに加え、新興のニッチプレーヤーや専門分野のスタートアップ企業も参入し、熾烈な競争に直面しています。各企業は、市場での地位を強化し、業界全体におけるインテリジェントな意思決定プラットフォームへの高まる需要に応えるため、積極的にイノベーションに取り組んでいます。
競争環境により、ベンダーは次のような差別化を図っています。
- ハードウェアの革新(センサー、カメラ)
- ソフトウェア プラットフォーム (リアルタイム アラート、ダッシュボード)
- サービス(データ分析、トラップのメンテナンス)
- 保全機関、農業、研究機関とのパートナーシップ
機会と戦略的動き
- 保全/政府機関とのパートナーシップ: スマートトラップ企業は、野生生物の研究者、NGO、政府機関と提携して、保全と人間と野生生物の衝突管理のために大規模に展開することができます。
- サービスとしての分析: 動物の移動パターン、密度の推定、予測ホットスポットに関するサブスクリプションベースの分析を提供します。
- 農業向けのカスタマイズ: 地域の農作物被害プロファイルに合わせて調整された、種固有のトラップ システム (イノシシ、サル、シカなど) を開発します。
スマート動物捕獲器市場で事業を展開する主要企業
- トラップマスター
- AlertHouse ApS(ミンク警察)
- レビューマネージャー
- ワイルドメルダー
- スカイホーク
- キャッチアライブApS
- エンカウンターソリューションズ株式会社
- エコノード株式会社
- ワイルドライフ・ドミニオン・マネジメントLLC(HogEye)
免責事項:上記の企業は、特定の順序でランク付けされているわけではありません。
スマート動物捕獲器市場のニュースと最近の動向
- 例えば、2025年8月7日、Skyhawk Trapmateは、フェロモン技術と昆虫行動研究のパイオニアであるInsects Limited Inc.との戦略的提携を発表しました。両社は協力して、デジタル昆虫モニタリングの新たな基準を確立する新たな共同製品の導入に取り組んでいます。この提携は、現場で実証された害虫モニタリング技術と数十年にわたる昆虫学の専門知識を強力に融合させたものです。その結果、害虫管理の専門家に、昆虫防除プログラムにおいて比類のない洞察、精度、効率性を提供する強力なソリューションが誕生しました。
スマート動物捕獲器市場レポートの対象範囲と成果物
「スマート動物トラップ市場の規模と予測」レポートには通常、次の内容が含まれます。
「スマート動物トラップ市場の規模と予測(2021〜2034年)」レポートでは、以下の分野をカバーする市場の詳細な分析を提供しています。
- スマート動物トラップ市場規模と予測(スコープに含まれるすべての主要市場セグメントの世界、地域、国レベル)
- スマート動物トラップ市場の動向、および推進要因、制約、主要な機会などの市場動向
- 詳細なPEST分析とSWOT分析
- スマート動物トラップ市場分析では、主要な市場動向、世界および地域の枠組み、主要プレーヤー、規制、最近の市場動向を網羅しています。
- スマート動物捕獲器市場における市場集中度、ヒートマップ分析、主要プレーヤー、最近の動向を網羅した業界展望と競争分析。詳細な企業プロファイル

Naveenは、カスタム、シンジケート、コンサルティングの各プロジェクトにおいて9年以上の実績を持つ、経験豊富な市場調査およびコンサルティングのプロフェッショナルです。現在はアソシエイトバイスプレジデントを務め、プロジェクトバリューチェーン全体にわたるステークホルダー管理を成功させ、100件以上の調査レポートと30件以上のコンサルティング案件を執筆しています。産業および政府機関のプロジェクトに幅広く携わり、クライアントの成功とデータに基づく意思決定に大きく貢献しています。
Naveenは、カルナータカ州VTUで電子通信工学の学位を取得し、マニパル大学でマーケティング&オペレーションズのMBAを取得しています。IEEEの会員として9年間活動し、会議や技術シンポジウムへの参加、セクションレベルおよび地域レベルでのボランティア活動に積極的に取り組んでいます。現職以前は、IndustryARCでアソシエイト戦略コンサルタント、Hewlett Packard(HP Global)で産業用サーバーコンサルタントを務めていました。
- 包括的な市場規模および予測分析
- 詳細なセグメンテーション分析
- 市場動向(ダイナミクス)の徹底的な評価
- 地域および国別のインサイト
- 競争環境および企業ベンチマーク
- 戦略的ビジネスインテリジェンス
お客様の声
Insight PartnersのSCADAシステム市場レポートは包括的で、現在のトレンドと将来の予測に関する貴重な洞察が含まれています。チームは終始、非常にプロフェッショナルで、対応が早く、サポートも充実していました。私たちは彼らのサービスに非常に満足しており、強くお勧めします。
ラン・ケデム パートナー, レアリテクノロジーズ株式会社非常に特殊なソフトウェア市場に関するレポートを依頼したところ、チームは数日でレポートを作成してくれました。情報は非常に関連性が高く、分かりやすくまとめられていました。その後、レポートにいくつか修正と追加を依頼しましたが、チームは非常に迅速に対応し、1週間も経たないうちに最終レポートを受け取ることができました。
ジャン=エルヴェ・ジェン 会長, フューチャー・アナリティカ重要な市場調査と予測のために、The Insight Partnersと協力しました。彼らは機会とリスクに関する明確な洞察を提供し、私たちの計画策定に役立ちました。彼らの調査は使いやすく、確かなデータに基づいており、賢明で自信に満ちた意思決定に役立ちました。彼らを強くお勧めします。
ピユーシュ・ナグパル 上級副社長, ハイビームグローバルInsight Partnersは、深い専門知識に基づき、洞察力に富み、構造化された市場調査を提供しました。チームは終始プロフェッショナルで、対応力も抜群でした。ユーザーフレンドリーなウェブサイトにより、業界レポートへのアクセスもスムーズでした。信頼性の高い高品質な調査サービスをお探しなら、Insight Partnersを強くお勧めします。
安達幸彦 最高経営責任者(CEO), ディープブルーLLC。The Insight Partnersから市場レポートを購入するのは今回が初めてです。最初は不安でしたが、ウェブサイトを見て、リスクを負ってでも購入してみようという気持ちになりました。レポートの品質とカスタマーサービスには大変満足しています。最初のレポートにはいくつか質問やコメントがありましたが、アナリストとメールで何度かやり取りした結果、戦略策定プロセスへのインプットとして活用できるレポートが完成しました。貴重なお時間を割いていただき、貴重な体験をさせていただき、誠にありがとうございました。他の方にもぜひお勧めしたいですし、今後さらに市場データが必要になった際には、まずThe Insight Partnersにご連絡させていただきます。
ジョン・スズキ 社長兼最高経営責任者、取締役, BKテクノロジーズナイジェリアの感染症IVD市場に関する情報提供依頼に対し、ご対応いただいた際、ご尽力とプロフェッショナルな姿勢に深く感謝申し上げます。忍耐強く、的確なアドバイスをいただき、また、最終的に取引成立に至った割引のご提供にも深く感謝申し上げます。今回の最初の出会いで得た強い印象のおかげで、今後もThe Insight Partnersとの連携を心待ちにしております。
チジオケ博士 オニア マネージングディレクター, パインクレストヘルスケア株式会社購入理由
- 情報に基づいた意思決定
- 市場動向の理解
- 競合分析
- 顧客インサイト
- 市場予測
- リスク軽減
- 戦略計画
- 投資の正当性
- 新興市場の特定
- マーケティング戦略の強化
- 業務効率の向上
- 規制動向への対応


