
スマート水道メーター市場の規模、シェア、需要予測(2034年まで)
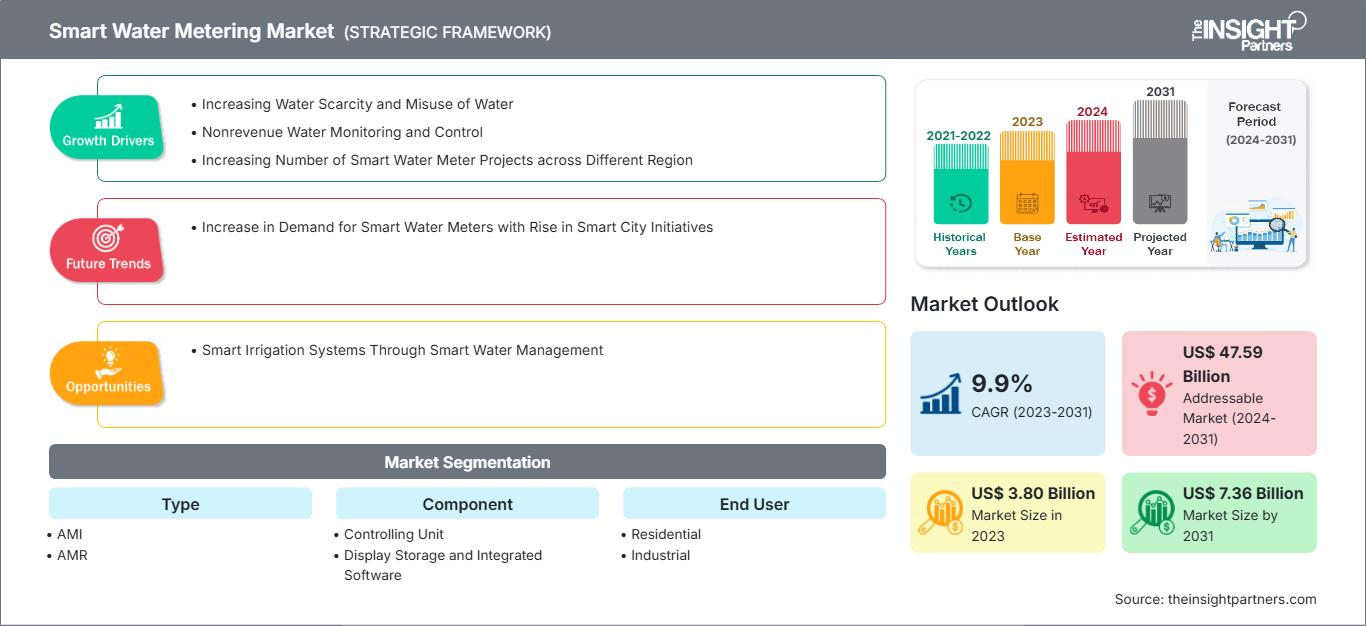
スマート水道メーター市場規模と予測(2021年~2034年)、世界および地域別シェア、トレンド、成長機会分析レポート 対象範囲:タイプ別(AMIおよびAMR)、用途別(住宅用、商業用、産業用)、地域別(北米、欧州、アジア太平洋、中東およびアフリカ、南米および中米)
- ステータス : 出版
- レポートコード : TIPTE100000347
- カテゴリー : エレクトロニクスおよび半導体
- ページ数 : 216
- 利用可能なレポート形式 :


- 最終更新日 : April 08, 2026

スマート水道メーター市場規模は、2025年の62億米ドルから2034年には158億4000万米ドルに達すると予測されています。また、2026年から2034年にかけて、年平均成長率(CAGR)は11.5%になると見込まれています。
スマート水道メーター市場分析
スマート水道メーター市場は、都市化、水不足、スマートシティ構想などを背景に拡大を続けています。高度計測インフラ(AMI)は、漏水検知、リアルタイム監視、データ分析を可能にし、水道事業者の業務効率向上に貢献します。この市場の主要企業には、Sensus、Itron、Honeywellなどが挙げられます。
スマート水道メーター市場の概要
スマート水道メーターは、IoT、LPWAN、クラウド技術を活用して、遠隔計測、消費量分析、予知保全を実現します。規制要件や持続可能な開発戦略の結果として、住宅、商業、産業分野での導入が拡大しています。業界のトレンドとしては、Badger MeterやKamstrupといった企業による連携やプラットフォーム戦略などが挙げられます。
お客様のご要望に合わせてこのレポートをカスタマイズしてください
無料カスタマイズスマート水道メーター市場:戦略的洞察
-
本レポートの主要市場トレンドをご覧ください。この無料サンプルには、市場動向から予測、見通しまで、幅広いデータ分析が含まれています。
スマート水道メーター市場の推進要因と機会
市場の推進要因:
- 都市化とインフラの近代化:急速な都市化は、水道事業者に配水効率の最適化を迫っています。スマートメーターは、自動検針、漏水検知、消費量分析を可能にし、都市が老朽化したインフラを最適化し、運営コストを削減するのに役立ちます。
- 水不足の深刻化と節水義務化:水不足の深刻化と政府による規制強化により、水道事業者は高度な計測システムの導入を余儀なくされています。スマートメーターはリアルタイムの消費データを提供し、消費者の責任感を高め、正確な監視・報告システムを通じて節水活動を促進します。
- IoTと接続性における技術革新:IoT、LPWAN、クラウド分析機能の統合により、スマートメーターの機能性が向上します。Itronなどの企業は、接続されたプラットフォームを活用して、予知保全、遠隔監視、データ駆動型意思決定機能を提供しています。
市場機会:
- 新興経済国における事業拡大:発展途上地域では、スマートシティやデジタルユーティリティプロジェクトへの投資が活発化している。インフラ投資の増加は、請求精度の向上や水資源管理の改善につながる大規模なスマートメーター導入の機会を生み出している。
- スマートシティ・エコシステムとの統合:スマートメーターはスマートシティ・プラットフォームと統合することで、集中型の公益事業管理を実現します。シーメンスなどのテクノロジープロバイダーとの連携により、高度な分析機能や複数の公益事業を横断する最適化ソリューションが提供されます。
- 高度なデータ分析とAIアプリケーション:AIを活用した分析の普及拡大により、消費予測と需要管理の機会が広がります。スマートメーターは貴重なデータセットを生成し、電力会社が供給計画を最適化し、顧客エンゲージメント戦略を強化することを可能にします。
スマート水道メーター市場レポートのセグメンテーション分析
スマート水道メーター市場は、その構造、成長見通し、および新たなトレンドを理解するために、明確なセグメントに分類されます。以下は、業界レポートで使用されている標準的なセグメンテーション手法です。
テクノロジー別:
- AMI:スマート水道メーターに搭載されたAMI技術は、水道事業者と消費者間の双方向通信を可能にします。AMIシステムはリアルタイムのデータ収集を提供し、水道事業者は水使用量の監視、漏水検知、効率的な配水最適化を行うことができます。この技術は遠隔検針、動的料金設定、予知保全をサポートし、運用効率の向上と水損失の削減に貢献します。
- AMR:AMR技術は、水道メーターの遠隔読み取りを一方通行で行うことで、手動によるメーター読み取りを不要にします。AMRシステムは、無線周波数(RF)または携帯電話ネットワークを使用して、消費データを一定間隔で電力会社に送信します。AMIのようなリアルタイムの洞察は得られませんが、AMRは請求の正確性、業務効率、および人件費の削減に貢献します。
エンドユーザーによる:
- 住宅分野:住宅地における水の消費量は増加傾向にあり、節水に対する意識も高まっています。スマート水道メーターは、正確な料金請求、漏水検知、消費量のリアルタイム監視に役立ち、水の無駄遣いを減らし、住宅所有者の月々の支出管理に貢献します。
- 商業施設:オフィス、ホテル、病院、商業施設などの商業施設では、大量の水道水消費量を監視するためにスマート水道メーターが導入されています。これらのシステムは、コスト管理、持続可能性への準拠、漏水早期発見を支援し、環境および規制基準を満たしながら運用効率を確保します。
- 産業分野:製造、加工、冷却作業において、精密な水監視が不可欠です。スマート水道メーターは詳細な消費量分析を提供し、企業が資源利用を最適化し、規制遵守を維持し、漏水や非効率な水管理による生産中断を最小限に抑えるのに役立ちます。
地域別:
- 北米
- ヨーロッパ
- アジア太平洋地域
- 南米および中央アメリカ
- 中東・アフリカ
スマート水道メーター市場レポートの範囲
| レポート属性 | 詳細 |
|---|---|
| 2025年の市場規模 | 62億米ドル |
| 2026年~2034年までの市場規模 | 158億4000万米ドル |
| 世界の年間平均成長率(2026年~2034年) | 11.5% |
| 履歴データ | 2021年~2024年 |
| 予測期間 | 2026年~2034年 |
| 対象分野 |
タイプ別
|
| 対象地域および国 |
北米
|
| 市場リーダーと主要企業の概要 |
|
スマート水道メーター市場のプレーヤー密度:ビジネスダイナミクスへの影響を理解する
スマート水道メーター市場は、消費者の嗜好の変化、技術革新、製品の利点に対する認識の高まりといった要因によるエンドユーザー需要の増加を背景に、急速に成長しています。需要の高まりに伴い、企業は製品ラインナップを拡充し、消費者のニーズに応えるべく革新を進め、新たなトレンドを活用することで、市場の成長をさらに加速させています。
スマート水道メーター市場の地域別シェア分析
アジア太平洋地域におけるスマート水道メーター市場は、都市化の加速、政府主導のスマートシティ構想、そして水不足への懸念の高まりを背景に、急速な成長を遂げています。中国、インド、日本などの国々は、効率性の向上、無収水量の削減、持続可能な資源管理の支援を目指し、デジタル水道インフラ、高度な計測技術、IoT統合に投資しています。インフラ投資の増加、官民連携、そして正確な料金請求システムを促進する規制改革も、需要拡大を後押ししています。都市部の水道事業の拡大とクラウドベースの監視プラットフォームの普及拡大も、スマートメーターの導入を加速させています。
スマート水道メーター市場の成長は、インフラ整備の成熟度、規制政策、水不足の程度、政府資金、デジタル技術導入のペースなど、地域によって大きく異なります。以下に、地域別の市場シェアと動向の概要を示します。
1. 北アメリカ
- 市場シェア:世界市場のかなりの部分を占めている
-
主な推進要因:
- 高度な公益事業インフラの近代化:米国とカナダ全土の老朽化した水道インフラは、公益事業者がスマートメーターを導入し、運用効率の向上、漏水損失の削減、遠隔監視の実現、長期的な資産管理戦略の強化を図ることを促している。
- 厳格な規制遵守要件
- IoT対応計測技術の高い普及率
- トレンド:AMIプラットフォームの導入拡大により、リアルタイム分析、顧客エンゲージメント、自動請求の精度が向上している。
2. ヨーロッパ
- 市場シェア:早期かつ厳格なEU規制により、相当なシェアを獲得
-
主な推進要因:
- 厳格な節水規制:欧州連合の指令は、効率的な水利用と料金請求の透明性を促進し、水道事業者に対し、漏水検知、消費量追跡、環境持続可能性の枠組みへの準拠を支援するスマートメーターの導入を奨励している。
- 持続可能性とカーボンニュートラルの目標
- 政府支援のデジタル変革プログラム。
- トレンド:スマートメーターをより広範なスマートシティのエコシステムに統合することで、電力会社間のデータ連携と持続可能性計画が改善される。
3. アジア太平洋
- 市場シェア:最も急速に成長している地域であり、圧倒的な市場シェアを誇る。
-
主な推進要因:
- 急速な都市化と人口増加:中国やインドなどの国々における都市部の人口増加は、効率的な配水管理と無収水量の削減のために、水道事業者にスマートメーターの導入を求める圧力を高めている。
- スマートシティインフラへの投資
- 水不足への懸念の高まり
- トレンド:水道事業者は、IoT対応プラットフォームとクラウド分析を活用して、水道管理システムの近代化を図っている。
4. 中東とアフリカ
- 市場シェア:まだ小さいが、急速に成長している
-
主な推進要因:
- 深刻な水不足の課題:乾燥した気候と限られた淡水資源のため、各国政府は都市部や産業部門における消費量の追跡、需要管理、持続可能性の向上を目的として、スマート水道メーターの導入を余儀なくされている。
- 政府による海水淡水化および水管理への投資
- スマートインフラ多様化プログラム
- トレンド:スマートメーターは、国の持続可能性ビジョンやインフラ近代化目標に沿った長期的な節水戦略を支援する。
5. 南米・中央アメリカ
- 市場シェア:着実に成長を続ける市場
-
主な推進要因:
- インフラ開発イニシアチブ:漏水や盗難による大量の水損失は、水道事業者に監視精度の向上、料金徴収の強化、および運用上の透明性の向上につながるスマートメーターシステムの導入を促している。
- 水損失(無収水)の削減。
- 官民連携の拡大
- 傾向:地域におけるスマートメーター導入戦略は、パイロットプロジェクトと段階的な導入を特徴としている。
市場密度の高さと競争の激しさ
シーメンスAG、シュナイダーエレクトリックSE、ハネウェルインターナショナルInc、ハベルInc、ランディス+ギアグループAG、イトロンInc、BOVEテクノロジー、ゼナーインターナショナルGmbH & Co. KG、ザイレムInc、セージェムコムUK Ltdなどの世界的な大手企業が存在するため、競争は激しい。
この高い競争レベルは、企業に次のような点で差別化を図るよう促している。
- 革新的なメーター設計
- IoT対応の高度なスマートメータリング
- 費用対効果の高いソリューション
- 包括的な顧客サポート
- 製品ラインナップを拡充しました。
機会と戦略的動き
- スマートシティ構想との統合 – スマートシティプロジェクトと連携することで、企業は相互接続されたユーティリティソリューションを提供し、ユーティリティ間のデータ分析と運用効率を向上させることができます。
- AIとデータ分析アプリケーション – AIを活用して予測保守、需要予測、消費最適化を行うことで、公益事業者と消費者に付加価値の高いサービスを提供します。
調査の過程で分析されたその他の企業には以下が含まれる
- アラドグループ
- カムストルップ
- バジャーメーター社
- ネプチューン・テクノロジー・グループ株式会社
- ディールメータリング
- アクララ・テクノロジーズLLC
- マスターメーター社
- ミューラーシステムズLLC
- 寧波水道メーター有限公司
- 三川智能科技有限公司
- サントロンテック株式会社
- データマティック社
- Bメーターズ社
- アクイバ株式会社
- BETAR社
スマート水道メーター市場のニュースと最新動向
- ZENNERは2025年5月にIUWS超音波式水道メーターを発表しました。LoRa AllianceでZENNERが発表したIUWS超音波式水道メーターは、シームレスな計測を可能にします。パラレル無線機能により、メーターはワイヤレスM-BusとLoRaWANを介して計測データを同時に送信できます。新しいZENNER IoT Gateway Outdoor 16は大きな注目を集めました。これはIoTアプリケーションの要件に合わせて特別に開発された強力なゲートウェイで、長距離にわたって省エネなデータ伝送を実現します。
- BOVEは2025年6月に4G Cat. 1スマート水道メーターの展開を加速しました。BOVEは新興市場におけるスマートユーティリティを強化するために4G Cat. 1スマート水道メーターの展開を加速しました。スマートシティとデジタルユーティリティが勢いを増し続ける中、4Gセルラー技術はスマートメータリング分野で広く採用されている接続ソリューションとして登場しました。
スマート水道メーター市場レポートの対象範囲と成果物
「スマート水道メーター市場規模と予測(2021年~2034年)」レポートは、以下の分野を網羅した市場の詳細な分析を提供します。
- スマート水道メーター市場の規模と予測(グローバル、地域、国レベル、調査範囲に含まれるすべてのセグメントについて)
- スマート水道メーター市場の動向、および推進要因、阻害要因、主要な機会などのダイナミクス
- 詳細なPEST分析とSWOT分析
- ヘルスケア向けスマート水道メーター市場の分析:主要トレンド、グローバルおよび地域別枠組み、主要企業、規制、および最近の動向を網羅
- スマート水道メーター市場における市場集中度、ヒートマップ分析、主要企業、および最近の動向を網羅した業界概況と競争分析
- 詳細な企業プロフィール

Naveenは、カスタム、シンジケート、コンサルティングの各プロジェクトにおいて9年以上の実績を持つ、経験豊富な市場調査およびコンサルティングのプロフェッショナルです。現在はアソシエイトバイスプレジデントを務め、プロジェクトバリューチェーン全体にわたるステークホルダー管理を成功させ、100件以上の調査レポートと30件以上のコンサルティング案件を執筆しています。産業および政府機関のプロジェクトに幅広く携わり、クライアントの成功とデータに基づく意思決定に大きく貢献しています。
Naveenは、カルナータカ州VTUで電子通信工学の学位を取得し、マニパル大学でマーケティング&オペレーションズのMBAを取得しています。IEEEの会員として9年間活動し、会議や技術シンポジウムへの参加、セクションレベルおよび地域レベルでのボランティア活動に積極的に取り組んでいます。現職以前は、IndustryARCでアソシエイト戦略コンサルタント、Hewlett Packard(HP Global)で産業用サーバーコンサルタントを務めていました。
- 包括的な市場規模および予測分析
- 詳細なセグメンテーション分析
- 市場動向(ダイナミクス)の徹底的な評価
- 地域および国別のインサイト
- 競争環境および企業ベンチマーク
- 戦略的ビジネスインテリジェンス
お客様の声
Insight PartnersのSCADAシステム市場レポートは包括的で、現在のトレンドと将来の予測に関する貴重な洞察が含まれています。チームは終始、非常にプロフェッショナルで、対応が早く、サポートも充実していました。私たちは彼らのサービスに非常に満足しており、強くお勧めします。
ラン・ケデム パートナー, レアリテクノロジーズ株式会社非常に特殊なソフトウェア市場に関するレポートを依頼したところ、チームは数日でレポートを作成してくれました。情報は非常に関連性が高く、分かりやすくまとめられていました。その後、レポートにいくつか修正と追加を依頼しましたが、チームは非常に迅速に対応し、1週間も経たないうちに最終レポートを受け取ることができました。
ジャン=エルヴェ・ジェン 会長, フューチャー・アナリティカ重要な市場調査と予測のために、The Insight Partnersと協力しました。彼らは機会とリスクに関する明確な洞察を提供し、私たちの計画策定に役立ちました。彼らの調査は使いやすく、確かなデータに基づいており、賢明で自信に満ちた意思決定に役立ちました。彼らを強くお勧めします。
ピユーシュ・ナグパル 上級副社長, ハイビームグローバルInsight Partnersは、深い専門知識に基づき、洞察力に富み、構造化された市場調査を提供しました。チームは終始プロフェッショナルで、対応力も抜群でした。ユーザーフレンドリーなウェブサイトにより、業界レポートへのアクセスもスムーズでした。信頼性の高い高品質な調査サービスをお探しなら、Insight Partnersを強くお勧めします。
安達幸彦 最高経営責任者(CEO), ディープブルーLLC。The Insight Partnersから市場レポートを購入するのは今回が初めてです。最初は不安でしたが、ウェブサイトを見て、リスクを負ってでも購入してみようという気持ちになりました。レポートの品質とカスタマーサービスには大変満足しています。最初のレポートにはいくつか質問やコメントがありましたが、アナリストとメールで何度かやり取りした結果、戦略策定プロセスへのインプットとして活用できるレポートが完成しました。貴重なお時間を割いていただき、貴重な体験をさせていただき、誠にありがとうございました。他の方にもぜひお勧めしたいですし、今後さらに市場データが必要になった際には、まずThe Insight Partnersにご連絡させていただきます。
ジョン・スズキ 社長兼最高経営責任者、取締役, BKテクノロジーズナイジェリアの感染症IVD市場に関する情報提供依頼に対し、ご対応いただいた際、ご尽力とプロフェッショナルな姿勢に深く感謝申し上げます。忍耐強く、的確なアドバイスをいただき、また、最終的に取引成立に至った割引のご提供にも深く感謝申し上げます。今回の最初の出会いで得た強い印象のおかげで、今後もThe Insight Partnersとの連携を心待ちにしております。
チジオケ博士 オニア マネージングディレクター, パインクレストヘルスケア株式会社購入理由
- 情報に基づいた意思決定
- 市場動向の理解
- 競合分析
- 顧客インサイト
- 市場予測
- リスク軽減
- 戦略計画
- 投資の正当性
- 新興市場の特定
- マーケティング戦略の強化
- 業務効率の向上
- 規制動向への対応


