
ユーティリティマーカー市場の需要、シェア、成長率(2034年まで)
ユーティリティマーカー市場規模と予測(2021年~2034年)、世界および地域別シェア、トレンド、成長機会分析レポート 対象範囲:タイプ別(ボールマーカー、ディスクマーカー、テープマーカー、スパイクマーカー)、構成別(パッシブ、プログラマブル)、ユーティリティタイプ別(ガス、電力、通信、上下水道)
- ステータス : 公開されたデータ
- レポートコード : TIPRE00039665
- カテゴリー : エネルギーと電力
- ページ数 : 150
- 利用可能なレポート形式 :


- 最終更新日 : April 17, 2026

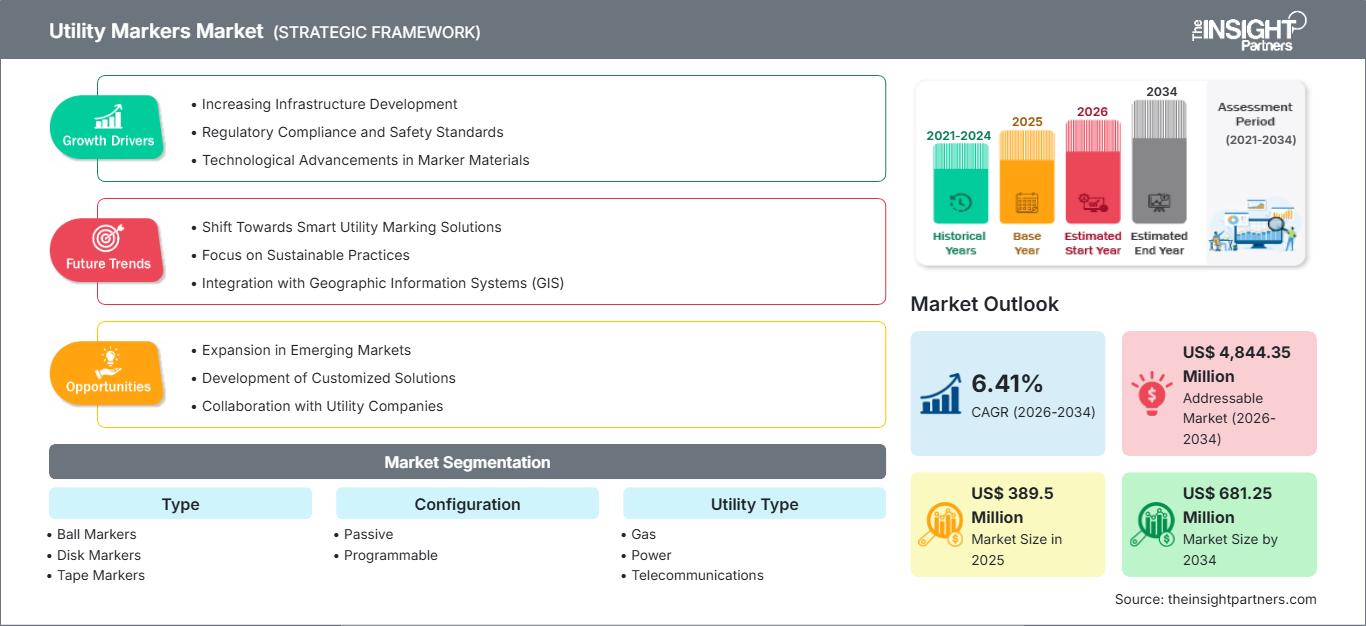
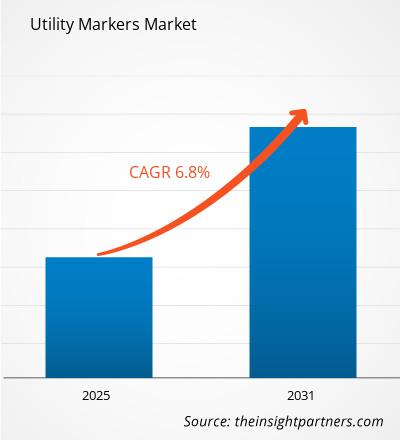
世界のユーティリティマーカー市場規模は、2025年の3億8950万米ドルから2034年には6億8125万米ドルに達すると予測されています。同市場は、2026年から2034年の予測期間中に年平均成長率(CAGR)6.41%を記録すると見込まれています。
本レポートは、タイプ別(ボールマーカー、ディスクマーカー、テープマーカー、スパイクマーカー)、構成別(パッシブ、プログラマブル)、ユーティリティタイプ別(ガス、電力、通信、上下水道)に分類されています。
報告書の目的
The Insight Partnersによるレポート「ユーティリティマーカー市場」は、現状と将来の成長、主要な推進要因、課題、機会を説明することを目的としています。これにより、以下のような様々なビジネス関係者に洞察が提供されます。
- テクノロジープロバイダー/メーカー:市場の動向の変化を理解し、潜在的な成長機会を把握することで、情報に基づいた戦略的意思決定を行うことができる。
- 投資家向け:市場成長率、市場の財務予測、およびバリューチェーン全体に存在する機会に関する包括的なトレンド分析を実施する。
- 規制機関:市場における政策を規制し、活動を監督することで、濫用を最小限に抑え、投資家の信頼を維持し、市場の健全性と安定性を確保することを目的としている。
ユーティリティマーカー市場のセグメンテーション
タイプ
- ボールマーカー
- ディスクマーカー
- テープマーカー
- スパイクマーカー
構成
- 受け身
- プログラム可能
ユーティリティタイプ
- ガス
- 力
- 電気通信
- 水道・下水処理
地理
- 北米
- ヨーロッパ
- アジア太平洋地域
- 中東およびアフリカ
- 南米および中央アメリカ
お客様のご要望に合わせてこのレポートをカスタマイズしてください
無料カスタマイズユーティリティマーカー市場:戦略的洞察
-
本レポートの主要市場トレンドをご覧ください。この無料サンプルには、市場動向から予測、見通しまで、幅広いデータ分析が含まれています。
ユーティリティマーカー市場の成長要因
- インフラ開発の拡大:ユーティリティマーカー市場は、世界中で進行中のインフラ開発によって大きく牽引されています。都市の拡大や新たな建設プロジェクトの出現に伴い、水道、ガス、電気、通信などの地下埋設物を識別するための効果的なマーキングソリューションへのニーズが高まっています。ユーティリティマーカーは、掘削や建設作業中の偶発的な損傷を防ぎ、安全性と規制遵守を確保するための重要なツールです。こうしたユーティリティ識別ソリューションへの需要の高まりは、進行中のインフラプロジェクト数の増加と直接的に関連しています。
- 規制遵守と安全基準:政府機関が課す厳格な規制枠組みと安全基準は、ユーティリティマーカー市場の主要な推進要因となっています。公益事業者は、公共の安全を確保し、建設および保守作業中の事故を防止するために、特定のマーキング要件を遵守する必要があります。ユーティリティマーカーは、地下の配管や構造物を明確に識別するのに役立ち、事故のリスクを軽減します。規制が厳格化するにつれて、信頼性が高く耐久性のあるユーティリティマーキングソリューションへの需要が高まり、市場の拡大をさらに後押しすると予想されます。
- マーカー材料の技術革新:ユーティリティマーカー市場は、材料とマーカー技術の継続的な進歩の恩恵を受けています。耐紫外線性プラスチック、反射コーティング、生分解性材料などの革新技術は、ユーティリティマーカーの耐久性、視認性、環境持続可能性を向上させます。これらの進歩は、マーカーの寿命と有効性を向上させるだけでなく、さまざまな業界における環境に優しいソリューションへの高まる需要にも応えています。メーカーが新しい材料と技術を採用するにつれ、ユーティリティマーカー市場は、持続可能性とイノベーションに向けた業界のトレンドに沿って、成長が見込まれます。
ユーティリティマーカー市場の将来動向
- スマートユーティリティマーキングソリューションへの移行:ユーティリティマーカー市場における重要なトレンドの一つは、機能性を向上させるためにテクノロジーを統合したスマートユーティリティマーキングソリューションへの移行です。QRコード、RFIDタグ、GPSトラッキングなどの機能をユーティリティマーカーに組み込むことで、データ収集、資産管理、ユーティリティネットワークのリアルタイム監視が向上します。これらのスマートソリューションにより、公益事業者は資産を効率的に管理し、業務効率を高め、コストを削減できます。業界がデジタル変革を受け入れるにつれ、インテリジェントなユーティリティマーキングソリューションへの需要は高まることが予想されます。
- 持続可能な取り組みへの注力:業界全体で持続可能性への意識が高まっていることが、ユーティリティマーカー市場にも影響を与えており、メーカーは環境に優しい素材や手法をますます採用しています。リサイクル素材や生分解性素材を使用したユーティリティマーカーへの需要が高まっており、これは環境負荷低減への幅広い取り組みを反映しています。この傾向は、規制上の圧力と、持続可能な製品を求める消費者の嗜好の両方によって推進されています。ユーティリティマーキングソリューションにおいて持続可能性を優先する企業は、環境意識の高い消費者や規制当局の期待に応えつつ、市場で差別化を図ることができます。
- 地理情報システム(GIS)との統合:ユーティリティマーカーと地理情報システム(GIS)技術の統合は、市場における注目すべきトレンドです。GIS技術は、ユーティリティネットワークのマッピングと可視化を可能にし、計画と管理に役立つ貴重なデータを提供します。ユーティリティマーカーをGISデータベースにリンクすることで、組織は資産管理の実践を改善し、業務効率を高め、より良い意思決定プロセスを促進することができます。このトレンドは、ユーティリティ企業がデータ駆動型アプローチを通じてネットワークを最適化し、サービス提供を改善しようとしている中で、特に重要です。
ユーティリティマーカーの市場機会
- 新興市場における事業拡大:インフラ開発が加速している新興市場において、ユーティリティマーカー市場は大きな成長機会を秘めています。アジア太平洋、ラテンアメリカ、アフリカなどの地域では、経済成長と都市化を支えるため、ユーティリティインフラの近代化に多額の投資が行われています。こうした拡大に伴い、安全な建設・保守作業を確保するための効果的なユーティリティマーキングソリューションへの需要が高まっています。これらの市場に進出した企業は、ユーティリティマーカーに対する高まるニーズを活用し、売上と市場シェアを拡大することができます。
- カスタマイズソリューションの開発:メーカーにとって、特定の業界ニーズや地理的要件に合わせたカスタマイズされたユーティリティマーカーソリューションを開発する機会がますます増えています。通信、石油・ガス、水管理など、さまざまな分野では、ユーティリティの識別とマーキングに関して独自の課題があります。こうした特定のニーズに対応する専門的なソリューションを提供することで、メーカーは市場での差別化を図り、顧客との関係を強化し、競争力を高めることができます。
- 公益事業会社との連携:公益事業用マーカーメーカーと公益事業会社との連携は、イノベーションと成長のための有望な機会となります。メーカーは公益事業会社と緊密に連携することで、具体的な課題や要件に関する知見を得ることができ、安全性と効率性を向上させるカスタマイズされたマーキングソリューションを開発することが可能になります。こうしたパートナーシップは、進化する業界ニーズに対応する新製品やサービスの開発につながり、長期的な関係を築き、公益事業用マーカー市場における事業成長を促進します。
ユーティリティマーカー市場レポートの範囲
| レポート属性 | 詳細 |
|---|---|
| 2025年の市場規模 | 3億8950万米ドル |
| 2034年までの市場規模 | 6億8125万米ドル |
| 世界の年間平均成長率(2026年~2034年) | 6.41% |
| 履歴データ | 2021年~2024年 |
| 予測期間 | 2026年~2034年 |
| 対象分野 |
タイプ別
|
| 対象地域および国 |
北米
|
| 市場リーダーと主要企業の概要 |
|
ユーティリティマーカー市場のプレーヤー密度:ビジネスダイナミクスへの影響を理解する
ユーティリティマーカー市場は、消費者の嗜好の変化、技術革新、製品の利点に対する認識の高まりといった要因によるエンドユーザー需要の増加を背景に、急速に成長しています。需要の高まりに伴い、企業は製品ラインナップを拡充し、消費者のニーズに応えるべく革新を進め、新たなトレンドを活用することで、市場の成長をさらに促進しています。
主なセールスポイント
- 包括的な内容:本レポートは、ユーティリティマーカー市場の製品、サービス、種類、エンドユーザーに関する分析を包括的に網羅し、全体像を提供します。
- 専門家による分析:本レポートは、業界の専門家およびアナリストの深い理解に基づいて作成されています。
- 最新情報:本レポートは、最新の情報とデータ動向を網羅しているため、ビジネスにおける関連性が保証されています。
- カスタマイズオプション:このレポートは、特定の顧客要件に対応し、ビジネス戦略に適切に適合するようにカスタマイズできます。
したがって、ユーティリティマーカー市場に関する調査レポートは、業界の状況と成長見通しを解明し理解するための先導役となるでしょう。いくつかの懸念事項はあるものの、このレポートの全体的なメリットはデメリットを上回る傾向があります。

ニヴェディタは、市場調査とビジネスコンサルティングの分野で9年以上の経験を持つ、優れたリサーチプロフェッショナルです。現在、The Insight PartnersでICT分野のプロジェクトマネージャーを務め、多様なテクノロジー分野におけるシンジケート、カスタム、サブスクリプションベース、そしてコンサルティングといった調査業務の管理と実行において深い専門知識を有しています。
データドリブンな分析と実用的なインサイトを提供してきた実績を持つニヴェディタは、数々の重要プロジェクトにおいて重要な貢献を果たしてきました。クライアントの目標理解、市場動向の分析、そして戦略的な提言の導出に至るまで、プロジェクトをエンドツーエンドで遂行します。彼女は大手ICT企業と幅広く協業し、市場機会の特定や業界の変化への対応を支援してきました。
ニヴェディタは、デラドゥンにあるIMSで経営学のMBAを取得しています。The Insight Partners入社前は、プネーのMarketsandMarketsとFuture Market Insightsで貴重な経験を積み、様々なリサーチ業務を経験することで、業界分析とクライアントエンゲージメントにおける確固たる基盤を築きました。
- 包括的な市場規模および予測分析
- 詳細なセグメンテーション分析
- 市場動向(ダイナミクス)の徹底的な評価
- 地域および国別のインサイト
- 競争環境および企業ベンチマーク
- 戦略的ビジネスインテリジェンス
お客様の声
Insight PartnersのSCADAシステム市場レポートは包括的で、現在のトレンドと将来の予測に関する貴重な洞察が含まれています。チームは終始、非常にプロフェッショナルで、対応が早く、サポートも充実していました。私たちは彼らのサービスに非常に満足しており、強くお勧めします。
ラン・ケデム パートナー, レアリテクノロジーズ株式会社非常に特殊なソフトウェア市場に関するレポートを依頼したところ、チームは数日でレポートを作成してくれました。情報は非常に関連性が高く、分かりやすくまとめられていました。その後、レポートにいくつか修正と追加を依頼しましたが、チームは非常に迅速に対応し、1週間も経たないうちに最終レポートを受け取ることができました。
ジャン=エルヴェ・ジェン 会長, フューチャー・アナリティカ重要な市場調査と予測のために、The Insight Partnersと協力しました。彼らは機会とリスクに関する明確な洞察を提供し、私たちの計画策定に役立ちました。彼らの調査は使いやすく、確かなデータに基づいており、賢明で自信に満ちた意思決定に役立ちました。彼らを強くお勧めします。
ピユーシュ・ナグパル 上級副社長, ハイビームグローバルInsight Partnersは、深い専門知識に基づき、洞察力に富み、構造化された市場調査を提供しました。チームは終始プロフェッショナルで、対応力も抜群でした。ユーザーフレンドリーなウェブサイトにより、業界レポートへのアクセスもスムーズでした。信頼性の高い高品質な調査サービスをお探しなら、Insight Partnersを強くお勧めします。
安達幸彦 最高経営責任者(CEO), ディープブルーLLC。The Insight Partnersから市場レポートを購入するのは今回が初めてです。最初は不安でしたが、ウェブサイトを見て、リスクを負ってでも購入してみようという気持ちになりました。レポートの品質とカスタマーサービスには大変満足しています。最初のレポートにはいくつか質問やコメントがありましたが、アナリストとメールで何度かやり取りした結果、戦略策定プロセスへのインプットとして活用できるレポートが完成しました。貴重なお時間を割いていただき、貴重な体験をさせていただき、誠にありがとうございました。他の方にもぜひお勧めしたいですし、今後さらに市場データが必要になった際には、まずThe Insight Partnersにご連絡させていただきます。
ジョン・スズキ 社長兼最高経営責任者、取締役, BKテクノロジーズナイジェリアの感染症IVD市場に関する情報提供依頼に対し、ご対応いただいた際、ご尽力とプロフェッショナルな姿勢に深く感謝申し上げます。忍耐強く、的確なアドバイスをいただき、また、最終的に取引成立に至った割引のご提供にも深く感謝申し上げます。今回の最初の出会いで得た強い印象のおかげで、今後もThe Insight Partnersとの連携を心待ちにしております。
チジオケ博士 オニア マネージングディレクター, パインクレストヘルスケア株式会社購入理由
- 情報に基づいた意思決定
- 市場動向の理解
- 競合分析
- 顧客インサイト
- 市場予測
- リスク軽減
- 戦略計画
- 投資の正当性
- 新興市場の特定
- マーケティング戦略の強化
- 業務効率の向上
- 規制動向への対応


