아프리카 연료 디스펜서 시장 조사 – 규모, 점유율, 개발 및 미래 범위 2030
이전 데이터 : 2020-2021 | 기준 연도 : 2022 | 예측 기간 : 2023-2030아프리카 연료 디스펜서 시장 규모 및 예측(2020~2030년), 글로벌 및 지역 점유율, 추세 및 성장 기회 분석 보고서 범위: 연료 유형별(석유 연료, 압축 연료, 바이오 연료), 디스펜서 시스템(잠수정, 흡입), 최종 사용자(자동차, 산업, 항공우주 및 방위, 해양, 기타) 및 국가
- 상태 : 게시됨
- 보고서 코드 : TIPRE00038844
- 범주 : 제조 및 건설
- 페이지 수 : 156
- 사용 가능한 보고서 형식 :


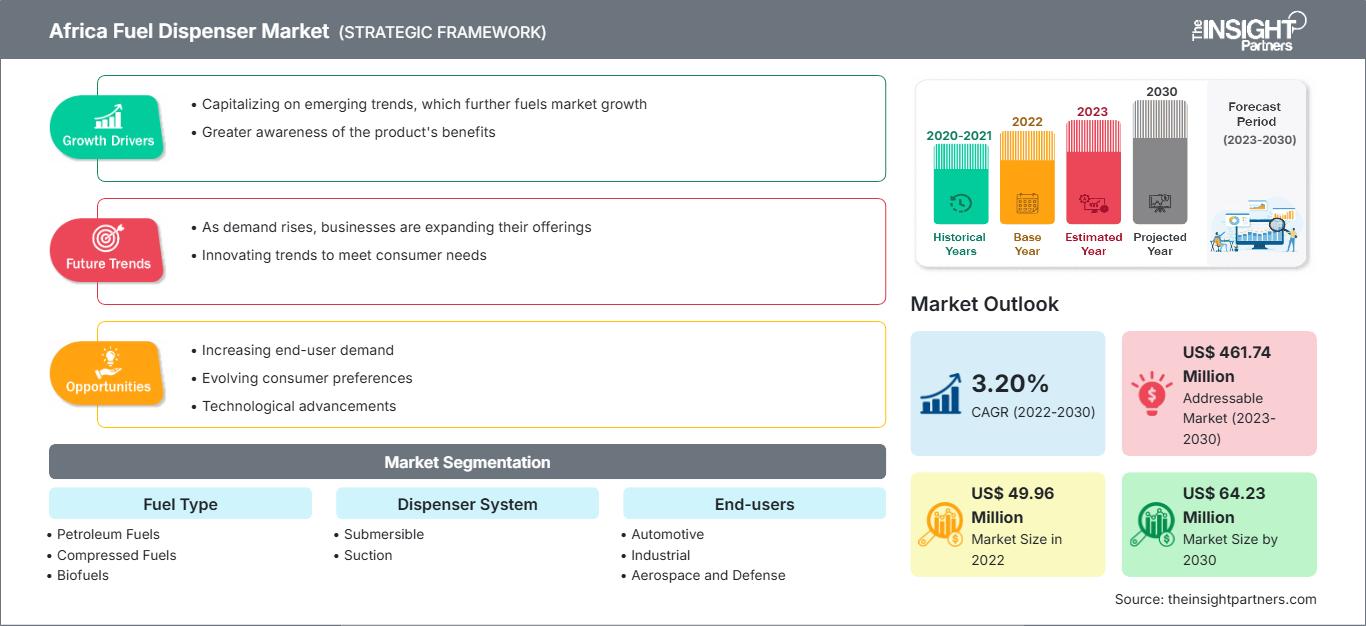
아프리카 연료 자동판매기 시장은 2022년 4,996만 달러 규모였으며, 2030년에는 6,423만 달러에 이를 것으로 예상됩니다. 2022년부터 2030년까지 연평균 성장률(CAGR)은 3.20%에 달할 것으로 전망됩니다.
분석가 관점:
2022년 아프리카 연료 분배기 시장은 나이지리아와 이집트가 각각 34.60%와 20.19%의 시장 점유율로 주도했습니다. 나이지리아와 이집트는 이 지역에서 가장 큰 경제 규모를 자랑하는 국가입니다. 나이지리아의 천연가스 매장량은 2022년 기준 약 208조 6200억 입방피트에 달합니다. 나이지리아 정부는 자동차 및 운송 부문에 압축천연가스(CNG)를 도입하기 위해 대규모 투자를 진행하고 있습니다. 이집트 또한 자동차를 CNG로 전환하기 위한 중요한 조치를 취해왔습니다. 예를 들어, 이집트 정부는 2021년 1월 CNG 자동차 보급 확대 계획을 발표했습니다. 이집트는 천연가스 생산량 자급자족이 가능한 수준으로 평가받고 있습니다.
시장 개요:
연료 분배기는 주유소의 필수 장비로, 휘발유, 디젤 또는 기타 연료를 자동차에 안전하고 효율적으로 주입하는 방법을 제공합니다. 연료를 정확하게 계량하고 분배하여 소비자가 실제로 주입받은 양만큼만 비용을 지불하도록 보장합니다.
아프리카의 강력한 경제 성장과 도시화에 힘입어 연료 수요가 급증하면서 아프리카 주유기 시장은 새로운 성장세를 보일 전망입니다. 경제가 성장함에 따라 다양한 분야에서 에너지 소비가 동시에 증가하고 있으며, 도시화는 이러한 수요를 더욱 증폭시켜 정교한 연료 유통 인프라 구축의 필요성을 증대시키고 있습니다. 도시 중심지와 경제 활동의 거점이 늘어남에 따라 효율적인 교통망에 대한 수요가 증가하고 있으며, 이는 아프리카 주유기 시장의 성장을 견인하고 있습니다. 도시 지역에서 자동차와 대중교통에 대한 의존도가 높아짐에 따라 연료 수요 증가에 대응하기 위한 주유 시스템의 중요성이 더욱 부각되고 있습니다. 아프리카 여러 국가에서 연료 소매 인프라를 현대화하는 것은 아프리카 주유기 시장 전반에 걸쳐 상당한 영향을 미치고 성장을 촉진할 전략적 전환점입니다.
귀하의 요구사항에 맞게 이 보고서를 맞춤 설정하십시오.
무료 맞춤 제작 서비스를 받으세요아프리카 연료 자동판매기 시장: 전략적 고찰
-
이 보고서에서 주요 시장 동향을 확인하세요.이 무료 샘플에는 시장 동향부터 추정치 및 예측에 이르기까지 다양한 데이터 분석이 포함됩니다.
시장 동인:
아프리카의 강력한 경제 성장과 도시화 증가에 힘입어 연료 수요가 급증하고 있으며, 이는 아프리카 연료 분배기 시장을 새로운 차원으로 끌어올릴 전망입니다. 경제가 성장함에 따라 다양한 부문에서 에너지 소비가 비례적으로 증가하고 있습니다. 도시화는 이러한 수요를 더욱 증폭시켜 정교한 연료 유통 인프라 구축의 필요성을 증대시키고 있습니다. 도시 중심지와 경제 활동의 거점이 늘어남에 따라 효율적인 교통망에 대한 수요가 증가하고 있으며, 이는 연료 분배기 수요 증가로 이어지고 있습니다. 도시 지역에서 자동차와 대중교통에 대한 의존도가 높아짐에 따라 연료 분배 시스템이 증가하는 연료 수요를 충족하는 데 있어 중요한 역할을 한다는 점이 더욱 부각되고 있습니다. 아래 표는 2022년 한 해 동안 남아프리카공화국의 연료 수요가 꾸준히 증가했음을 보여줍니다. 이러한 추세는 향후 몇 년 동안 아프리카 연료 분배기 시장에 유망한 성장 기회를 제공할 것으로 예상됩니다.
2022년 1월부터 12월까지 남아프리카공화국 연료 판매량/소비량
용량(백만 리터) |
|||||
|
제품명 |
1분기 - 1월부터 3월까지 |
2분기 - 4월부터 6월까지 |
3분기 - 7월부터 9월까지 |
4분기 - 10월부터 12월까지 |
총합계 |
|
디젤(모든 등급) |
3231.73 |
3133.18 |
3243.82 |
3108.58 |
12717.32 |
|
휘발유 (모든 등급) |
2341.86 |
2236.06 |
2215.98 |
2390.95 |
9184.86 |
|
제트 연료 |
348.61 |
337.00 |
366.94 |
425.58 |
1478.14 |
|
파라핀 |
305.53 |
299.68 |
300.79 |
271.88 |
1177.89 |
|
난방유 |
146.34 |
144.65 |
138.67 |
164.36 |
594.04 |
|
LPG |
90.98 |
86.75 |
68.72 |
76.92 |
323.38 |
|
항공 휘발유 |
1.49 |
1.23 |
0.90 |
1.06 |
4.69 |
|
총합계 |
6466.58 |
6238.57 |
6335.84 |
6439.36 |
25480.37 |
동시에, 아프리카 대륙 전역에 걸쳐 진행되는 산업화는 원활하고 지속적인 연료 공급의 필요성을 증대시키고 있습니다. 경제 발전의 필수 요소인 산업은 제조 공정과 운송을 위해 안정적인 에너지원을 요구합니다. 이러한 산업 활동의 증가는 산업 단지 인근에 전략적으로 배치된 연료 공급 장치의 필요성을 증대시킵니다. 아프리카의 경제 환경은 역동적으로 변화하고 있으며, 이는 아프리카 연료 공급 장치 시장의 이해관계자들에게 전략적 기회를 제공합니다. 첨단 기술에 투자하고 급증하는 수요를 충족하기 위해 연료 유통망을 확장하는 것은 이 지역의 경제 발전 방향과 일맥상통합니다. 경제 성장, 도시화, 산업화의 상호 연관성이 연료 공급 장치에 대한 수요를 촉진함에 따라, 선제적으로 대응하는 업계 관계자들은 이러한 아프리카 연료 공급 장치 시장의 성장을 활용하여 아프리카 전역의 혁신, 인프라 개발 및 지속 가능한 경제 발전을 촉진할 수 있을 것입니다.
부문별 분석:
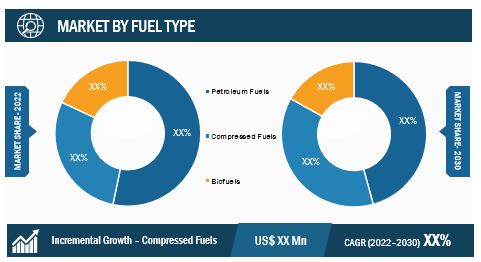
아프리카 연료 주유기 시장은 다양한 연료 유형으로 특징지어지며, 각 유형은 고유한 수요와 지역적 선호도를 충족합니다. 연료 유형에는 석유 연료, 압축 연료 및 바이오 연료가 포함됩니다. 이러한 세분화는 아프리카 대륙의 역동적인 에너지 환경과 더욱 깨끗하고 지속 가능한 연료 옵션으로의 지속적인 전환을 반영합니다. 디젤 주유기는 운송, 산업 및 농업 부문을 지원하는 데 중요한 역할을 계속하고 있습니다. 디젤에 대한 꾸준한 수요는 다양한 차량과 기계에 동력을 공급하는 데 있어 디젤의 중요성을 강조합니다. 휘발유 주유기는 개인 차량과 상용 차량에 필수적입니다. 대체 연료에 대한 관심이 증가하고 있음에도 불구하고, 휘발유는 특히 도시 지역에서 상당한 시장 점유율을 유지하고 있습니다. 더욱 깨끗한 대안으로 CNG의 도입이 점차 확대되고 있습니다. 이집트와 같은 아프리카 국가들은 CNG 인프라 개발을 선도하고 있으며, CNG 차량의 증가와 충전소 네트워크 확장이 이루어지고 있습니다. 에탄올 혼합 연료의 인기가 높아지고 있으며, 바이오 연료 주유기는 더욱 깨끗한 대안에 대한 수요를 충족하고 있습니다. 잠비아에서 선버드 바이오에너지가 카사바를 원료로 사용하는 것과 같은 사례는 지속 가능한 바이오 연료에 대한 관심이 증가하고 있음을 보여주며, 이는 잠비아의 아프리카 연료 분배기 시장 점유율 성장을 촉진하고 있습니다.
- 이 무료 샘플에는 시장 동향부터 추정치 및 예측에 이르기까지 다양한 데이터 분석이 포함됩니다.
지역 분석:
2022년 아프리카 연료 분배기 시장은 나이지리아와 이집트가 각각 34.60%와 20.19%의 시장 점유율로 주도했습니다. 나이지리아와 이집트는 아프리카 지역에서 가장 큰 경제 규모를 자랑하는 국가입니다. 특히 나이지리아의 해상 운송 산업은 빠르게 발전하고 있습니다. 나이지리아의 해상 무역은 석유 및 가스 산업과 밀접한 관련이 있습니다. 아프리카 최대 산유국인 나이지리아는 원유, 정제유, 액화천연가스(LNG) 등 석유 제품을 해상 운송을 통해 수출합니다. 나이지리아는 291척의 선박(총 794만 DWT)을 보유한 아프리카 최대 선박 보유국입니다. 나이지리아 선박은 세계 선박 가치의 0.56%를 차지하며, 세계 30위 규모입니다. 이러한 요인들로 인해 나이지리아의 해양 부문에서 아프리카 연료 분배기 시장 점유율이 증가하고 있습니다.
나이지리아와 이집트 외에도 알제리와 케냐는 수요가 증가하고 있는 주목할 만한 아프리카 국가입니다. 알제리는 아프리카 최대의 원유 및 천연가스 생산국입니다. 2023년 초 기준 알제리의 확인된 천연가스 매장량은 약 159조 입방피트로 추산됩니다. 알제리는 2021년에 이전 어느 해보다 많은 천연가스를 생산했습니다. 케냐는 아프리카에서 가장 빠르게 성장하는 경제국 중 하나입니다. 2023년 3분기 케냐의 GDP는 전년 동기 대비 5.9% 증가했는데, 이는 2022년 같은 분기의 4.3% 성장률을 상회하는 수치입니다. 케냐의 연료 수요가 증가함에 따라 연료 소비량도 지속적으로 증가하고 있습니다. 이러한 연료 소비 증가는 아프리카 연료 분배기 시장의 성장을 촉진하고 있습니다.

- 이 무료 샘플에는 시장 동향부터 추정치 및 예측에 이르기까지 다양한 데이터 분석이 포함됩니다.
주요 선수 분석:
Tiger Pump, Ehad Fuel Equipment, FTI Group Ltd., SAMD, Smartflow, Galileo Technologies SA, Eaglestar Energy Technology Co., Ltd., Dover Fuelling Stations, Prowalco 및 Gilbarco Veeder-Root는 아프리카 연료 분배기 시장의 주요 시장 참여업체입니다.
최근 동향:
아프리카 주유기 시장에서는 기업 인수합병과 같은 무기적 및 유기적 전략이 활발하게 활용되고 있습니다. 이러한 시장 진출은 아프리카 주유기 시장 참여 기업들이 전 세계 시장으로 사업 영역을 확장하고 증가하는 고객 수요를 충족하기 위한 전략입니다. 시장 참여 기업들은 주로 첨단 기능과 기술을 자사 제품에 통합하여 제품 및 서비스를 개선하는 데 집중하고 있습니다. 주요 기업들의 최근 개발 사항은 다음과 같습니다.
년도 |
소식 |
|
2022년 4월 |
헬머리히앤페인(H&P)은 갈릴레오 테크놀로지스에 3,300만 달러를 투자하여 에너지 공급망의 탈탄소화를 목표로 하는 이 회사의 독창적인 기술 플랫폼을 강화했습니다. |
아프리카 연료 주유기 보고서 범위
| 보고서 속성 | 세부 |
|---|---|
| 2022년 시장 규모 | 미화 4,996만 달러 |
| 2030년까지 시장 규모 | 미화 6,423만 달러 |
| 연평균 성장률(2022년~2030년) | 3.20% |
| 역사적 데이터 | 2020-2021 |
| 예측 기간 | 2023-2030 |
| 포함되는 부문 |
연료 종류별로
|
| 대상 지역 및 국가 |
아프리카
|
| 시장 선도 기업 및 주요 기업 프로필 |
|

니베디타는 시장 조사 및 비즈니스 컨설팅 분야에서 9년 이상의 경력을 보유한 뛰어난 리서치 전문가입니다. 현재 The Insight Partners에서 ICT 분야 프로젝트 매니저로 재직 중인 그녀는 다양한 기술 분야에서 신디케이트, 맞춤형, 구독 기반 및 컨설팅 리서치 과제를 관리하고 수행하는 데 있어 심도 있는 전문 지식을 보유하고 있습니다.
데이터 기반 분석과 실행 가능한 인사이트를 제공하는 데 있어 입증된 실적을 바탕으로 니베디타는 여러 주요 프로젝트에 핵심적인 기여를 해왔습니다. 그녀의 업무는 고객 목표 파악, 시장 동향 분석, 전략적 권고 도출에 이르기까지 프로젝트 전반의 실행을 포함합니다. 그녀는 주요 ICT 기업들과 폭넓게 협력하여 시장 기회를 발굴하고 산업 변화를 헤쳐나가는 데 도움을 주었습니다.
니베디타는 데라둔에 위치한 IMS에서 경영학 MBA 학위를 취득했습니다. The Insight Partners에 합류하기 전에는 푸네에 위치한 MarketsandMarkets와 Future Market Insights에서 다양한 리서치 업무를 수행하며 산업 분석 및 고객 참여에 대한 탄탄한 기반을 다지는 귀중한 경험을 쌓았습니다.
- 과거 분석(2년), 기준 연도, CAGR을 포함한 예측(7년)
- PEST 및 SWOT 분석
- 시장 규모 가치/거래량 - 글로벌, 지역, 국가
- 산업 및 경쟁 환경
- Excel 데이터세트
사용 후기
Insight Partners의 SCADA 시스템 시장 보고서는 포괄적이며, 현재 동향과 미래 전망에 대한 귀중한 통찰력을 제공합니다. 팀은 매우 전문적이고, 신속하게 대응하며, 처음부터 끝까지 지원해 주었습니다. 저희는 매우 만족하며 Insight Partners의 서비스를 적극 추천합니다.
란 케뎀 파트너, Reali Technologies LTDs아주 구체적인 소프트웨어 시장에 대한 보고서를 요청했는데, 팀에서 며칠 만에 보고서를 작성해 주셨습니다. 정보는 매우 관련성이 높고 잘 정리되어 있었습니다. 그 후 보고서에 몇 가지 수정과 추가 사항을 요청했습니다. 팀원들의 응답도 매우 빨랐고, 일주일도 채 되지 않아 최종 보고서를 받았습니다.
장-에르브 젠 의장, 퓨처 애널리티카The Insight Partners와 함께 중요한 시장 조사 및 예측 작업을 진행했습니다. Insight Partners는 기회와 위험에 대한 명확한 통찰력을 제공하여 계획을 세우는 데 큰 도움이 되었습니다. The Insight Partners의 조사는 사용하기 쉬웠고, 탄탄한 데이터를 기반으로 했습니다. 덕분에 현명하고 자신 있는 결정을 내릴 수 있었습니다. The Insight Partners를 강력 추천합니다.
피유시 나그팔 수석 부사장, 하이빔 글로벌Insight Partners는 탄탄한 분야 전문성을 바탕으로 통찰력 있고 체계적인 시장 조사를 제공했습니다. Insight Partners 팀은 처음부터 끝까지 전문적이고 신속하게 대응했습니다. 사용자 친화적인 웹사이트 덕분에 업계 보고서에 쉽게 접근할 수 있었습니다. 신뢰할 수 있고 고품질의 조사 서비스를 원하신다면 Insight Partners를 강력 추천합니다.
아다치 유키히코 대표이사, 딥블루 주식회사The Insight Partners에서 시장 보고서를 구매한 것은 이번이 처음입니다. 처음에는 확신이 없었지만, 웹사이트를 방문하고 나서 위험을 감수하고 시장 보고서를 구매하는 것이 더 편하다는 것을 알게 되었습니다. 보고서의 품질과 고객 서비스에 매우 만족합니다. 처음 보고서를 보고 몇 가지 질문과 의견이 있었지만, 분석가와 이메일로 몇 차례 대화를 나눈 후, 전략 기획 과정에 참고할 수 있는 보고서를 확보했다고 생각합니다. 시간을 내어 긍정적인 경험을 선사해 주셔서 정말 감사합니다. 다른 사람들에게도 귀사의 서비스를 적극 추천할 것이며, 추가적인 시장 데이터가 필요할 때면 가장 먼저 귀사에 연락하겠습니다.
존 스즈키 사장 겸 최고 경영자, 이사회 이사, BK 테크놀로지스나이지리아 감염성 질환 IVD 시장 관련 정보 요청에 응해 주신 귀사의 지원과 전문성에 감사드립니다. 귀사의 인내심과 지도, 그리고 할인 혜택을 기꺼이 제공해 주셔서 결국 계약을 성사시킬 수 있었습니다. 첫 만남을 통해 귀사가 저에게 심어주신 좋은 인상을 바탕으로 앞으로도 The Insight Partners와 함께할 수 있기를 기대합니다.
치지오케 박사 오니아 전무이사, 파인크레스트 헬스케어 유한회사구매 이유
- 정보에 기반한 의사 결정
- 시장 역학 이해
- 경쟁 분석
- 고객 인사이트
- 시장 예측
- 위험 완화
- 전략 기획
- 투자 타당성 분석
- 신흥 시장 파악
- 마케팅 전략 강화
- 운영 효율성 향상
- 규제 동향에 발맞춰 대응


 무료 샘플 받기 - 아프리카 연료 분배기 시장