세그먼트, 지리, 역학, 최근 개발 및 전략적 통찰력에 따른 2031년 투명 교정기 시장 보고서
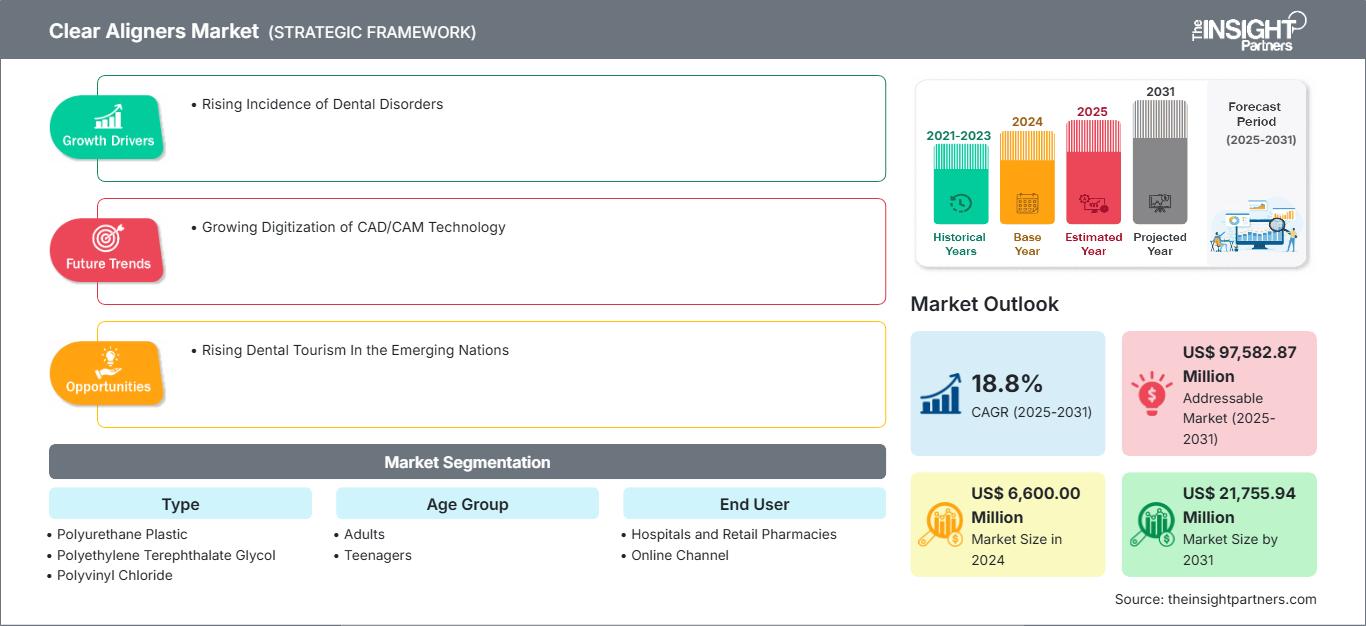
이전 데이터 : 2021-2023 | 기준 연도 : 2024 | 예측 기간 : 2025-2031투명 교정기 시장 규모 및 예측(2021-2031), 글로벌 및 지역별 점유율, 추세 및 성장 기회 분석 보고서 범위: 유형별(폴리우레탄 플라스틱, 폴리에틸렌 테레프탈레이트 글리콜(PETG), 폴리염화비닐(PVC) 및 기타), 연령대별(성인 및 청소년), 최종 사용자(병원 및 소매 약국, 온라인 채널 및 기타), 지역별
- 상태 : 게시됨
- 보고서 코드 : TIPRE00007602
- 범주 : 생명과학
- 페이지 수 : 186
- 사용 가능한 보고서 형식 :


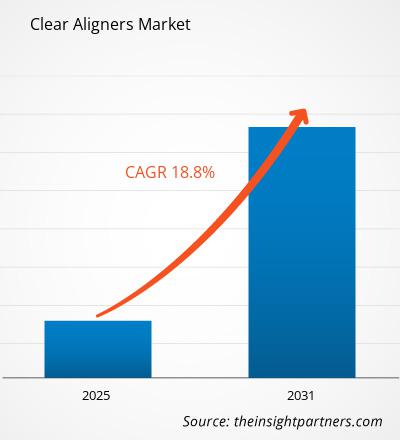
투명 교정기 시장 규모는 2024년 66억 달러에서 2031년 217억 5,594만 달러로 성장할 것으로 예상됩니다. 2025년부터 2031년까지 연평균 성장률(CAGR) 18.8%를 기록할 것으로 예상됩니다. 맞춤형 임플란트의 개발은 예측 기간 동안 새로운 시장 트렌드를 가져올 것으로 예상됩니다.
투명 교정기 시장 분석
비뚤어진 치아, 과개교합, 부정교합, 교차교합, 치아 사이 공간, 치아 과밀, 측두하악 장애(TMD)와 같은 치과 및 구강 질환의 유병률이 증가함에 따라 투명 교정기 사용이 증가하고 있으며, 이는 시장 성장을 촉진하고 있습니다. 치과 문제를 유발하는 요인으로는 치주 질환, 부상, 사고 등이 있습니다. 로이터 통신 2022에 발표된 기사에 따르면, 전 세계적으로 약 35억 명이 구강 질환을 앓고 있으며, 그중 약 25억 명이 치료받지 않은 충치(치아 부식)로 고통받고 있습니다. 미국교정학회(American Association of Orthodontists)에 따르면, 2022년 미국에서 8세에서 17세 사이의 약 315만 명의 환자가 교정 치료를 받았으며, 이는 해당 연령대 인구의 약 7.4%에 해당합니다. BMC 구강 건강 2025에 따르면, 미국에서 교정 치료를 받는 성인의 수는 2016년 155만 명에서 2018년 약 161만 명으로 증가했습니다.
투명 교정기 시장 개요
투명 교정기 시장은 심미적 선호도 증가, 기술 발전, 구강 건강에 대한 인식 제고, 가처분 소득 증가, 그리고 원격 교정과 원격 모니터링의 통합으로 인해 확대되고 있습니다. 개인의 선호도와 치과 상태에 맞는 맞춤형 투명 교정기는 앞으로 큰 기회가 될 수 있습니다.
이 보고서의 일부, 국가 수준 분석, Excel 데이터 팩을 포함하여 모든 보고서에 대한 사용자 정의를 무료로 받을 수 있을 뿐만 아니라 스타트업 및 대학을 위한 훌륭한 제안 및 할인을 이용할 수 있습니다
클리어 얼라이너 시장: 전략적 통찰력
-
이 보고서의 주요 주요 시장 동향을 확인하세요.이 무료 샘플에는 시장 동향부터 추정 및 예측에 이르기까지 데이터 분석이 포함됩니다.
투명 교정기 시장 성장 동력 및 기회
소아 부정교합 유병률 증가
상악 돌출, 전방 부정교합, 전방 간격 등 부정교합을 가진 사람들은 치아 외관과 저작 능력이 좋지 않습니다. Dental Tribune International 2025에 따르면, 부정교합은 전 세계 인구의 약 60~75%에 영향을 미치는 가장 흔한 임상 치과 질환 중 하나입니다. 매년 전 세계적으로 약 2,100만 명이 교정 전문의의 치료를 받습니다. 유병률 기준으로 부정교합은 전 세계적으로 등록된 충치와 치주 질환에 이어 세 번째로 높은 유병률을 보입니다. 부정교합은 자폐 스펙트럼 장애(ASD) 아동에게 더 흔하게 나타납니다. 구치부 교차교합, 성장된 피개교합, 그리고 악골의 역밀도는 소아에서 가장 널리 진단되는 부정교합 소인이었습니다.
Elsevier BVdata에 따르면, 미국에서 중증 심부 피개교합의 유병률은 약 8%였으며, 5세에서 6세 사이 소아의 평균 피개교합은 36.5%에서 39.2%였습니다. 미국 국립 생명공학 정보 센터(NCBI)에 발표된 한 연구에서는 12세에서 18세 사이 청소년 집단의 교합 분석을 시행했습니다. 이 연구에 따르면, 피험자의 93% 이상이 어떤 형태로든 부정교합을 확인했습니다. 부정교합의 유병률은 유럽 청소년에서 더 높았습니다. 미국 국립 생명공학 정보 센터(NCBI) 2021 데이터에 따르면, 1급(34.9%)과 2급 1부(40.0%) 부정교합 사례가 더 높았습니다. 부정교합 증가(18%), 교합 감소(14%), 교합 증가(25.1%), 그리고 역전된 오버젯(10%)이 보고되었습니다. 2019년 PeerJ Journal 자료에 따르면, 일본의 12세에서 15세 청소년 중 Angle Class II의 유병률이 38.2%로 높게 보고되었습니다. 전방 혼잡은 여아에서 남아보다 더 흔했습니다. 따라서 십 대 청소년의 부정교합 발생률 증가는 투명 교정기 사용을 증가시켜 시장 성장을 촉진하고 있습니다.
심미 치과 시술 수요 증가
치과 미용 수술은 전 세계적으로 가장 흔한 미용 시술 중 하나입니다. 미국 미용 치과 학회(AACD)는 환자들이 평생 건강과 외모를 유지하려고 노력하는 데 있어 주요 치과 정보원입니다. 미국성형외과학회(ASPS) 2022에 따르면, 미용 치과 시술은 최근 호황을 누리며 51세에서 64세 사이의 연령대에서 수요가 47% 증가했습니다. GlobeNewswire 2025에 따르면, 치아 미백부터 복잡한 전체 구강 재건까지 전 세계적으로 매년 약 3천만 건의 미용 치과 시술이 시행되고 있습니다. 미용 시술은 더 이상 부유층과 유명 인사에게만 국한되지 않습니다. 북미의 중산층도 심미적 매력에 대한 욕구가 커지면서 이러한 시술을 받고 있습니다. 외과적 치과 시술의 접근성이 높아짐에 따라 투명 교정기 사용이 증가하고 있습니다. 멕시코에서는 미용 치과 시술 비용이 저렴합니다. 멕시코의 평균 미용 치과 시술과 최고 미용 치과 시술의 가격 차이는 크라운 또는 베니어 하나당 약 50달러에서 150달러입니다. 멕시코의 치과 의사들은 고품질 재료를 사용하여 기공소에서 제작한 저렴한 크라운을 제공합니다. 아시아 국가들은 더 낮은 비용과 진보된 시술법을 이용한 미용 시술을 개발하고 있습니다. 태국, 싱가포르, 인도, 말레이시아는 치과 미용 시술의 주요 대상 국가입니다. 미국이나 영국과 같은 선진국 환자들은 싱가포르를 찾아 치료를 받습니다. 이러한 국가에는 혁신적인 치과 치료와 시술을 제공하는 치과 스파가 있습니다. 예를 들어, 태국 방콕에 위치한 방콕 덴탈 스파(Bangkok Dental Spa)는 해외 환자들에게 치과 서비스를 제공합니다. 이처럼 치과 미용 시술의 비용 효율성은 투명 교정기 사용을 촉진하고 시장 성장을 촉진합니다.
투명 교정기 시장 보고서 세분화 분석
투명 교정기 시장 분석 도출에 기여한 주요 세그먼트는 유형, 연령대, 최종 사용자입니다.
- 투명 교정기 시장은 유형에 따라 폴리우레탄 플라스틱, 폴리에틸렌 테레프탈레이트 글리콜(PETG), 폴리염화비닐(PVC) 등으로 세분화됩니다. 폴리우레탄 플라스틱 부문은 2024년 투명 교정기 시장에서 가장 큰 점유율을 차지했습니다.
- 연령대별로 시장은 성인과 소아로 구분됩니다. 성인 부문은 2024년 투명 교정기 시장에서 가장 큰 점유율을 차지했습니다.
- 최종 사용자별로 시장은 병원 및 소매 약국, 온라인 채널 등으로 세분화됩니다. 병원 및 소매 약국 부문은 2024년 투명 교정기 시장에서 가장 큰 점유율을 차지했습니다.
지역별 투명 교정기 시장 점유율 분석
투명 교정기 시장 보고서의 지리적 범위는 주로 북미, 아시아 태평양, 유럽, 중남미, 중동 및 아프리카의 5개 지역에 중점을 둡니다. 수익 측면에서 북미는 2024년 시장을 장악했습니다. 예측 기간 동안 시장에서 우위를 유지할 것으로 예상됩니다. 미국은 투명 교정기 시장에서 상당한 비중을 차지하며 매년 상당한 수의 시술이 수행됩니다. 2023년 Biores Scientia Journal에 발표된 Dentistry and Oral Health Care 연구에 따르면 미국에서는 약 30%의 사람들이 정상 교합을 가지고 있으며, 1급 부정교합의 유병률은 50~55%였습니다. 부정교합의 유병률이 증가함에 따라 기존 금속 교정기보다 심미성, 편안함, 편의성으로 인해 투명 교정기에 대한 수요가 증가하고 있습니다. 투명 교정기는 사실상 눈에 띄지 않고 탈착이 가능하여 기존 교정의 가시성과 불편함 없이 치아 교정을 원하는 성인과 청소년에게 더 매력적인 옵션입니다. 또한 정기적인 조정이 필요한 기존 교정기에 비해 진료실 방문 횟수가 적어 편리합니다. 제품 출시, 제품 승인, 협업 등 전략적 이니셔티브를 실행하는 주요 업체들이 시장 성장을 촉진하고 있습니다. 2024년 5월, OrthoFX는 차세대 고급 투명 교정 폴리머인 NiTime Clear Aligners를 출시했습니다. 이 제품은 미국 식품의약국(FDA) 510(k) 승인을 받은 최초이자 유일한 투명 교정 시스템으로, 모든 유형의 부정교합을 치료하는 의사들이 전국에서 이용할 수 있습니다.
클리어 얼라이너 시장
The Insight Partners의 분석가들은 예측 기간 동안 투명 교정기 시장에 영향을 미치는 지역별 동향과 요인을 면밀히 분석했습니다. 이 섹션에서는 북미, 유럽, 아시아 태평양, 중동 및 아프리카, 그리고 중남미 지역의 투명 교정기 시장 부문과 지역별 분포도 살펴봅니다.
클리어 얼라이너 시장 보고서 범위
| 보고서 속성 | 세부 |
|---|---|
| 시장 규모 2024 | US$ 6,600.00 Million |
| 시장규모별 2031 | US$ 21,755.94 Million |
| 글로벌 CAGR (2025 - 2031) | 18.8% |
| 이전 데이터 | 2021-2023 |
| 예측 기간 | 2025-2031 |
| 다루는 세그먼트 |
By 종류
|
| 포함된 지역 및 국가 |
북미
|
| 시장 선도 기업 및 주요 회사 프로필 |
|
클리어 얼라이너 시장 참여자 밀도: 비즈니스 역학에 미치는 영향 이해
투명 교정기 시장은 소비자 선호도 변화, 기술 발전, 그리고 제품 효능에 대한 인식 제고 등의 요인으로 인한 최종 사용자 수요 증가에 힘입어 빠르게 성장하고 있습니다. 수요가 증가함에 따라 기업들은 제품 라인업을 확장하고, 소비자 니즈를 충족하기 위한 혁신을 추진하며, 새로운 트렌드를 적극 활용하고 있으며, 이는 시장 성장을 더욱 가속화하고 있습니다.
- 을 얻으세요 클리어 얼라이너 시장 주요 주요 플레이어 개요
투명 교정기 시장 뉴스 및 최근 동향
투명 교정기 시장은 1차 및 2차 조사 후 주요 기업 간행물, 협회 데이터, 데이터베이스 등 정성적 및 정량적 데이터를 수집하여 평가합니다. 다음은 투명 교정기 시장에서 관찰된 몇 가지 주요 동향입니다.
- Henry Schein UK는 일반 치과 의사와 교정 전문의를 위한 트윈 교정기 솔루션인 Smilers와 Smilers Expert를 출시했습니다. Henry Schein에 따르면, 이 제품은 부정교합에 대한 맞춤형 치료를 제공하여 치과 의사가 프리미엄 교정 치료를 제공할 수 있도록 지원합니다. (출처: Henry Schein UK, 2025년 2월)
- Align Technology, Inc.는 Align의 Invisalign Palatal Expander System이 의료기기 규정(MDR 2017/745)에 따라 유럽 CE 마크를 획득했다고 발표했습니다. Invisalign 구개 확장 시스템은 영국과 해외 영토의 MHRA에 등록을 완료했습니다. (출처: Align Technology, Inc., 보도자료, 2024년 11월)
투명 교정기 시장 보고서 범위 및 제공 내용
"투명 교정기 시장 규모 및 예측(2021~2031)" 보고서는 아래 영역을 포괄하는 시장에 대한 상세한 분석을 제공합니다.
- 범위에 포함된 모든 주요 시장 부문에 대한 글로벌, 지역 및 국가 수준의 투명 교정기 시장 규모 및 예측
- 투명 교정기 시장 동향 및 성장 동력, 제약, 주요 기회와 같은 시장 역학
- 상세한 PEST 및 SWOT 분석
- 주요 시장 동향, 글로벌 및 지역 프레임워크, 주요 업체, 규정 및 최근 시장 동향을 포괄하는 투명 교정기 시장 분석
- 시장 집중도, 히트맵 분석, 주요 업체 및 투명 교정기 시장의 최근 동향을 포괄하는 산업 환경 및 경쟁 분석
- 상세한 회사 프로필

Mrinal은 생명 과학 시장 정보 분석 및 컨설팅 분야에서 8년 이상의 경력을 보유한 노련한 리서치 분석가입니다. 전략적 사고방식과 탁월함을 향한 확고한 의지를 바탕으로 제약 예측, 시장 기회 평가, 업계 벤치마크 개발 분야에서 심도 있는 전문 지식을 쌓아 왔습니다. 그녀의 업무는 고객이 정보에 기반한 전략적 의사 결정을 내릴 수 있도록 실질적인 통찰력을 제공하는 데 중점을 두고 있습니다.
Mrinal의 핵심 강점은 복잡한 정량적 데이터 세트를 의미 있는 비즈니스 인텔리전스로 변환하는 것입니다. 그녀의 분석적 통찰력은 제약 및 의료기기 분야의 시장 진출(GTM) 전략을 수립하고 성장 기회를 발굴하는 데 중요한 역할을 합니다. 신뢰할 수 있는 컨설턴트로서, 그녀는 고객의 워크플로 프로세스를 간소화하고 모범 사례를 구축하는 데 지속적으로 집중하여 혁신과 운영 효율성을 향상시킵니다.
- 과거 분석(2년), 기준 연도, CAGR을 포함한 예측(7년)
- PEST 및 SWOT 분석
- 시장 규모 가치/거래량 - 글로벌, 지역, 국가
- 산업 및 경쟁 환경
- Excel 데이터세트
사용 후기
Insight Partners의 SCADA 시스템 시장 보고서는 포괄적이며, 현재 동향과 미래 전망에 대한 귀중한 통찰력을 제공합니다. 팀은 매우 전문적이고, 신속하게 대응하며, 처음부터 끝까지 지원해 주었습니다. 저희는 매우 만족하며 Insight Partners의 서비스를 적극 추천합니다.
란 케뎀 파트너, Reali Technologies LTDs아주 구체적인 소프트웨어 시장에 대한 보고서를 요청했는데, 팀에서 며칠 만에 보고서를 작성해 주셨습니다. 정보는 매우 관련성이 높고 잘 정리되어 있었습니다. 그 후 보고서에 몇 가지 수정과 추가 사항을 요청했습니다. 팀원들의 응답도 매우 빨랐고, 일주일도 채 되지 않아 최종 보고서를 받았습니다.
장-에르브 젠 의장, 퓨처 애널리티카The Insight Partners와 함께 중요한 시장 조사 및 예측 작업을 진행했습니다. Insight Partners는 기회와 위험에 대한 명확한 통찰력을 제공하여 계획을 세우는 데 큰 도움이 되었습니다. The Insight Partners의 조사는 사용하기 쉬웠고, 탄탄한 데이터를 기반으로 했습니다. 덕분에 현명하고 자신 있는 결정을 내릴 수 있었습니다. The Insight Partners를 강력 추천합니다.
피유시 나그팔 수석 부사장, 하이빔 글로벌Insight Partners는 탄탄한 분야 전문성을 바탕으로 통찰력 있고 체계적인 시장 조사를 제공했습니다. Insight Partners 팀은 처음부터 끝까지 전문적이고 신속하게 대응했습니다. 사용자 친화적인 웹사이트 덕분에 업계 보고서에 쉽게 접근할 수 있었습니다. 신뢰할 수 있고 고품질의 조사 서비스를 원하신다면 Insight Partners를 강력 추천합니다.
아다치 유키히코 대표이사, 딥블루 주식회사The Insight Partners에서 시장 보고서를 구매한 것은 이번이 처음입니다. 처음에는 확신이 없었지만, 웹사이트를 방문하고 나서 위험을 감수하고 시장 보고서를 구매하는 것이 더 편하다는 것을 알게 되었습니다. 보고서의 품질과 고객 서비스에 매우 만족합니다. 처음 보고서를 보고 몇 가지 질문과 의견이 있었지만, 분석가와 이메일로 몇 차례 대화를 나눈 후, 전략 기획 과정에 참고할 수 있는 보고서를 확보했다고 생각합니다. 시간을 내어 긍정적인 경험을 선사해 주셔서 정말 감사합니다. 다른 사람들에게도 귀사의 서비스를 적극 추천할 것이며, 추가적인 시장 데이터가 필요할 때면 가장 먼저 귀사에 연락하겠습니다.
존 스즈키 사장 겸 최고 경영자, 이사회 이사, BK 테크놀로지스나이지리아 감염성 질환 IVD 시장 관련 정보 요청에 응해 주신 귀사의 지원과 전문성에 감사드립니다. 귀사의 인내심과 지도, 그리고 할인 혜택을 기꺼이 제공해 주셔서 결국 계약을 성사시킬 수 있었습니다. 첫 만남을 통해 귀사가 저에게 심어주신 좋은 인상을 바탕으로 앞으로도 The Insight Partners와 함께할 수 있기를 기대합니다.
치지오케 박사 오니아 전무이사, 파인크레스트 헬스케어 유한회사구매 이유
- 정보에 기반한 의사 결정
- 시장 역학 이해
- 경쟁 분석
- 고객 인사이트
- 시장 예측
- 위험 완화
- 전략 기획
- 투자 타당성 분석
- 신흥 시장 파악
- 마케팅 전략 강화
- 운영 효율성 향상
- 규제 동향에 발맞춰 대응


 무료 샘플 받기 - 클리어 얼라이너 시장