2031 年透明矫正器市场报告(按细分市场、地域、动态、最新发展和战略洞察)
透明矫正器市场规模和预测(2021-2031 年)、全球和区域份额、趋势和增长机会分析报告覆盖范围:按类型(聚氨酯塑料、聚对苯二甲酸乙二醇酯 (PETG)、聚氯乙烯 (PVC) 等)、年龄组(成人和青少年)、最终用户(医院和零售药店、在线渠道等)和地理位置
- 状态 : 已发布
- 报告代码 : TIPRE00007602
- 类别 : 生命科学
- 页数 : 186
- 可用报告格式 :


- 最后更新日期 : April 03, 2025


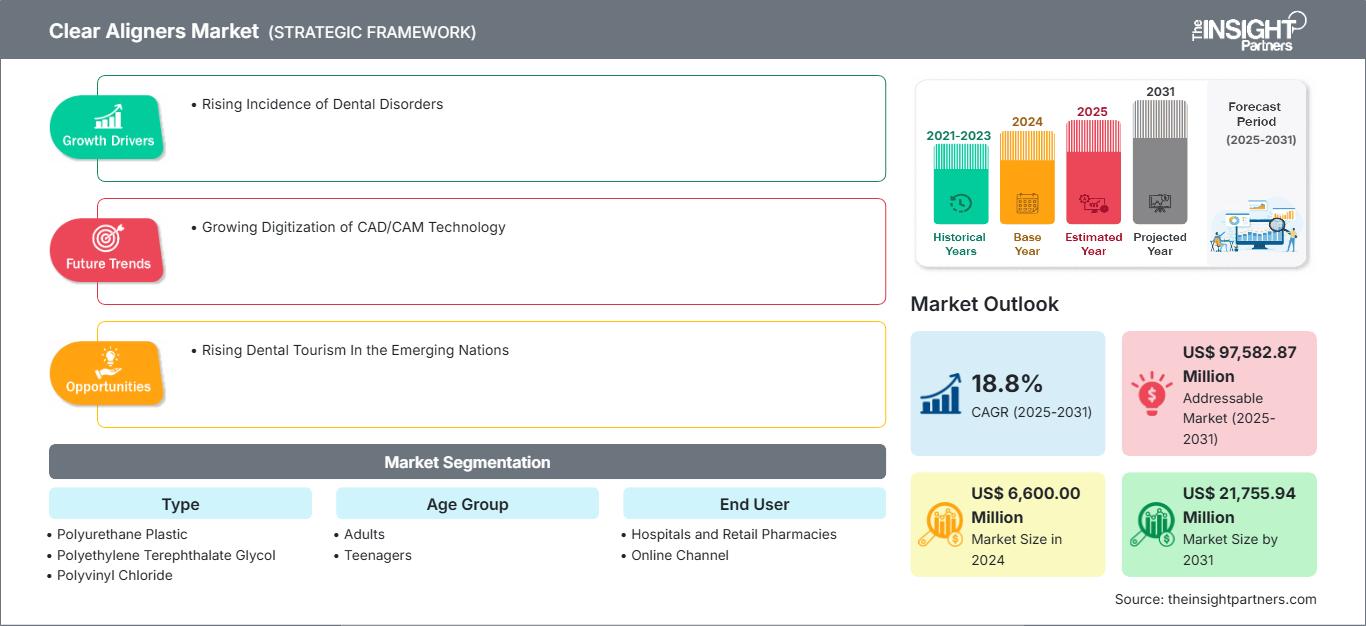
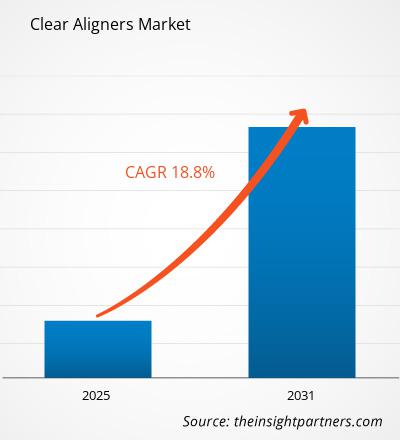
预计到2031年,透明矫正器市场规模将从2024年的66亿美元增至217.5594亿美元。预计2025年至2031年期间,该市场的复合年增长率将达到18.8%。定制化移植材料的发展可能会在预测期内带来新的市场趋势。
透明矫正器市场分析
牙齿不齐、牙齿过度咬合、反颌、交叉咬合、牙齿间隙、牙齿拥挤和颞下颌关节紊乱症 (TMD) 等牙齿和口腔疾病的流行,促使透明矫正器的使用量不断增加,从而推动了市场的增长。导致牙齿问题的因素包括牙周疾病、损伤和意外事故。据路透社 2022 年发表的一篇文章称,全球约有 35 亿人患有口腔疾病,其中近 25 亿人患有未治疗的龋齿(蛀牙)。据美国正畸医师协会统计,2022 年美国约有 315 万名 8 至 17 岁患者正在接受正畸治疗,约占该年龄段人口的 7.4%。据 BMC Oral Health 2025 报道,美国接受正畸治疗的成年人数量从 2016 年的 155 万增加到 2018 年的 161 万。
透明矫正器市场概览
由于人们审美偏好的提升、技术的进步、口腔健康意识的增强、可支配收入的增加以及远程正畸和远程监控的融合,透明矫正器市场正在不断扩大。可定制的透明矫正器能够满足个人喜好和牙齿状况,在未来可能是一个重大机遇。
自定义此报告以满足您的要求
您将免费获得任何报告的定制,包括本报告的部分内容,或国家级分析、Excel 数据包,以及为初创企业和大学提供超值优惠和折扣
透明矫正器市场: 战略洞察
-
获取本报告的主要市场趋势。这个免费样本将包括数据分析,从市场趋势到估计和预测。
透明矫正器市场驱动因素和机遇
儿童错颌畸形患病率不断上升
患有错颌畸形(包括上颌前牙过度突出、前牙不规则和前牙间隙过大)的人牙齿外观和咀嚼功能较差。根据《国际牙科论坛报》2025 年的统计数据,错颌畸形是最常见的临床牙科疾病之一,影响着全球约 60% 至 75% 的人口。全球每年约有 2100 万人选择正畸治疗。就患病率而言,错颌畸形在全球登记的龋齿和牙周病之后排名第三。错颌畸形在自闭症谱系障碍 (ASD) 儿童中更为常见。后牙交叉咬合、上颌过度突出和上颌拥挤是儿童中最常见的错颌畸形特征。
根据 Elsevier BVdata 的数据,美国严重深覆合的患病率约为 8%,5-6 岁儿童的平均覆合率为 36.5% 至 39.2%。美国国家生物技术信息中心 (NCBI) 发表的一项研究对部分 12-18 岁青少年群体的咬合情况进行了分析。研究表明,超过 93% 的受试者确诊存在某种形式的错颌畸形。欧洲青少年的错颌畸形患病率更高。根据美国国家生物技术信息中心 (NCBI) 2021 年的数据,I 类错颌畸形 (34.9%) 和 II 类 1 分类错颌畸形 (40.0%) 的患病率较高。人群中错颌畸形 (18%)、咬合减少 (14%)、牙齿过度突出 (25.1%) 和反向牙齿覆盖 (10%) 均有所增加。根据 PeerJ Journal 2019 年发表的数据,日本 12 至 15 岁青少年中 Angle II 类的患病率高达 38.2%。女孩的前牙拥挤现象比男孩更普遍。因此,青少年错颌畸形发病率的上升正在增加透明矫正器的使用,从而推动市场增长。
美容牙科手术的需求不断增长
牙科美容手术是全球最常见的美容手术之一。美国美容牙科学会 (AACD) 是患者在尝试维持健康功能和终生寻求美牙时的主要牙科资源。根据美国整形外科协会 (ASPS) 2022 年的统计数据,美容牙科近期蓬勃发展,51 至 64 岁人群的美容牙科需求增加了 47%。根据 GlobeNewswire 2025 年的统计数据,全球每年进行近 3000 万例美容牙科手术,涵盖从牙齿美白到复杂的全口重建等各种治疗。美容手术不再仅限于富人和名人。北美的中产阶级人群也正在接受这些手术,因为他们越来越渴望提升自己的审美吸引力。牙科手术的便捷性促进了透明矫正器的普及。
在墨西哥,牙科美容手术的费用较低。在该国,普通美容牙医手术和顶级美容牙医手术的价格差额约为每个牙冠或贴面 50 至 150 美元。墨西哥的牙医提供价格较低的牙冠,并使用优质材料在实验室中制作。亚洲国家正在努力追求成本更低、方法更先进的美容手术。泰国、新加坡、印度和马来西亚是牙科美容手术的热门目的地。来自美国和英国等发达国家的患者选择在新加坡接受治疗。这些国家/地区设有牙科水疗中心,为患者提供创新的牙科治疗和手术。例如,曼谷牙科水疗中心(位于泰国曼谷)为海外患者提供牙科服务。因此,牙科美容手术的成本效益推动了透明矫正器的使用,并推动了市场增长。
透明矫正器市场报告细分分析
促成透明矫正器市场分析的关键细分包括类型、年龄组和最终用户。
- 根据类型,透明矫正器市场细分为聚氨酯塑料、聚对苯二甲酸乙二醇酯 (PETG)、聚氯乙烯 (PVC) 等。 2024年,聚氨酯塑料细分市场占据了透明矫正器市场的最大份额。
- 按年龄组划分,市场分为成人和儿科。2024年,成人细分市场占据了透明矫正器市场的最大份额。
- 按最终用户划分,市场分为医院和零售药店、线上渠道和其他渠道。2024年,医院和零售药店细分市场占据了透明矫正器市场的最大份额。
按地区划分的透明矫正器市场份额分析
透明矫正器市场报告的地理范围主要集中在五个地区:北美、亚太地区、欧洲、南美和中美以及中东和非洲。就收入而言,北美在 2024 年占据了市场主导地位。预计在预测期内,北美将继续占据市场主导地位。美国占透明矫正器市场的很大一部分,每年进行的矫正程序数量相当可观。根据 2023 年发表在《Biores Scientia 杂志》上的牙科和口腔保健研究,在美国,近 30% 的人咬合正常,I 类错颌畸形的患病率为 50% 至 55%。错颌畸形的患病率不断上升,这刺激了对透明矫正器的需求,因为它们比传统的金属牙套更美观、舒适和方便。透明矫正器几乎是隐形的,并且可以拆卸,这使其成为成年人和青少年更有吸引力的选择,他们希望矫正牙齿,但又不想像传统正畸那样看到牙齿,也不方便。此外,与需要定期调整的传统牙套相比,透明矫正器还可以减少就诊次数。关键参与者实施战略举措,例如产品发布、产品审批和合作,推动了市场的增长。2024年5月,OrthoFX 推出了新一代先进的透明矫正器聚合物——NiTime 透明矫正器。它是首个也是唯一一个经美国食品药品监督管理局 (FDA) 510(k) 批准、专为缩短佩戴时间而设计的透明矫正器系统,可供全国范围内治疗各类牙齿错颌畸形的医生使用。
透明矫正器市场
The Insight Partners 的分析师已详尽阐述了预测期内影响透明矫正器市场的区域趋势和因素。本节还讨论了北美、欧洲、亚太地区、中东和非洲以及南美和中美洲的透明矫正器市场细分和地域分布。
透明矫正器市场报告范围
| 报告属性 | 细节 |
|---|---|
| 市场规模 2024 | US$ 6,600.00 Million |
| 市场规模 2031 | US$ 21,755.94 Million |
| 全球复合年增长率 (2025 - 2031) | 18.8% |
| 历史数据 | 2021-2023 |
| 预测期 | 2025-2031 |
| 涵盖的领域 |
By 类型
|
| 覆盖地区和国家 |
北美
|
| 市场领导者和主要公司简介 |
|
透明矫正器市场参与者密度:了解其对业务动态的影响
透明矫正器市场正在快速增长,这得益于终端用户需求的不断增长,而这些需求的驱动因素包括消费者偏好的不断变化、技术进步以及对产品优势的认知度不断提高。随着需求的增长,企业正在扩展产品线,不断创新以满足消费者需求,并抓住新兴趋势,从而进一步推动市场增长。
- 获取 透明矫正器市场 主要参与者概述
透明矫正器市场新闻及最新发展
透明矫正器市场评估通过收集一手和二手研究后的定性和定量数据进行,这些数据包括重要的公司出版物、协会数据和数据库。以下是透明矫正器市场见证的一些关键发展:
- 英国 Henry Schein 公司推出了 Smilers 和 Smilers Expert,这是针对全科牙科医生和正畸医生的双重矫正器解决方案。据 Henry Schein 称,这些产品提供可定制的错颌畸形治疗,使牙科医生能够提供优质的正畸护理。(来源:英国 Henry Schein,2025 年 2 月)
- Align Technology, Inc. 宣布,其 Invisalign 腭扩张器系统已根据欧洲医疗器械法规 (MDR 2017/745) 获得 CE 标志。 Invisalign 腭扩张器系统已完成英国及海外领土 MHRA 的注册。 (来源:Align Technology, Inc.,新闻稿,2024 年 11 月)
透明矫正器市场报告覆盖范围和可交付成果
《透明矫正器市场规模和预测(2021-2031)》报告对市场进行了详细的分析,涵盖以下领域:
- 涵盖范围内所有主要细分市场的全球、区域和国家/地区透明矫正器市场规模和预测
- 透明矫正器市场趋势以及市场动态,例如驱动因素、限制因素和关键机遇
- 详细的 PEST 和 SWOT 分析
- 透明矫正器市场分析,涵盖主要市场趋势、全球和区域框架、主要参与者、法规和最新市场发展
- 行业格局和竞争分析,涵盖市场集中度、热图分析、知名参与者和透明矫正器市场的最新发展
- 详细的公司简介

Mrinal 是一位经验丰富的研究分析师,在生命科学市场情报和咨询领域拥有超过 8 年的经验。凭借战略思维和对卓越的不懈追求,她在医药预测、市场机遇评估和行业基准制定方面积累了深厚的专业知识。她的工作致力于提供切实可行的洞察,帮助客户做出明智的战略决策。
Mrinal 的核心优势在于将复杂的定量数据集转化为有意义的商业智能。她敏锐的分析能力有助于制定市场进入 (GTM) 战略,并发掘制药和医疗器械行业的增长机会。作为一名值得信赖的顾问,她始终致力于简化工作流程并建立最佳实践,从而为客户推动创新并提高运营效率。
- 全面的市场规模与预测分析
- 详细的细分市场分析
- 深入的市场动态评估
- 区域及国家级洞察
- 竞争格局与企业对标分析
- 战略性商业情报
客户评价
Insight Partners 的 SCADA 系统市场报告内容全面,对当前趋势和未来预测提供了宝贵的见解。该团队始终高度专业、响应迅速且乐于助人。我们非常满意,强烈推荐他们的服务。
兰·凯德姆 伙伴, Reali Technologies LTD我请求一份关于特定软件市场的报告,团队在几天内就完成了。报告信息非常相关,而且呈现得非常出色。之后,我请求对报告进行一些修改和补充。团队再次迅速响应,不到一周我就收到了最终报告。
让-埃尔韦·詹恩 主席, 未来分析公司我们与 Insight Partners 合作进行了一项重要的市场研究和预测。他们清晰地洞察了机遇和风险,帮助我们制定了计划。他们的研究简单易用,数据可靠,帮助我们做出了明智而自信的决策。我们强烈推荐他们。
皮尤什·纳格帕尔 高级副总裁, 远光全球Insight Partners 凭借其深厚的行业专业知识,提供了富有洞察力、结构合理的市场研究。他们的团队始终专业且响应迅速。用户友好的网站让访问行业报告变得顺畅无阻。我们强烈推荐他们可靠、高质量的研究服务。
安达幸彦 首席执行官, 深蓝有限责任公司这是我第一次从The Insight Partners购买市场报告。起初我有些犹豫,但访问了他们的网站后,我更放心地冒险购买市场报告。我对报告的质量和客户服务非常满意。我对最初的报告有一些疑问和意见,但在与他们的分析师通过电子邮件沟通了几次后,我相信这份报告可以作为我们战略规划流程的参考。非常感谢您抽出宝贵的时间,让这次体验如此愉快。我一定会向其他人推荐你们的服务,当我们需要更多市场数据时,你们将是我的首选。
约翰·铃木 总裁兼首席执行官、董事会董事, BK科技感谢您在处理我关于尼日利亚传染病体外诊断市场信息请求的过程中所展现的支持和专业精神。感谢您的耐心、指导,以及您愿意提供的折扣,最终促成了这笔交易。我期待未来与 Insight Partners 继续合作,这一切都要归功于您与我初次接触后留下的良好印象。
奇吉奥克博士 ONYIA 董事总经理, PineCrest 医疗保健有限公司购买理由
- 明智的决策
- 了解市场动态
- 竞争分析
- 客户洞察
- 市场预测
- 风险规避
- 战略规划
- 投资论证
- 识别新兴市场
- 优化营销策略
- 提升运营效率
- 顺应监管趋势


