해양 분석 시장 분석 및 규모, 점유율, 성장, 추세별 2025년 전망
이전 데이터 : 2021-2023 | 기준 연도 : 2024 | 예측 기간 : 2025-2031해양 분석 시장 규모 및 예측(2021-2031), 글로벌 및 지역별 점유율, 추세 및 성장 기회 분석 보고서 범위: 구성 요소(소프트웨어 및 서비스), 배포(클라우드 및 온프레미스), 애플리케이션(예측 및 처방 분석, 최적 경로 매핑, 가격 통찰력, 선박 안전 및 보안, 기타), 최종 사용자(상업 및 군사), 지역별
- 상태 : 게시됨
- 보고서 코드 : TIPRE00003041
- 범주 : 기술, 미디어 및 통신
- 페이지 수 : 227
- 사용 가능한 보고서 형식 :


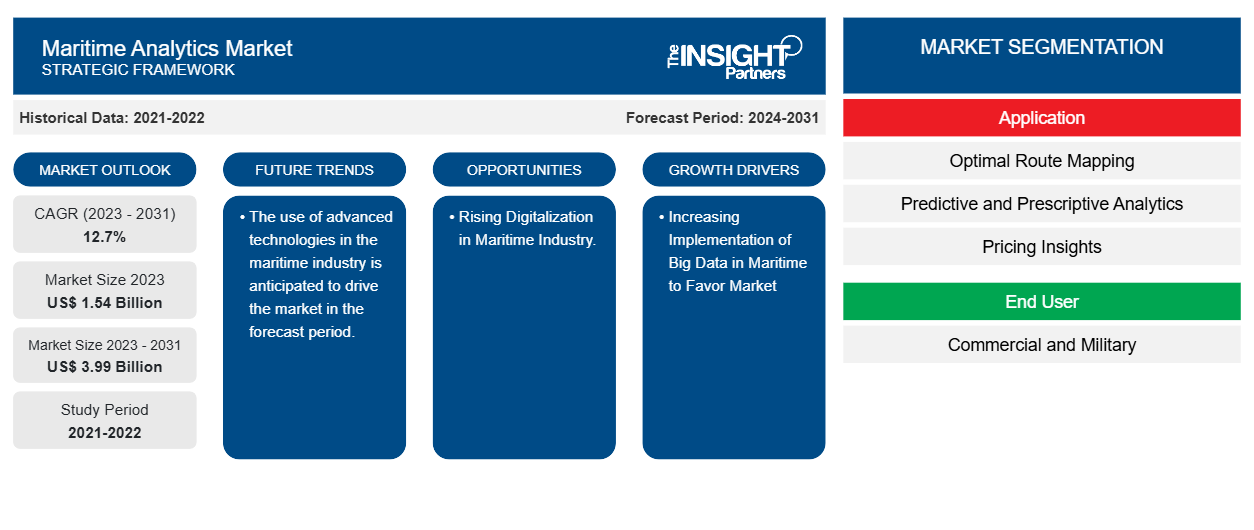
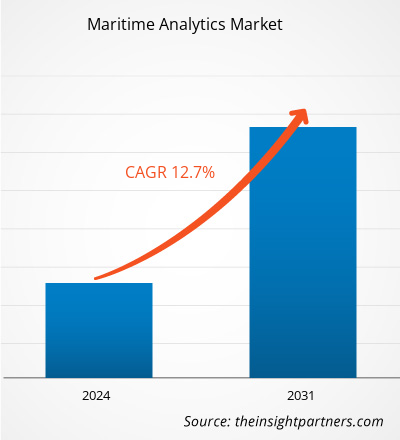
해양 분석 시장 규모는 2024년에 12억 7천만 달러로 평가되었으며, 2031년에는 25억 6천만 달러에 이를 것으로 예상됩니다. 2025년부터 2031년까지 연평균 성장률(CAGR)은 10.6%에 이를 것으로 추산됩니다. 해양 분석 소프트웨어와 AI 및 ML의 통합은 앞으로도 주요 시장 동향으로 남을 가능성이 높습니다.
해양 분석 시장 분석
해양 분석의 주요 이점 중 하나는 기업이 엄격한 환경 규정을 준수하는 데 도움이 된다는 것입니다. 배출량 모니터링, 연료 사용 최적화 및 국제 해사 기구(IMO)의 탄소 배출 규정과 같은 국제 환경 표준 준수를 보장하는 데 도움이 될 수 있습니다. 해양 분석 도입에 기여하는 주요 동인 중 하나는 운영 최적화의 필요성입니다. 이는 기업이 함대 관리, 경로 최적화, 연료 소비 및 유지 관리 일정과 같은 프로세스를 간소화하는 데 도움이 됩니다. 실시간 데이터를 활용함으로써 기업은 연료 사용량을 줄이고, 함대 성능을 개선하고, 운영 비용을 절감하기 위한 데이터 기반 의사 결정을 내려 더욱 효율적이고 수익성 있는 운영에 기여할 수 있습니다. 인공 지능(AI), 머신 러닝(ML), 사물 인터넷(IoT) 및 클라우드 컴퓨팅의 급속한 발전은 해양 분석 시장 의 성장을 촉진합니다 . 이러한 기술을 통해 선박, 항만 및 공급망에서 방대한 양의 데이터를 수집, 처리 및 분석하여 기업에 의사 결정을 개선하고, 추세를 예측하고, 전반적인 운영 성과를 향상시키는 도구를 제공합니다.
해양 분석 시장 개요
해양 분석은 고급 데이터 분석, AI , ML 기술 을 활용하여 해운 산업 내 운영을 최적화하고 향상시키는 것을 의미합니다. 선박, 항만 및 기타 해양 자산에서 생성되는 방대한 양의 데이터를 수집, 처리 및 분석하여 의사 결정을 개선하고, 프로세스를 간소화하며, 효율성을 높이는 과정이 여기에 포함됩니다. 해양 분석은 해운 회사, 물류 제공업체 및 항만 당국에 운영 비용 절감, 안전성 향상, 전반적인 효율성 증대를 위한 실행 가능한 통찰력을 제공합니다. 이러한 분석 도구는 선박 성능 추적, 연료 소비 모니터링, 운송 경로 최적화, 유지보수 필요성 예측, 승무원 관리 강화에 도움이 될 수 있습니다. 실시간 데이터를 활용하여 기업은 장비 고장, 비효율적인 항로, 안전 위험과 같은 잠재적 문제를 사전에 해결하고 가동 중단 시간을 줄이며 수익성을 높일 수 있습니다.
귀하의 요구 사항에 맞게 이 보고서를 사용자 정의하세요
이 보고서의 일부 또는 국가 수준 분석, Excel 데이터 팩을 포함하여 모든 보고서에 대한 사용자 정의를 무료로 받을 수 있으며, 신생 기업 및 대학을 위한 훌륭한 혜택과 할인도 이용할 수 있습니다.
해양 분석 시장: 전략적 통찰력
-
이 보고서에서 주요 시장 동향을 알아보세요.이 무료 샘플에는 시장 동향부터 추정치 및 예측까지 다양한 데이터 분석이 포함됩니다.
해양 분석 시장 동인 및 기회
해상 물류 및 디지털화 확대
국제 무역이 지속적으로 증가함에 따라 해운 산업은 효율성, 지속가능성, 그리고 실시간 운영 가시성에 대한 요구가 더욱 커지고 있습니다. 해양 분석은 해운 운영 최적화, 선대 관리 개선, 그리고 비용 절감을 위한 데이터 기반 인사이트를 제공함으로써 이러한 요구를 충족하는 데 중요한 역할을 합니다. 유엔무역개발기구(UNCTAD)에 따르면, 2023년 세계 해운 무역량은 2.4% 증가한 123억 톤을 기록하며 2022년 감소세에서 회복세를 보였습니다. 해운 산업은 2024년 2%에서 2029년까지 연평균 2.4% 성장할 것으로 예상됩니다. 주요 기업들은 해운, 물류, 그리고 공급망 역량을 확장하기 위해 투자를 확대하고 있습니다. 2025년 3월, 해운, 육로, 항공 및 물류 솔루션 분야의 글로벌 리더이자 미국 국적선사 아메리칸 프레지던트 라인스(APL)의 모회사인 CMA CGM 그룹은 향후 4년간 미국 해운 경제 강화 및 미국 국내 공급망 혁신 지원을 위해 200억 달러(미화) 투자를 발표했습니다. 이번 투자는 CMA CGM 그룹의 35년 미국 역사를 더욱 발전시키는 계기가 될 것입니다. 현재 CMA CGM 그룹은 40개 주에서 사업을 운영하고 있으며, 전국적으로 15,000명의 직원을 고용하고 있습니다. 미국 무역의 핵심 파트너로서 CMA CGM은 매년 500만 개 이상의 컨테이너를 미국으로 운송합니다.
디지털 기술과 데이터 기반 솔루션은 해운 산업을 혁신하여 효율성을 높이고, 의사 결정을 개선하며, 업계의 다양한 측면에서 전반적인 성과를 최적화하고 있습니다. 디지털 기술 도입은 선박 관리 및 유지보수를 강화하고, 신뢰성을 향상시키며, 선박의 수명을 연장하고, 비용을 절감하는 데 기여하고 있습니다. 해운 산업의 디지털화 및 자동화 전환은 가속화되고 있습니다. 디지털 기술과 솔루션은 경쟁력을 강화하고 운영 효율성을 높이는 데 활용되고 있습니다. 이러한 혁신은 세기 중반까지 국제 해운에서 탄소 배출 제로를 달성한다는 목표를 가지고 업계의 탈탄소화 노력을 진전시키고 있습니다. 2025년 3월, 인도와 싱가포르는 해양 디지털화 및 탈탄소화 프로젝트 협력을 위한 의향서(LoI)에 서명했습니다. 여기에는 싱가포르-인도 그린 및 디지털 해운 회랑(GDSC)에 대한 양해각서(MOU)를 통해 파트너십을 공식화하고 이러한 노력에 기여할 수 있는 관련 이해관계자를 파악하는 내용이 포함됩니다. 따라서 디지털화 추세의 증가와 해상 물류의 확장은 해양 분석 시장의 성장을 견인하고 있습니다.digitalization and automation is accelerating in the maritime industry. Digital technologies and solutions are being leveraged to enhance competitiveness and drive operational efficiency. These innovations are advancing the industry's decarbonization efforts, with the goal of achieving zero emissions in international shipping by mid-century. In March 2025, India and Singapore signed a Letter of Intent (LoI) to collaborate on maritime digitalization and decarbonization projects, including identifying relevant stakeholders who could contribute to the effort and work toward formalizing the partnership through a memorandum of understanding on a Singapore-India Green and Digital Shipping Corridor (GDSC). Thus, the increasing trend of digitization, along with the expanding maritime logistics, is driving the growth of the maritime analytics market.
규제 준수 및 지속 가능성 이니셔티브
규제 기관은 해상 운송 의 환경 발자국을 줄이기 위해 적극적인 조치를 시행했습니다 .예를 들어, 국제 해사 기구(IMO)는 더 엄격한 환경 기준을 시행하기 위해 에너지 효율 기존 선박 지수(EEXI)와 탄소 강도 지표(CII)를 도입했습니다.2023년 1월 1일부터 이러한 이니셔티브는 2008년 수준을 기준으로 2050년까지 선박의 온실 가스(GHG) 배출량을 50% 줄이는 것을 목표로 합니다.EEXI와 CII는 해리당 운송되는 화물 톤당 이산화탄소 배출량을 측정하기 위한 벤치마크를 설정했습니다(IMO, 2021a, 2021b).또한 유럽 연합의 'Fit for 55' 프로그램은 1990년 수준 대비 2030년까지 GHG 배출량을 55% 줄이는 것을 목표로 합니다(유럽 위원회, 2021a; 유럽 위원회, 2021b).
정부와 국제기구가 엄격한 배출 감축 목표와 지속가능성 규제를 시행함에 따라, 해운 기업들은 규정 준수를 위해 고급 분석 솔루션에 주목하고 있습니다. 이러한 분석 도구를 통해 기업은 환경 영향을 모니터링 및 관리하고, 배출 수준을 추적하고, 연료 사용량을 최적화하고, 선단의 지속가능성을 향상시킬 수 있습니다. 이러한 솔루션을 도입함으로써 기업은 현재 및 미래의 규정을 준수하는 동시에 기업의 사회적 책임(CSR) 목표를 달성할 수 있습니다. 지속가능성 및 규정 준수 중심 솔루션에 대한 수요 증가는 해운 기업들이 운영 효율성 향상과 환경 발자국 감소에 집중함에 따라 해양 분석 기술 제공업체에게 강력한 시장 기회를 제공합니다.
해양 분석 시장 보고서 세분화 분석
해양 분석 시장 분석에서 도출된 주요 세그먼트는 구성 요소, 배포 모드, 애플리케이션 및 최종 사용자입니다.
- 구성 요소를 기준으로 시장은 소프트웨어와 서비스로 구분됩니다. 2024년에는 소프트웨어 부문이 시장을 주도했습니다.
- 배포 방식을 기준으로 시장은 온프레미스와 클라우드로 구분됩니다. 2024년에는 클라우드 부문이 시장을 주도했습니다.
- 시장은 응용 분야별로 최적 경로 매핑, 예측 및 처방 분석, 가격 인사이트, 선박 안전 및 보안 등으로 구분됩니다. 예측 및 처방 분석 부문은 2024년에 시장을 주도했습니다.
- 최종 사용자 기준으로 시장은 상업용과 군용 시장으로 구분됩니다. 2024년에는 상업용 부문이 시장을 주도했습니다.
지역별 해양 분석 시장 점유율 분석
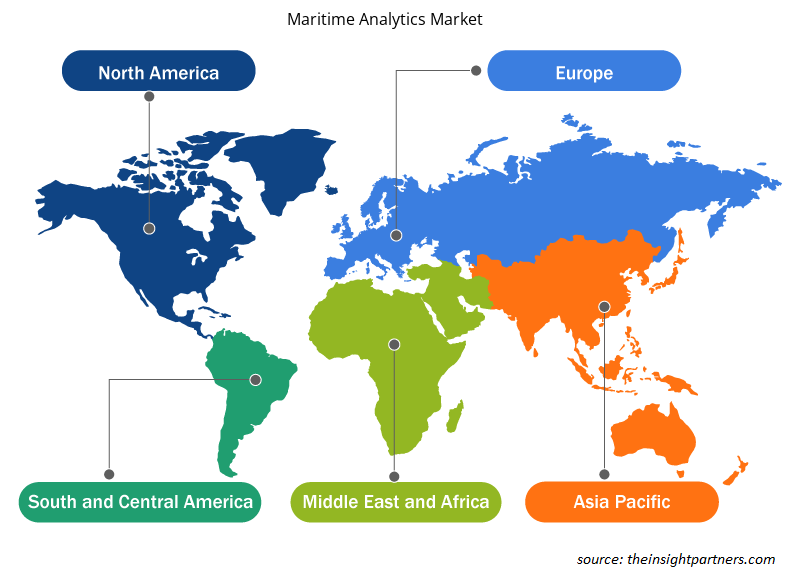
- 해양 분석 시장은 북미, 유럽, 아시아 태평양(APAC), 중동 및 아프리카(MEA), 중남미의 5개 주요 지역으로 구분됩니다. 2023년에는 아시아 태평양 지역이 시장을 주도했으며, 유럽과 북미가 그 뒤를 이었습니다.
- 북미 지역에서 미국은 선진 항만 인프라와 강력한 해운 부문으로 유명하며, 이는 주로 수입품 산업에 대한 국가의 의존도에 기인합니다. 2023년 미국 해운 수출입 무역 데이터에 따르면 미국은 총 무역 규모가 5조 2,100억 달러이며 무역 적자는 1조 1,900억 달러입니다. 아시아 경제로의 제조 및 생산 아웃소싱은 이러한 의존도를 강화했습니다. 미국 해운 산업은 인프라의 효율적인 운영, 유지 관리 및 성장을 보장하기 위해 전문적인 기술 솔루션과 서비스에 의존합니다. 재정 지원의 가용성과 첨단 기술 솔루션의 조기 도입이 결합되어 미국 기업 간 해양 분석 소프트웨어 도입이 가속화되었습니다. 이러한 변화로 인해 예측 유지 관리, 경로 최적화, 보안 및 위험 관리에 중점을 둔 현대 도구가 해운 부문에서 널리 채택되어 시장 참여자에게 기회가 창출되었습니다. 2024년 11월, 해상 무역 정보 제공을 위한 데이터 및 분석 플랫폼인 Kpler는 Spire Global로부터 실시간 글로벌 선박 추적을 위한 위성 기반 데이터 제공업체인 Spire Maritime을 인수하는 계약을 체결했습니다. 2억 4,100만 달러 규모의 이번 인수에는 2억 3,350만 달러의 인수 금액과 인수 종료 후 12개월 동안의 서비스 제공에 대한 750만 달러의 추가 금액이 포함됩니다. 이번 인수는 이 지역의 해양 분석 수요 증가를 보여줍니다.
해양 분석 시장 지역 통찰력
Insight Partners의 분석가들은 예측 기간 동안 해양 분석 시장에 영향을 미치는 지역별 동향과 요인을 면밀히 분석했습니다. 이 섹션에서는 북미, 유럽, 아시아 태평양, 중동 및 아프리카, 그리고 중남미 지역의 해양 분석 시장 부문 및 지역별 현황도 살펴봅니다.
- 해양 분석 시장을 위한 지역별 데이터 얻기
해양 분석 시장 보고서 범위
| 보고서 속성 | 세부 |
|---|---|
| 2024년 시장 규모 | 12억 7천만 달러 |
| 2031년까지 시장 규모 | 25억 6천만 달러 |
| 글로벌 CAGR(2025~2031년) | 10.6% |
| 역사적 데이터 | 2021-2023 |
| 예측 기간 | 2025-2031 |
| 다루는 세그먼트 |
구성 요소별
|
| 포함된 지역 및 국가 |
북아메리카
|
| 시장 선도 기업 및 주요 회사 프로필 |
|
해양 분석 시장 참여자 밀도: 비즈니스 역학에 미치는 영향 이해
해양 분석 시장은 소비자 선호도 변화, 기술 발전, 그리고 제품 이점에 대한 인식 제고 등의 요인으로 인한 최종 사용자 수요 증가에 힘입어 빠르게 성장하고 있습니다. 수요가 증가함에 따라 기업들은 제품 및 서비스를 확장하고, 소비자 니즈를 충족하기 위한 혁신을 추진하며, 새로운 트렌드를 적극 활용하고 있으며, 이는 시장 성장을 더욱 가속화하고 있습니다.
시장 참여자 밀도는 특정 시장이나 산업 내에서 활동하는 기업들의 분포를 나타냅니다. 이는 특정 시장 공간에 얼마나 많은 경쟁자(시장 참여자)가 존재하는지를 규모 또는 전체 시장 가치 대비로 나타냅니다.
해양 분석 시장에서 운영되는 주요 회사는 다음과 같습니다.
- 씨줄
- 제로노스 A/S
- 솔리트워크
- 윈드워드 유한회사
- 크플러
- 오빗MI 주식회사
면책 조항 : 위에 나열된 회사는 특정 순서에 따라 순위가 매겨지지 않았습니다.
- 해양 분석 시장의 주요 기업 개요를 알아보세요
해양 분석 시장 뉴스 및 최근 동향
해양 분석 시장은 1차 및 2차 조사 이후 주요 기업 간행물, 협회 데이터, 데이터베이스 등 정성적 및 정량적 데이터를 수집하여 평가합니다. 해양 분석 시장의 몇 가지 동향은 다음과 같습니다.
- Maritech Holdings Limited의 브랜드 Sea는 최근 인수한 Chinsay와 MarDocs의 모든 고객을 Sea 계약 관리 솔루션으로 이전했습니다. 이를 통해 Sea는 리캡(recap) 및 용선 계약의 관리 및 체결을 위한 통합 플랫폼을 구축하여 전 세계 해상 무역 생태계의 모든 참여자에게 혜택을 제공하겠다는 목표 달성에 중요한 이정표를 세웠습니다.
(출처: Maritech Holdings Limited, 보도자료, 2025년 6월)
- 윈드워드(Windward)가 획기적인 핵심 해양 인프라 보호(Critical Maritime Infrastructure Protection) 솔루션을 공개했습니다. AI 기반 혁신 기술인 이 솔루션은 케이블, 파이프라인, 굴착 장치 등 전 세계 주요 해양 인프라를 증가하는 보안 위협으로부터 보호하도록 특별히 설계되었습니다.
(출처: Windward, 보도자료, 2025년 2월)
해양 분석 시장 보고서 범위 및 제공물
"해양 분석 시장 규모 및 예측(2021~2031)"은 아래 언급된 분야를 포괄하는 시장에 대한 자세한 분석을 제공합니다.
- 범위에 포함된 모든 주요 시장 부문에 대한 글로벌, 지역 및 국가 수준의 해양 분석 시장 규모 및 예측
- 해양 분석 시장 동향 및 동인, 제약, 주요 기회와 같은 시장 역학
- 자세한 PEST 및 SWOT 분석
- 주요 시장 동향, 글로벌 및 지역 프레임워크, 주요 참여자, 규정 및 최근 시장 개발을 포괄하는 해양 분석 시장 분석
- 시장 집중도, 히트맵 분석, 주요 업체 및 해양 분석 시장의 최근 개발 사항을 다루는 산업 환경 및 경쟁 분석
- 자세한 회사 프로필

안키타는 기술, 미디어, 정보통신기술(ICT), 전자 및 반도체 분야에서 8년 이상의 경력을 보유한 역동적인 시장 조사 및 컨설팅 전문가입니다. Microsoft, Oracle, NEC Corporation, SAP, KPMG, Expeditors International 등 글로벌 고객을 대상으로 100건 이상의 컨설팅 및 조사 업무를 성공적으로 이끌고 수행했습니다. 그녀의 핵심 역량은 시장 평가, 데이터 분석, 예측, 전략 수립, 경쟁 정보 분석, 보고서 작성입니다.
안키타는 사전 판매 제안서 설계 및 고객 논의부터 실행 가능한 인사이트의 사후 판매까지 전체 프로젝트 주기를 능숙하게 처리합니다. 또한, 여러 부서의 팀을 관리하고, 복잡한 조사 모듈을 구성하며, 고객별 비즈니스 목표에 맞춰 솔루션을 조정하는 데 능숙합니다. 뛰어난 의사소통, 리더십, 그리고 프레젠테이션 능력을 바탕으로 빠르게 변화하는 시장 환경에서도 가치 중심의 성과를 꾸준히 달성해 왔습니다.
- 과거 분석(2년), 기준 연도, CAGR을 포함한 예측(7년)
- PEST 및 SWOT 분석
- 시장 규모 가치/거래량 - 글로벌, 지역, 국가
- 산업 및 경쟁 환경
- Excel 데이터세트
사용 후기
Insight Partners의 SCADA 시스템 시장 보고서는 포괄적이며, 현재 동향과 미래 전망에 대한 귀중한 통찰력을 제공합니다. 팀은 매우 전문적이고, 신속하게 대응하며, 처음부터 끝까지 지원해 주었습니다. 저희는 매우 만족하며 Insight Partners의 서비스를 적극 추천합니다.
란 케뎀 파트너, Reali Technologies LTDs아주 구체적인 소프트웨어 시장에 대한 보고서를 요청했는데, 팀에서 며칠 만에 보고서를 작성해 주셨습니다. 정보는 매우 관련성이 높고 잘 정리되어 있었습니다. 그 후 보고서에 몇 가지 수정과 추가 사항을 요청했습니다. 팀원들의 응답도 매우 빨랐고, 일주일도 채 되지 않아 최종 보고서를 받았습니다.
장-에르브 젠 의장, 퓨처 애널리티카The Insight Partners와 함께 중요한 시장 조사 및 예측 작업을 진행했습니다. Insight Partners는 기회와 위험에 대한 명확한 통찰력을 제공하여 계획을 세우는 데 큰 도움이 되었습니다. The Insight Partners의 조사는 사용하기 쉬웠고, 탄탄한 데이터를 기반으로 했습니다. 덕분에 현명하고 자신 있는 결정을 내릴 수 있었습니다. The Insight Partners를 강력 추천합니다.
피유시 나그팔 수석 부사장, 하이빔 글로벌Insight Partners는 탄탄한 분야 전문성을 바탕으로 통찰력 있고 체계적인 시장 조사를 제공했습니다. Insight Partners 팀은 처음부터 끝까지 전문적이고 신속하게 대응했습니다. 사용자 친화적인 웹사이트 덕분에 업계 보고서에 쉽게 접근할 수 있었습니다. 신뢰할 수 있고 고품질의 조사 서비스를 원하신다면 Insight Partners를 강력 추천합니다.
아다치 유키히코 대표이사, 딥블루 주식회사The Insight Partners에서 시장 보고서를 구매한 것은 이번이 처음입니다. 처음에는 확신이 없었지만, 웹사이트를 방문하고 나서 위험을 감수하고 시장 보고서를 구매하는 것이 더 편하다는 것을 알게 되었습니다. 보고서의 품질과 고객 서비스에 매우 만족합니다. 처음 보고서를 보고 몇 가지 질문과 의견이 있었지만, 분석가와 이메일로 몇 차례 대화를 나눈 후, 전략 기획 과정에 참고할 수 있는 보고서를 확보했다고 생각합니다. 시간을 내어 긍정적인 경험을 선사해 주셔서 정말 감사합니다. 다른 사람들에게도 귀사의 서비스를 적극 추천할 것이며, 추가적인 시장 데이터가 필요할 때면 가장 먼저 귀사에 연락하겠습니다.
존 스즈키 사장 겸 최고 경영자, 이사회 이사, BK 테크놀로지스나이지리아 감염성 질환 IVD 시장 관련 정보 요청에 응해 주신 귀사의 지원과 전문성에 감사드립니다. 귀사의 인내심과 지도, 그리고 할인 혜택을 기꺼이 제공해 주셔서 결국 계약을 성사시킬 수 있었습니다. 첫 만남을 통해 귀사가 저에게 심어주신 좋은 인상을 바탕으로 앞으로도 The Insight Partners와 함께할 수 있기를 기대합니다.
치지오케 박사 오니아 전무이사, 파인크레스트 헬스케어 유한회사구매 이유
- 정보에 기반한 의사 결정
- 시장 역학 이해
- 경쟁 분석
- 고객 인사이트
- 시장 예측
- 위험 완화
- 전략 기획
- 투자 타당성 분석
- 신흥 시장 파악
- 마케팅 전략 강화
- 운영 효율성 향상
- 규제 동향에 발맞춰 대응


 무료 샘플 받기 - 해양 분석 시장