미터 데이터 관리 시스템 시장 개요, 성장, 추세, 분석, 연구 보고서(2025-2031)
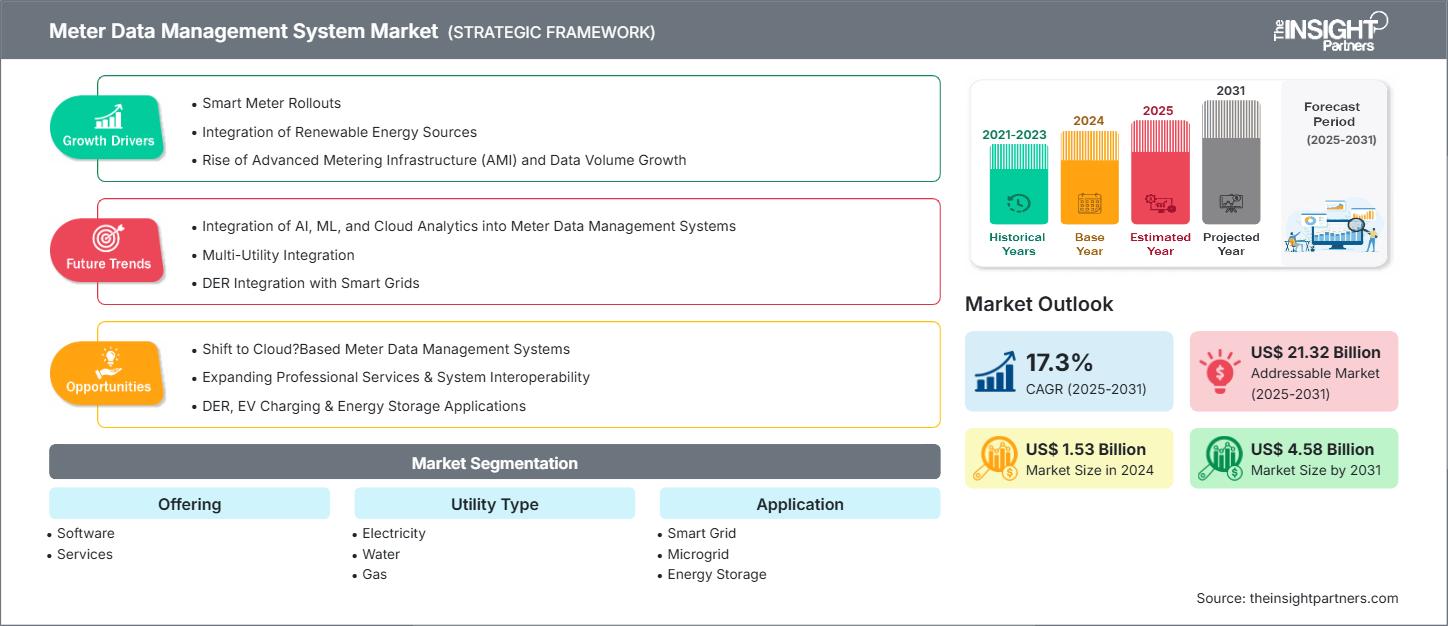
이전 데이터 : 2021-2023 | 기준 연도 : 2024 | 예측 기간 : 2025-2031미터 데이터 관리 시스템 시장 규모 및 예측(2021-2031), 글로벌 및 지역별 점유율, 추세 및 성장 기회 분석 보고서 범위: 제공(소프트웨어 및 서비스), 유틸리티 유형(전기, 수도 및 가스), 애플리케이션(스마트 그리드, 마이크로그리드, 에너지 저장, EV 충전 및 기타), 최종 사용자(주거, 상업 및 산업), 지역(북미, 유럽, 아시아 태평양, 중동 및 아프리카, 남미 및 중미)별
- 상태 : 게시됨
- 보고서 코드 : TIPRE00006169
- 범주 : 기술, 미디어 및 통신
- 페이지 수 : 264
- 사용 가능한 보고서 형식 :


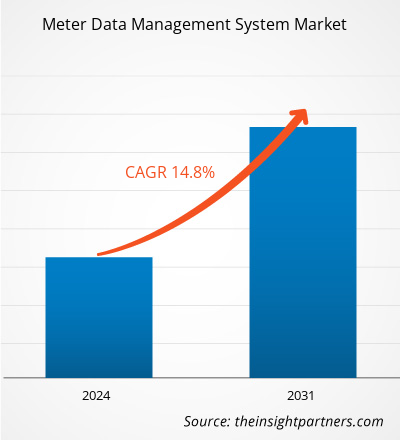
미터 데이터 관리 시스템 시장 규모는 2024년 15억 3천만 달러에서 2031년 45억 8천만 달러로 성장할 것으로 예상됩니다. 이 시장은 2025년부터 2031년까지 17.3%의 CAGR을 기록할 것으로 예상됩니다.
미터 데이터 관리 시스템 시장 분석
글로벌 계량기 데이터 관리 시스템 시장 성장의 이면에는 스마트 미터의 광범위한 도입, 청정 에너지원의 통합, 첨단 계량 인프라(AMI)의 부상, 데이터량 증가, 그리고 정부 정책 등 몇 가지 주요 요인이 있습니다. 클라우드 기반 계량기 데이터 관리 솔루션으로의 전환과 에너지 지속가능성 확보를 위한 지속적인 노력에 힘입어 시장은 예측 기간 동안 지속적인 성장을 보일 것으로 예상됩니다. 시장에 영향을 미치는 중요한 추세 중 하나는 AI 기반 계량기 데이터 관리 솔루션의 성장입니다. 하지만 계량 데이터 변동과 같은 문제는 시장 성장을 둔화시킬 수 있습니다.
미터 데이터 관리 시스템 시장 개요
계량기 데이터 관리 시스템(MDMS)은 전기, 가스, 수도, 열에너지 분야의 공공 서비스 기업에 필수적인 시스템입니다. 이러한 시스템은 고객 사업장에서 발생하는 계량기 데이터를 수집, 검증 및 관리할 수 있도록 지원합니다. 수집된 데이터는 요금 청구, 고객 서비스, 소비량 예측, 운영 모니터링(예: 정전 감지 및 손실 분석), 재무 보고 등 다양한 활동의 기반이 됩니다. 또한, 공공 서비스 산업 외에도 에너지 서비스 회사는 감사 및 에너지 절약 프로그램을 위해, 에너지 관리 회사는 소비량 보고 및 분석을 위해, 독립 에너지 생산업체와 지역 에너지 공급업체는 생산 계획 및 엔지니어링을 위해, 그리고 상업 및 산업 기업은 내부 회계 및 재무 관리를 위해 계량기 데이터 관리 시스템 솔루션을 사용합니다. 지자체와 정부 기관 또한 공공 인프라 프로그램 및 규정 준수를 위해 이러한 시스템을 활용하고 있습니다.
이 보고서의 일부 또는 국가 수준 분석, Excel 데이터 팩을 포함하여 모든 보고서에 대한 사용자 정의를 무료로 받을 수 있으며, 신생 기업 및 대학을 위한 훌륭한 혜택과 할인도 이용할 수 있습니다.
미터 데이터 관리 시스템 시장: 전략적 통찰력
-
이 보고서에서 주요 시장 동향을 알아보세요.이 무료 샘플에는 시장 동향부터 추정치 및 예측까지 다양한 데이터 분석이 포함됩니다.
미터 데이터 관리 시스템 시장 동인 및 기회
시장 동인:
-
스마트 미터 도입:
미터 데이터 관리 시스템 시장의 주요 원인 중 하나는 전 세계적으로 스마트 미터가 대거 도입되고 있다는 것입니다. 이는 정부가 규제 요구와 인프라 현대화에 대응하여 시행하고 있는 것입니다. -
재생 에너지원의 통합:
계량기 데이터 관리 시스템(MDM) 플랫폼은 현재 에너지 분야에서 점점 더 필수불가결한 요소가 되고 있습니다. 기본적으로, 이러한 플랫폼은 스마트 계량 인프라(AMI) 측정값의 4차원(x, y, z 및 시간) 데이터를 수집, 검증, 집계 및 분석하는 지리정보시스템(GIS) 매핑 소프트웨어 역할을 합니다. -
고급 계량 인프라(AMI)의 부상과 데이터 양 증가:
세계 미터 데이터 관리 시스템 시장을 형성하는 주요 요인 중 하나는 고급 미터링 인프라(AMI)의 빠른 구축입니다.AMI).
시장 기회:
-
클라우드 기반 배포 확장:
클라우드 인프라 사용이 증가함에 따라 유틸리티를 위한 확장 가능하고 저렴한 MDMS 솔루션이 제공되고 있으며, 이는 주로 클라우드 기반 배포에 대한 필요성에 의해 주도되고 있습니다. -
전문 서비스 및 시스템 상호 운용성 확장:
MDMS 인프라의 복잡성이 증가함에 따라 컨설팅, 통합, 유지관리 서비스에 대한 수요가 증가하고 있으며, 특히 고객 정보 시스템 통합과 DER 관리에 대한 수요가 증가하고 있습니다. -
충전 및 에너지 저장 애플리케이션:
마이크로그리드, 전기 자동차 충전, 에너지 저장의 등장으로 특수 MDMS 모듈과 맞춤형 솔루션을 개발할 수 있는 새로운 길이 열렸습니다.
미터 데이터 관리 시스템 시장 보고서 세분화 분석
계량기 데이터 관리 시스템 시장은 작동 방식, 성장 잠재력, 그리고 최신 동향을 더욱 명확하게 보여주기 위해 여러 부문으로 구분됩니다. 대부분의 업계 보고서에서 사용되는 표준 세분화 방식은 다음과 같습니다.
제공을 통해:
-
소프트웨어:
미터 데이터 관리 시스템의 소프트웨어 구성 요소는 스마트 유틸리티가 스마트 미터에서 생성되는 방대한 양의 데이터를 수집, 저장, 처리 및 분석할 수 있도록 하는 주요 핵심 요소입니다. -
서비스:
계량기 데이터 관리 시스템 관련 서비스는 성공적인 구축 및 수명 주기 관리를 위해 필요한 다양한 서비스를 포함합니다. 여기에는 요구 사항 분석, 컨설팅, 아키텍처 설계와 같은 구축 전 활동과 시스템 통합, 테스트 및 구축이 포함됩니다.
유틸리티 유형별:
-
전기:
전기 회사는 주로 스마트 전기 계량기의 대대적인 출시로 인해 계량기 데이터 관리 시스템 시장을 장악하고 있습니다. -
물:
수도 사업 부문의 계량기 데이터 관리 시스템(MDMS)이 확장되어 수도 사업체가 물 부족, 누수, 무수익 수도(NRW) 등 다양한 문제에 직면한 기존 인프라를 업데이트할 수 있게 되었습니다. -
가스:
가스 부문의 MDMS는 안전, 정확한 청구 및 규제 기관의 요건 충족에 도움을 줍니다. 스마트 가스 계량기는 시스템의 안전하고 효율적인 운영에 필요한 소비량 데이터, 유량 및 압력 수준을 제공합니다.
응용 프로그램별:
-
스마트 그리드:
스마트 그리드 애플리케이션 부문은 미터 데이터 관리 시스템의 가장 기본적이고 성숙한 사용 사례입니다. -
마이크로그리드:
미크로그리드는 1차 전력망과 독립적으로 또는 연계하여 운영되는 지역화된 전력망입니다. -
에너지 저장:
미터 데이터 관리 시스템은 배터리 충전/방전 주기, 에너지 처리량, 건강 상태(SoH) 및 그리드 신호 통합을 정확하게 추적하는 데 도움이 됩니다. -
EV 충전:
전기 자동차(EV) 충전은 전력망 운영자에게 새로운 과제와 기회를 제공합니다. -
기타:
건물 에너지 관리, 지역 난방, P2P 에너지 거래, 에너지 효율 프로그램 등의 분야에서 미터 데이터 관리 시스템의 다른 응용 분야가 등장하고 있습니다.
최종 사용자 산업별:
- 주거용
- 광고
- 산업
각 부문에는 구체적인 계량기 데이터 관리 시스템 요구 사항이 있으며, 이는 데이터 관리 및 분석에 영향을 미칩니다.
지리별:
- 북아메리카
- 유럽
- 아시아 태평양
- 남미 및 중미
- 중동 및 아프리카
아시아 태평양 지역의 계량기 데이터 관리 시스템 시장은 가장 빠른 성장을 보일 것으로 예상됩니다. 재생 에너지원의 통합과 첨단 계량 기술의 발전이 시장을 주도할 것으로 예상됩니다.
미터 데이터 관리 시스템 시장 지역별 통찰력
The Insight Partners의 분석가들은 예측 기간 동안 계량 데이터 관리 시스템 시장에 영향을 미치는 지역별 동향과 요인을 면밀히 분석했습니다. 이 섹션에서는 북미, 유럽, 아시아 태평양, 중동 및 아프리카, 그리고 중남미 지역의 계량 데이터 관리 시스템 시장 부문 및 지역별 현황도 살펴봅니다.
미터 데이터 관리 시스템 시장 보고서 범위
| 보고서 속성 | 세부 |
|---|---|
| 2024년 시장 규모 | 15억 3천만 달러 |
| 2031년까지 시장 규모 | 45억 8천만 달러 |
| 글로벌 CAGR(2025~2031년) | 17.3% |
| 역사적 데이터 | 2021-2023 |
| 예측 기간 | 2025-2031 |
| 다루는 세그먼트 |
제공함으로써
|
| 포함된 지역 및 국가 |
북아메리카
|
| 시장 선도 기업 및 주요 회사 프로필 |
|
미터 데이터 관리 시스템 시장 참여자 밀도: 비즈니스 역학에 미치는 영향 이해
계량 데이터 관리 시스템 시장은 소비자 선호도 변화, 기술 발전, 그리고 제품 이점에 대한 인식 제고 등의 요인으로 인한 최종 사용자 수요 증가에 힘입어 빠르게 성장하고 있습니다. 수요 증가에 따라 기업들은 제품 및 서비스 확장, 소비자 니즈 충족을 위한 혁신, 그리고 새로운 트렌드를 적극 활용하며 시장 성장을 더욱 가속화하고 있습니다.
- 미터 데이터 관리 시스템 시장의 주요 기업 개요를 알아보세요
지역별 미터 데이터 관리 시스템 시장 점유율 분석
아시아 태평양 시장은 향후 몇 년 동안 가장 빠르게 성장할 것으로 예상됩니다. 중남미와 중동 및 아프리카의 신흥 시장 또한 계량기 데이터 관리 시스템 공급업체가 확장할 수 있는 많은 미개척 기회를 보유하고 있습니다.
계량기 데이터 관리 시스템 시장은 지역별로 차이가 있습니다. 스마트 미터 도입, 재생 에너지원 사용, 첨단 계량 인프라(AMI) 및 데이터량 증가 등의 요인이 지역별 성장 패턴에 영향을 미칩니다. 다음은 지역별 시장 점유율과 추세를 요약한 것입니다.
1. 북미
-
시장 점유율:
조기 도입 및 유틸리티 현대화로 인해 지배적인 점유율을 확보했습니다. -
주요 동인:
- 스마트 그리드 투자
- 연방 및 주 차원의 에너지 효율 의무
- 스마트 미터의 높은 보급률
-
트렌드:
실시간 그리드 밸런싱을 위한 분산 에너지 자원 관리 시스템(DERMS)과 MDMS 통합
2. 유럽
-
시장 점유율:
엄격한 에너지 규정과 지속 가능성 목표에 힘입어 상당한 점유율 확보 -
주요 동인:
- 에너지 효율에 관한 EU 지침
- 재생 에너지 통합
- 국경 간 에너지 데이터 플랫폼 지원
-
트렌드:
EU의 디지털 전환 프레임워크에 맞춰 클라우드 기반 MDMS의 성장
3. 아시아 태평양
-
시장 점유율:
실질적인 스마트 그리드 구축 이니셔티브를 통해 가장 빠르게 성장하는 지역 -
주요 동인:
- 정부 주도 디지털 유틸리티 프로그램
- 도시화와 스마트 시티 개발
- 그리드 안정성 문제
-
트렌드:
대량 데이터 관리 및 수요 예측을 위한 AI 기반 MDMS의 급증
4. 남미 및 중미
-
시장 점유율:
공공 서비스 현대화에 대한 투자가 증가하는 신흥 시장 -
주요 동인:
- 노후화된 인프라 업그레이드
- 원격 지역의 전기화
- 지역 재생 가능 에너지 프로젝트
-
트렌드:
점진적인 스마트 미터 도입을 수용하기 위한 모듈식 MDMS 플랫폼 선호
5. 중동 및 아프리카
-
시장 점유율:
강력한 정부 지원으로 성장하는 시장 -
주요 동인:
- 국가 에너지 다변화 계획
- 물-에너지 연계 프로젝트
- 스마트 시티와 공공 서비스 개혁
-
트렌드:
기존 에너지원과 재생 에너지원을 결합한 하이브리드 그리드에 MDMS 구축
미터 데이터 관리 시스템 시장 참여자 밀도: 비즈니스 역학에 미치는 영향 이해
높은 시장 밀도와 경쟁
Oracle, Siemens, Itron, Landis+Gyr, Schneider Electric 등 주요 벤더들이 참여하면서 경쟁이 심화되고 있습니다. Kamstrup(유럽), Aclara(북미), Wasion Group(아시아)과 같은 지역 및 틈새시장 업체들도 시장 경쟁을 심화시키고 있습니다.
이러한 경쟁적인 환경에서 공급업체는 다음과 같은 방법으로 차별화를 꾀합니다.
- 스마트 그리드 및 재생 에너지 시스템과의 통합
- 확장 가능한 클라우드 기반 MDMS 플랫폼
- 부하 예측 및 오류 감지를 위한 AI 기반 데이터 분석
- 다중 공급업체 미터 생태계와의 상호 운용성
기회와 전략적 움직임
- 전국적인 스마트 미터 도입을 위한 공공 서비스 제공업체 및 정부와의 협력
- 예측 유지 관리 및 소비 분석을 강화하기 위한 AI/ML 내장
미터 데이터 관리 시스템 시장에서 운영되는 주요 회사는 다음과 같습니다.
- 아이트론 주식회사 – 미국
- Oracle Corp – 미국
- 젠트랙 그룹 – 뉴질랜드
- Fluentgrid Limited – 인도
- 지멘스 AG – 독일
- Landis+Gyr Group AG – 스위스
- 허니웰 인터내셔널 주식회사 – 미국
- 허벨 주식회사 – 미국
- ABB Ltd – 스위스
- AVEVA 그룹 Plc – 영국
면책 조항: 위에 나열된 회사는 특정 순서에 따라 순위가 매겨지지 않았습니다.
연구 과정에서 분석된 다른 회사:
- 쿠쿨루스 조노스
- 스마트플렉스
- 코넥소 인사이트
- ATLAS 에너지 모니터링 시스템
- PI 시스템(AVEVA)
- Net@Suite(엔지니어링 Ingegneria Informatica)
- 테라노바 TAMM MDM
- 페란티 MECOMS
- 에너지웍스
- 수액
- 메디데이터 솔루션
- 라딕스 IoT
- 에너지캡
- 허니웰 EI서버
- 이튼
미터 데이터 관리 시스템 시장 뉴스 및 최근 개발
-
Esyasoft는 Adani Energy Solutions와 합작법인을 설립하여
인도 및 기타 국가에서 스마트 계량 프로젝트를 시행한다고 발표했습니다. 이번 파트너십을 통해 Adani는 Esyasoft의 스마트 계량 솔루션 부문 지분 49%를 인수하게 됩니다. -
Landis+Gyr은 MDUS 인증 완료를 발표했습니다.
Landis+Gyr은 Landis+Gyr MDMS 플랫폼에 대한 MDUS 인증을 완료했다고 발표했습니다. 이 인증을 갱신함으로써 MDUS 통합 서비스를 사용하는 공공 서비스 고객은 간격 및 시계열 청구를 위한 새로운 기능을 이용할 수 있습니다. Landis+Gyr의 MDUS(Meter Data Unification and Synchronization)는 스마트 미터링 환경을 공공 서비스 백오피스 시스템에 연결하고 동기화하여 엔드 투 엔드 비즈니스 프로세스를 지원하는 독보적인 솔루션입니다.
미터 데이터 관리 시스템 시장 보고서 범위 및 제공물
"미터 데이터 관리 시스템 시장 규모 및 예측(2021~2031)" 보고서는 아래 영역을 포괄하여 시장에 대한 자세한 분석을 제공합니다.
- 범위에 포함된 모든 주요 시장 부문에 대한 글로벌, 지역 및 국가 수준의 미터 데이터 관리 시스템 시장 규모 및 예측
- 운전자, 제약 및 주요 기회와 같은 시장 역학뿐만 아니라 미터 데이터 관리 시스템 시장 동향
- 자세한 PEST 및 SWOT 분석
- 주요 시장 동향, 글로벌 및 지역 프레임워크, 주요 참여자, 규정 및 최근 시장 개발을 포괄하는 미터 데이터 관리 시스템 시장 분석
- 시장 집중도, 히트맵 분석, 주요 업체 및 미터 데이터 관리 시스템 시장의 최근 개발 사항을 다루는 산업 환경 및 경쟁 분석
- 자세한 회사 프로필

안키타는 기술, 미디어, 정보통신기술(ICT), 전자 및 반도체 분야에서 8년 이상의 경력을 보유한 역동적인 시장 조사 및 컨설팅 전문가입니다. Microsoft, Oracle, NEC Corporation, SAP, KPMG, Expeditors International 등 글로벌 고객을 대상으로 100건 이상의 컨설팅 및 조사 업무를 성공적으로 이끌고 수행했습니다. 그녀의 핵심 역량은 시장 평가, 데이터 분석, 예측, 전략 수립, 경쟁 정보 분석, 보고서 작성입니다.
안키타는 사전 판매 제안서 설계 및 고객 논의부터 실행 가능한 인사이트의 사후 판매까지 전체 프로젝트 주기를 능숙하게 처리합니다. 또한, 여러 부서의 팀을 관리하고, 복잡한 조사 모듈을 구성하며, 고객별 비즈니스 목표에 맞춰 솔루션을 조정하는 데 능숙합니다. 뛰어난 의사소통, 리더십, 그리고 프레젠테이션 능력을 바탕으로 빠르게 변화하는 시장 환경에서도 가치 중심의 성과를 꾸준히 달성해 왔습니다.
- 과거 분석(2년), 기준 연도, CAGR을 포함한 예측(7년)
- PEST 및 SWOT 분석
- 시장 규모 가치/거래량 - 글로벌, 지역, 국가
- 산업 및 경쟁 환경
- Excel 데이터세트
사용 후기
Insight Partners의 SCADA 시스템 시장 보고서는 포괄적이며, 현재 동향과 미래 전망에 대한 귀중한 통찰력을 제공합니다. 팀은 매우 전문적이고, 신속하게 대응하며, 처음부터 끝까지 지원해 주었습니다. 저희는 매우 만족하며 Insight Partners의 서비스를 적극 추천합니다.
란 케뎀 파트너, Reali Technologies LTDs아주 구체적인 소프트웨어 시장에 대한 보고서를 요청했는데, 팀에서 며칠 만에 보고서를 작성해 주셨습니다. 정보는 매우 관련성이 높고 잘 정리되어 있었습니다. 그 후 보고서에 몇 가지 수정과 추가 사항을 요청했습니다. 팀원들의 응답도 매우 빨랐고, 일주일도 채 되지 않아 최종 보고서를 받았습니다.
장-에르브 젠 의장, 퓨처 애널리티카The Insight Partners와 함께 중요한 시장 조사 및 예측 작업을 진행했습니다. Insight Partners는 기회와 위험에 대한 명확한 통찰력을 제공하여 계획을 세우는 데 큰 도움이 되었습니다. The Insight Partners의 조사는 사용하기 쉬웠고, 탄탄한 데이터를 기반으로 했습니다. 덕분에 현명하고 자신 있는 결정을 내릴 수 있었습니다. The Insight Partners를 강력 추천합니다.
피유시 나그팔 수석 부사장, 하이빔 글로벌Insight Partners는 탄탄한 분야 전문성을 바탕으로 통찰력 있고 체계적인 시장 조사를 제공했습니다. Insight Partners 팀은 처음부터 끝까지 전문적이고 신속하게 대응했습니다. 사용자 친화적인 웹사이트 덕분에 업계 보고서에 쉽게 접근할 수 있었습니다. 신뢰할 수 있고 고품질의 조사 서비스를 원하신다면 Insight Partners를 강력 추천합니다.
아다치 유키히코 대표이사, 딥블루 주식회사The Insight Partners에서 시장 보고서를 구매한 것은 이번이 처음입니다. 처음에는 확신이 없었지만, 웹사이트를 방문하고 나서 위험을 감수하고 시장 보고서를 구매하는 것이 더 편하다는 것을 알게 되었습니다. 보고서의 품질과 고객 서비스에 매우 만족합니다. 처음 보고서를 보고 몇 가지 질문과 의견이 있었지만, 분석가와 이메일로 몇 차례 대화를 나눈 후, 전략 기획 과정에 참고할 수 있는 보고서를 확보했다고 생각합니다. 시간을 내어 긍정적인 경험을 선사해 주셔서 정말 감사합니다. 다른 사람들에게도 귀사의 서비스를 적극 추천할 것이며, 추가적인 시장 데이터가 필요할 때면 가장 먼저 귀사에 연락하겠습니다.
존 스즈키 사장 겸 최고 경영자, 이사회 이사, BK 테크놀로지스나이지리아 감염성 질환 IVD 시장 관련 정보 요청에 응해 주신 귀사의 지원과 전문성에 감사드립니다. 귀사의 인내심과 지도, 그리고 할인 혜택을 기꺼이 제공해 주셔서 결국 계약을 성사시킬 수 있었습니다. 첫 만남을 통해 귀사가 저에게 심어주신 좋은 인상을 바탕으로 앞으로도 The Insight Partners와 함께할 수 있기를 기대합니다.
치지오케 박사 오니아 전무이사, 파인크레스트 헬스케어 유한회사구매 이유
- 정보에 기반한 의사 결정
- 시장 역학 이해
- 경쟁 분석
- 고객 인사이트
- 시장 예측
- 위험 완화
- 전략 기획
- 투자 타당성 분석
- 신흥 시장 파악
- 마케팅 전략 강화
- 운영 효율성 향상
- 규제 동향에 발맞춰 대응


 무료 샘플 받기 - 미터 데이터 관리 시스템 시장