
Electroretinography Market Segments and Growth by 2027
Electroretinography Market to 2027 - Industry Analysis and Forecasts By Product (Fixed Electroretinography and Portable Electroretinography), Application (Clinical and Research), and Geography
- Status : Published
- Report Code : TIPRE00003514
- Category : Life Sciences
- No. of Pages : 125
- Available Report Formats :


- Last update date : June 13, 2024

2018 Market Size
US$ 35.79 Mn
Base year value
2027 Forecast
US$ 62.72 Mn
Projected by 2027
CAGR 2019-2027
6.7 %
Growth rate
Addressable Market
US$ 451.75 Mn
(2019-2027)
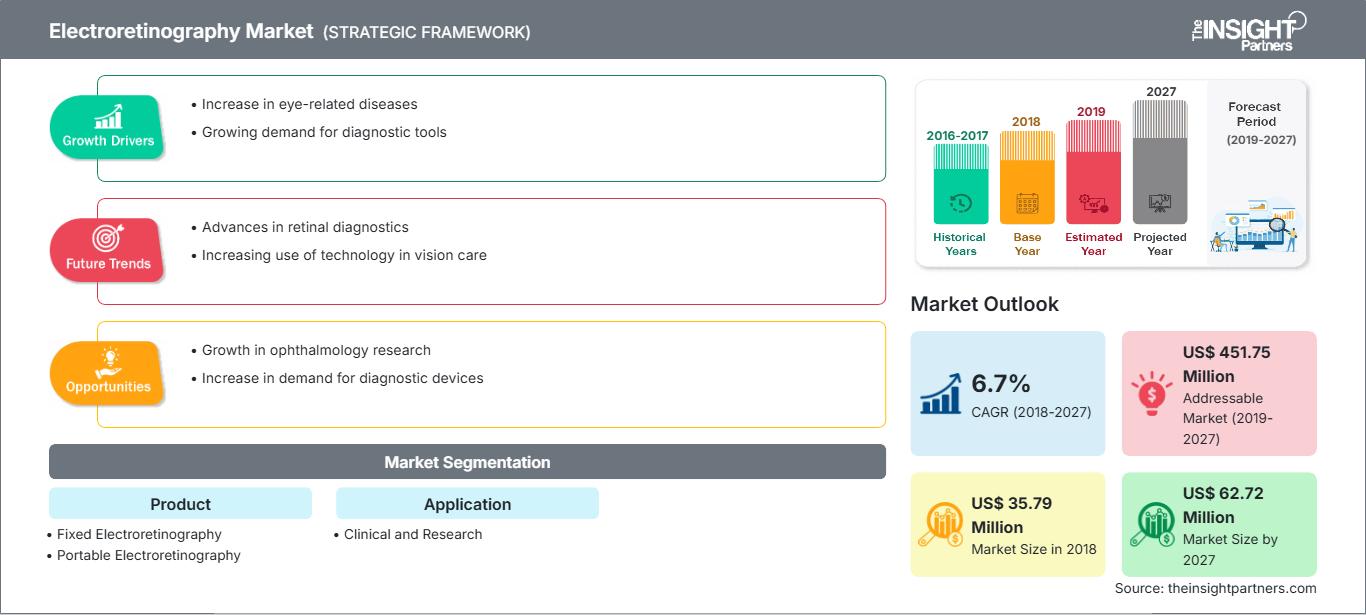
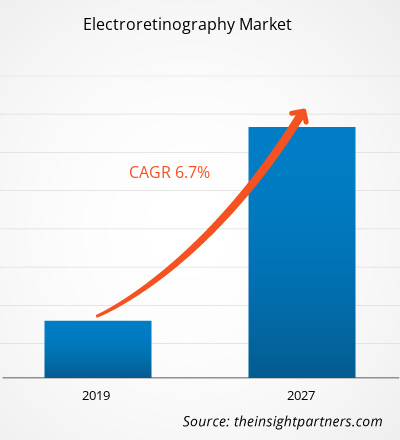
The electroretinography market was valued at US$ 35.79 million in 2018 and it is projected to reach US$ 62.72 million in 2027; it is expected to grow at a CAGR of 6.7% from 2019 to 2027.
Electroretinography (ERG) is a diagnostic test used to measure the electrical response of the light sensitive cells such as the cones and the rods present in the eyes. ERG is used for detecting eye disorders such as, retinitis pigmentosa, macular degeneration, retinoblastoma, glaucoma as well as diabetic retinopathy. Compared to the other methods of eye examination, ERG offers better results as well as causes less discomfort to the patients, hence is preferred widely for the diagnosis as well as treatment of various eye disorders. The growth of the global electroretinography market is attributed to the rising prevalence of glaucoma among individuals, increasing cases of eye disorders in developed economies and growing geriatric population worldwide. However, risks associated with the electroretinography is the major factor hindering the market growth.
The global electroretinography market is expected to witness substantial growth post-pandemic. The COVID-19 has affected economies and industries in various countries due to lockdowns, travel bans, and business shutdowns. The COVID-19 crisis has overburdened public health systems in many countries and highlighted the strong need for sustainable investment in health systems. As the COVID-19 pandemic progresses, the healthcare industry is expected to see a drop in growth. The life sciences segment thrives due to increased demand for invitro diagnostic products and rising research and development activities worldwide. However, the medical technologies and imaging segment is witnessing drop in sales due to a smaller number of surgeries being carried out and delayed or prolonged equipment procurement. Additionally, virtual consultations by healthcare professionals are expected to become the mainstream care delivery model post-pandemic. With telehealth transforming care delivery, digital health will continue to thrive in coming years. In addition, disrupted clinical trials and the subsequent delay in drug launches is also expected to pave the way for entirely virtual trials in the future. New technologies such as mRNA is expected to emerge and shift the pharmaceutical industry and market is also expected to witness more vertical integration and joint ventures in coming years.
Market Assessment and Insights
- Global market for Electroretinography was valued at US$ 35.79 Million in 2018
- Annual market size is expected to reach US$ 62.72 Million by 2027
- Total addressable market (TAM) during 2019-2027 is projected to reach approximately US$ 451.75 Million
- Market is anticipated to register a CAGR of 6.7% during the forecast period
- The United States represents a key market, supported by Increase in eye-related diseases, Growing demand for diagnostic tools, as well as evolving industry dynamics
- Market analysis covers North America, Europe, Asia-Pacific, South and Central America, Middle East and Africa, with growth evaluated across the forecast period
- Market opportunities such as Growth in ophthalmology research, Increase in demand for diagnostic devices are expected to influence market dynamics and addressable market
- Report profiles industry participants, including LKC Technologies, Inc, Diagnosys LLC, Electro-Diagnostic Imaging, Inc., Diopsys, Inc., Roland Consult Stasche & Finger GmbH, Metrovision, Costruzione Strumenti Oftalmici, Konan Medical USA, Inc., Welch Allyn, while analyzing competitive strategies and innovation developments
-
Source: The Insight Partners' analysis based on proprietary research, government publications, company annual reports, investor presentations, industry databases, and expert interviews.
● REPORT CUSTOMIZATION
Tailor This Report To Align With Your Specific Business Requirements
This report can be customized to align precisely with your business objectives, scope, and target markets. Customization options include tailored segmentation, geography, competitive analysis, and strategic insights to support informed decision-making.
Customize This Report →WHAT YOU CAN ADJUST
- ● Segmentations
- ● Geography
- ● Competitive Analysis
- ● Language Preferences
Electroretinography Market: Strategic Insights
-
Get Top Key Market Trends of this report.This FREE sample will include data analysis, ranging from market trends to estimates and forecasts.
Market Insights
Rising Prevalence of Glaucoma Among Individuals to Drive Global Electroretinography Market Growth
Glaucoma is a disease that damages the eye’s optic nerve. The condition occurs when a layer of fluid fills up on the outer side of the eye, creating a pressure and hence leading to damage to optic nerves. Glaucoma often leads to vision loss, eventually causing blindness. The World Health Organization estimates that 4.5 million people worldwide are blind due to glaucoma. In the United States, around 120,000 are blind from glaucoma, accounting for 9% to 12% of all cases of blindness. The population mostly susceptible to vision loss due to glaucoma includes the population aged above 60 years. However, if it is detected and treated at an early stage, one can avoid vision loss. The worldwide age- standardised prevalence of glaucoma in the population aged 40 years and above is estimated to be around 3·5%.
Glaucoma are basically of two types: open-angle glaucoma and closed-angle glaucoma. Open-angle glaucoma is the most common form and is denoted by various risk factors such as, sub-Saharan African ethnic origin, elevated intraocular pressure, older age, positive family history, and high myopia. Whereas, the risk factors for closed-angle glaucoma include, East Asian ethnic origin, hyperopia and older age.
As per Glaucoma Research Foundation, currently there are around 3 million people with glaucoma in the United States. The number is expected to reach up to 4.2 million by 2030, with an increase of almost 58 percent, as per the forecasts given by, The National Eye Institute. Moreover, among African American and Latino populations, glaucoma is more prevalent, being 6 to 8 times more common in African Americans than in the Caucasian population.
Pattern electroretinography (PERG) is considered to be an efficient method for the early detection and treatment of glaucoma. PERG offers a few advantages over other tests that are routinely use to diagnose and monitor glaucoma patients. Most particularly, PERG is able to detect functional abnormality very early in disease—in some cases possibly as much as eight years earlier than our other tests. PERG tests are sensitive in nature and hence allow early detection of abnormalities, hence timely avoiding the death of retinal ganglion cells (RGC). Hence, the rise in the cases of blindness owing to glaucoma and the ability of PERG to enable better detection is expected to significantly to drive the market during the coming years.
Product -Based Insights
In terms of product, the global electroretinography market is segmented into fixed electroretinography and portable electroretinography. In 2018, the fixed electroretinography segment held largest share of the market. However, the portable electroretinography segment is estimated to register the highest CAGR during the forecast period.
Application-Based Insights
Based on application, the global electroretinography market is segmented into clinical and research. The clinical segment held the largest market share in 2018. Also, the same segment is estimated to grow at the highest CAGR during the forecast period.
The global electroretinography market players are adopting the product launch and expansion strategies to cater to changing customer demands worldwide, which also allows them to maintain their brand name globally.
Electroretinography Market Report Scope
| Report Attribute | Details |
|---|---|
| Market size in 2018 | US$ 35.79 Million |
| Market Size by 2027 | US$ 62.72 Million |
| Global CAGR (2018 - 2027) | 6.7% |
| Historical Data | 2016-2017 |
| Forecast period | 2019-2027 |
| Segments Covered |
By Product
|
| Regions and Countries Covered |
North America
|
| Market leaders and key company profiles |
|
Electroretinography Market Players Density: Understanding Its Impact on Business Dynamics
The Electroretinography Market is growing rapidly, driven by increasing end-user demand due to factors such as evolving consumer preferences, technological advancements, and greater awareness of the product's benefits. As demand rises, businesses are expanding their offerings, innovating to meet consumer needs, and capitalizing on emerging trends, which further fuels market growth.
Global Electroretinography Market – by Product
- Fixed Electroretinography
- Portable Electroretinography
Global Electroretinography Market – by Application
- Clinical
- Research
Global Electroretinography Market – by Geography
-
North America
- US
- Canada
- Mexico
-
Europe
- France
- Germany
- Italy
- UK
- Spain
- Rest of Europe
-
Asia Pacific (APAC)
- China
- India
- South Korea
- Japan
- Australia
- Rest of APAC
-
Middle East & Africa (MEA)
- South Africa
- Saudi Arabia
- UAE
- Rest of MEA
-
South America and Central America (SCAM)
- Brazil
- Argentina
- Rest of SCAM
Company Profiles
- LKC Technologies, Inc
- Diagnosys LLC
- Electro-Diagnostic Imaging, Inc.
- Diopsys, Inc.
- Roland Consult Stasche & Finger GmbH
- Metrovision
- Costruzione Strumenti Oftalmici
- Konan Medical USA, Inc.
- Welch Allyn

- Comprehensive Market Sizing and Forecast Analysis
- Detailed Segmentation Analysis
- In-Depth Market Dynamics Assessment
- Regional and Country-Level Insights
- Competitive Landscape and Company Benchmarking
- Strategic Business Intelligence
Recent Reports
Testimonials
The Insight Partners' SCADA System Market report is comprehensive, with valuable insights on current trends and future forecasts. The team was highly professional, responsive, and supportive throughout. We are very satisfied and highly recommend their services.
RAN KEDEM Partner, Reali Technologies LTDsI requested a report on a very specific software market and the team produced the report in a few days. The information was very relevant and well presented. I then requested some changes and additions to the report. The team was again very responsive and I got the final report in less than a week.
JEAN-HERVE JENN Chairman, Future AnalyticaWe worked with The Insight Partners for an important market study and forecast. They gave us clear insights into opportunities and risks, which helped shape our plans. Their research was easy to use and based on solid data. It helped us make smart, confident decisions. We highly recommend them.
PIYUSH NAGPAL Sr. Vice President, High Beam GlobalThe Insight Partners delivered insightful, well-structured market research with strong domain expertise. Their team was professional and responsive throughout. The user-friendly website made accessing industry reports seamless. We highly recommend them for reliable, high-quality research services
YUKIHIKO ADACHI CEO, Deep Blue, LLC.This is the first time I have purchased a market report from The Insight Partners.While I was unsure at first, I visited their web site and felt more comfortable to take the risk and purchase a market report.I am completely satisfied with the quality of the report and customer service. I had several questions and comments with the initial report, but after a couple of dialogs over email with their analyst I believe I have a report that I can use as input to our strategic planning process.Thank you so much for taking the extra time and making this a positive experience.I will definitely recommend your service to others and you will be my first call when we need further market data.
JOHN SUZUKI President and Chief Executive Officer, Board Director, BK TechnologiesI wish to appreciate your support and the professionalism you displayed in the course of attending to my request for information regarding to infectious disease IVD market in Nigeria. I appreciate your patience, your guidance, and the fact that you were willing to offer a discount, which eventually made it possible for us to close a deal. I look forward to engaging The Insight Partners in the future, all thanks to the impression you have created in me as a result of this first encounter.
DR CHIJIOKE ONYIA MANAGING DIRECTOR, PineCrest Healthcare Ltd.Reason to Buy
- Informed Decision-Making
- Understanding Market Dynamics
- Competitive Analysis
- Identifying Emerging Markets
- Customer Insights
- Market Forecasts
- Risk Mitigation
- Boosting Operational Efficiency
- Strategic Planning
- Investment Justification
- Tracking Industry Innovations
- Aligning with Regulatory Trends


