Gate Valve Market Key Players and Opportunities by 2031
Historic Data: 2021-2022 | Base Year: 2023 | Forecast Period: 2024-2031Gate Valve Market Size and Forecast (2021 - 2031), Global and Regional Share, Trend, and Growth Opportunity Analysis Report Coverage: By Valve Type (Flexible wedge, Solid wedge, Split wedge or Parallel disks Valve), Valve Size (2" to 12", 14" to 36", and 42" & above), and Application ( Oil & Gas, Water & Wastewater Treatment, Chemical, and Others) and Geography
- Report Date : Aug 2025
- Report Code : TIPRE00028937
- Category : Manufacturing and Construction
- Status : Data Released
- Available Report Formats :


- No. of Pages : 150
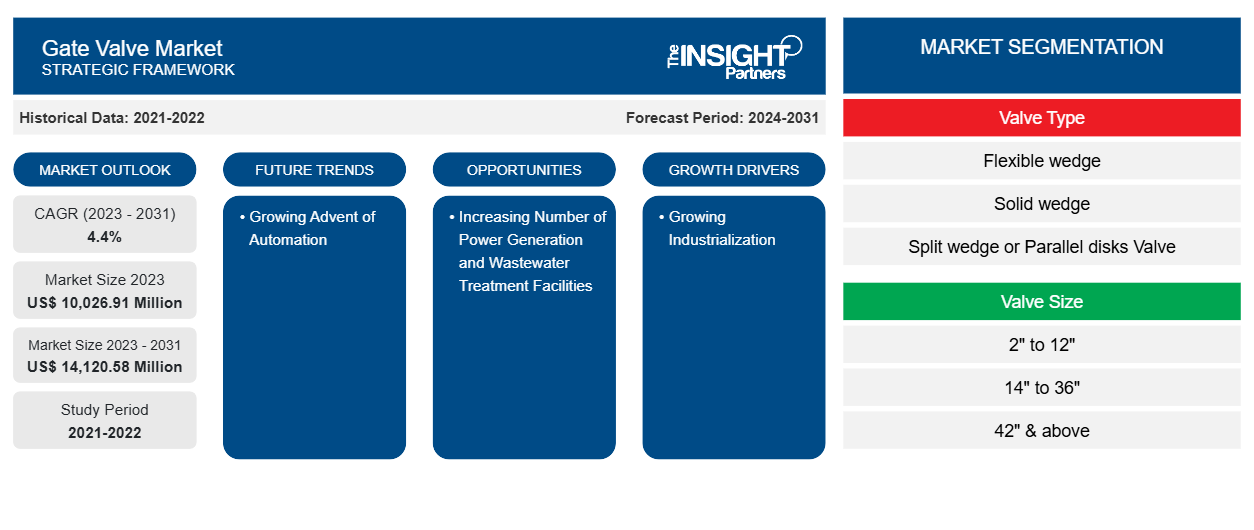
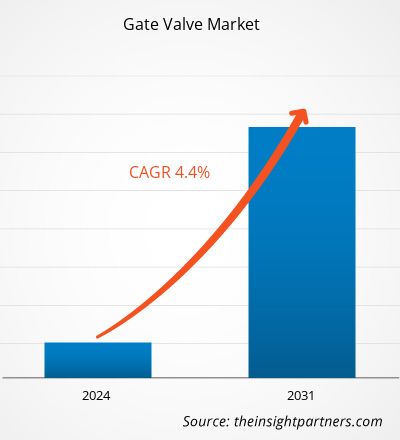
The gate valve market size is projected to reach US$ 14,120.58 million by 2031 from US$ 10,026.91 million in 2023. The market is expected to register a CAGR of 4.4% during 2023–2031. The increasing number of power generation and wastewater treatment facilities is likely to remain a key trend in the market.
Gate Valve Market Analysis
The gate valves are also utilized in low-pressure applications as industrial fittings. Water, steam, gases, and other comparable fluids with low corrosion, hydrogen mixes, and aggressive mediums are all possible working mediums for these split wedge gate valves. Isolation valves are the primary function of these gate valves. Gate valves have found application in various mechanical devices, including workplace HVAC and water systems and an automobile's gasoline motor. Furthermore, gate valves are widely found in homes and commercial facilities and are utilized for various functions. These valves are made of various materials, including stainless steel, cast iron, alloy steel, forged steel, and others.
Gate Valve Market Overview
The key stakeholders in the global gate valves market ecosystem include raw material suppliers, gate valves manufacturers, and end-users. The rising demand for gate valves in manufacturing units across different industries is one of the prominent factors driving the demand for gate valves. The raw material suppliers offer raw materials such as steel, iron, and aluminum for various valve types of gate valves, such as flexible wedge solid wedge, among others. In addition to this, the use of gate valves by end users for facilitating the offering of the necessary velocity, acceleration, and deceleration of fluid to the industrial equipment is further influencing the demand for gate valves.
Customize This Report To Suit Your Requirement
You will get customization on any report - free of charge - including parts of this report, or country-level analysis, Excel Data pack, as well as avail great offers and discounts for start-ups & universities
Gate Valve Market: Strategic Insights
- Get Top Key Market Trends of this report.This FREE sample will include data analysis, ranging from market trends to estimates and forecasts.
Gate Valve Market Drivers and Opportunities
Growing Industrialization to Favor Market
The governments of various developed countries like the US have taken various initiatives to support the industrial sector in the country. The government initiatives provide various benefits to the industrial companies located in the region and propel the growth of the industrial sector in the country. Thus, influencing the market growth. The high presence of manufacturing companies located in Europe benefitted from the developed facilities available. Being a powerful economy allows companies to spend more on innovations that facilitate the growth of upcoming technologies. Significant investments can bring about more growth in the gate valve market globally.
Growing Number of Power Generation and Wastewater Treatment Facilities
The developed regions are looking forward to introducing a wide range of water treatment and power generation facilities. Also, several companies in the region are taking strategic initiatives & investing in advanced technologies, which is further boosting the gate valve market. The technological ecosystem in North America and Europe is advanced. The developed regions focus on investing in advanced technologies. For instance, Veolia Water Technologies, which heavily invested in portable water treatment technologies and has solved major issues with a water solutions specialist & offered a number of emergency response services for downtime management, which is anticipated to drive the application of the gate valves. In addition, the rising need for energy is also growing demand for power generation facilities which is also positively influencing the gate valve market over the coming years.
Gate Valve Market Report Segmentation Analysis
Key segments that contributed to the derivation of the gate valve market analysis are valve type, valve size and application.
- Based on the valve type, the gate valve market is divided into flexible wedge, solid wedge, split wedge or parallel disk valves. The solid wedge segment held a larger market share in 2023.
- Based on the valve size, the gate valve market is divided into 2" to 12", 14" to 36", and 42" & above. The 14" to 36" segment held a larger market share in 2023.
- By application, the market is segmented into oil & gas, water & wastewater treatment, chemical, and others. The oil & gas segment held a significant share of the market in 2023.
Gate Valve Market Share Analysis by Geography
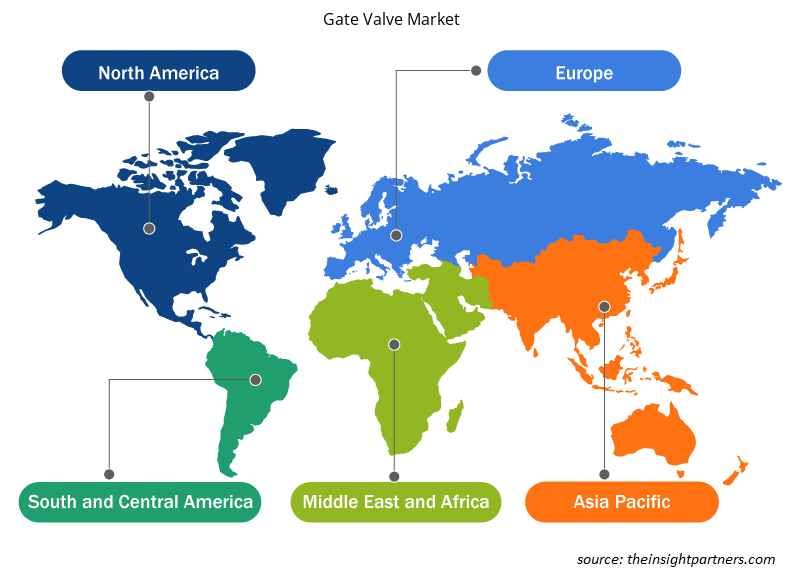
The geographic scope of the gate valve market report is mainly divided into five regions: North America, Asia Pacific, Europe, Middle East & Africa, and South & Central America.
Asia Pacific is leading the market. Asia Pacific is a highly populated region across the world, having a higher demand for energy. The Asia Pacific region is extremely dependent on fossil fuels for energy generation, and to decrease the dependency, countries such as China, India, Japan, and Australia are strongly investing in renewable energy projects. In fact, China is the largest manufacturer as well as holds the largest installation of wind energy projects across the world. The growing number of renewable power generation facilities is acting as a major driver for the gate valve market. Similarly, the growing number of water and wastewater treatment facilities around the world has a significant positive impact on the gate valve industry.
Gate Valve Market Regional Insights
The regional trends and factors influencing the Gate Valve Market throughout the forecast period have been thoroughly explained by the analysts at Insight Partners. This section also discusses Gate Valve Market segments and geography across North America, Europe, Asia Pacific, Middle East and Africa, and South and Central America.
- Get the Regional Specific Data for Gate Valve Market
Gate Valve Market Report Scope
| Report Attribute | Details |
|---|---|
| Market size in 2023 | US$ 10,026.91 Million |
| Market Size by 2031 | US$ 14,120.58 Million |
| Global CAGR (2023 - 2031) | 4.4% |
| Historical Data | 2021-2022 |
| Forecast period | 2024-2031 |
| Segments Covered |
By Valve Type
|
| Regions and Countries Covered | North America
|
| Market leaders and key company profiles |
Gate Valve Market Players Density: Understanding Its Impact on Business Dynamics
The Gate Valve Market is growing rapidly, driven by increasing end-user demand due to factors such as evolving consumer preferences, technological advancements, and greater awareness of the product's benefits. As demand rises, businesses are expanding their offerings, innovating to meet consumer needs, and capitalizing on emerging trends, which further fuels market growth.
Market players density refers to the distribution of firms or companies operating within a particular market or industry. It indicates how many competitors (market players) are present in a given market space relative to its size or total market value.
Major Companies operating in the Gate Valve Market are:
- BRAY INTERNATIONAL
- DEZURIK, INC.
- EMERSON ELECTRIC CO.
- ITT INC.
- MUELLER CO. LLC
- ORBINOX
Disclaimer: The companies listed above are not ranked in any particular order.
- Get the Gate Valve Market top key players overview
Gate Valve Market News and Recent Developments
The gate valve market is evaluated by gathering qualitative and quantitative data post primary and secondary research, which includes important corporate publications, association data, and databases. A few of the developments in the gate valve market are listed below:
- Mueller Launched a Knife Gate Valve Pratt P77 perimeter-seated bi-directional valve for Industrial Applications. (Source: Mueller Co. LLC, Press Release, September 2023)
- ORBINOX introduced a high-pressure model bi-directional knife gate valve primarily designed for industrial and water treatment applications. Its design focuses on delivering a perfect solution for water treatment applications and for general industrial processes requiring high-pressure performance and reliability. (Source: ORBINOX, Press Release, January 2022)
Gate Valve Market Report Coverage and Deliverables
The “Gate Valve Market Size and Forecast (2021–2031)” report provides a detailed analysis of the market covering below areas:
- Gate valve market size and forecast at global, regional, and country levels for all the key market segments covered under the scope
- Gate valve market trends as well as market dynamics such as drivers, restraints, and key opportunities
- Detailed PEST and SWOT analysis
- Gate valve market analysis covering key market trends, global and regional framework, major players, regulations, and recent market developments
- Industry landscape and competition analysis covering market concentration, heat map analysis, prominent players, and recent developments for the gate valve market
- Detailed company profiles
Frequently Asked Questions
Which region dominated the gate valve market in 2023?
Asia Pacific dominated the gate valve market in 2023.
What are the future trends of the gate valve market?
The growing advent of automation is the future trend of the gate valve market.
Which are the leading players operating in the gate valve market?
Bray International, Dezurik, Inc., Emerson Electric Co., ITT Inc., Mueller Co. Llc, Orbinox, Sistag Ag, Stafsjö Valves Ab, Weir Group Plc, Zhejiang Linuo Fluid Control Technology Co., Ltd are some of the leading players in the market.
What would be the estimated value of the gate valve market by 2031?
US$ 14,120.58 million estimated value of the gate valve market by 2031.
What is the expected CAGR of the gate valve market?
4.4% is the expected CAGR of the gate valve market.

Market Research & Consulting
- Historical Analysis (2 Years), Base Year, Forecast (7 Years) with CAGR
- PEST and SWOT Analysis
- Market Size Value / Volume - Global, Regional, Country
- Industry and Competitive Landscape
- Excel Dataset
Testimonials
I wish to appreciate your support and the professionalism you displayed in the course of attending to my request for information regarding to infectious disease IVD market in Nigeria. I appreciate your patience, your guidance, and the fact that you were willing to offer a discount, which eventually made it possible for us to close a deal. I look forward to engaging The Insight Partners in the future, all thanks to the impression you have created in me as a result of this first encounter.
DR CHIJIOKE ONYIA, MANAGING DIRECTOR, PineCrest Healthcare Ltd.The Insight Partners delivered insightful, well-structured market research with strong domain expertise. Their team was professional and responsive throughout. The user-friendly website made accessing industry reports seamless. We highly recommend them for reliable, high-quality research services
Yukihiko Adachi CEO, Deep Blue, LLC.Reason to Buy
- Informed Decision-Making
- Understanding Market Dynamics
- Competitive Analysis
- Customer Insights
- Market Forecasts
- Risk Mitigation
- Strategic Planning
- Investment Justification
- Identifying Emerging Markets
- Enhancing Marketing Strategies
- Boosting Operational Efficiency
- Tracking Industry Innovations
- Aligning with Regulatory Trends
Yes! We provide a free sample of the report, which includes Report Scope (Table of Contents), report structure, and selected insights to help you assess the value of the full report. Please click on the "Download Sample" button or contact us to receive your copy.
Absolutely — analyst assistance is part of the package. You can connect with our analyst post-purchase to clarify report insights, methodology or discuss how the findings apply to your business needs.
Once your order is successfully placed, you will receive a confirmation email along with your invoice.
• For published reports: You’ll receive access to the report within 4–6 working hours via a secured email sent to your email.
• For upcoming reports: Your order will be recorded as a pre-booking. Our team will share the estimated release date and keep you informed of any updates. As soon as the report is published, it will be delivered to your registered email.
We offer customization options to align the report with your specific objectives. Whether you need deeper insights into a particular region, industry segment, competitor analysis, or data cut, our research team can tailor the report accordingly. Please share your requirements with us, and we’ll be happy to provide a customized proposal or scope.
The report is available in either PDF format or as an Excel dataset, depending on the license you choose.
The PDF version provides the full analysis and visuals in a ready-to-read format. The Excel dataset includes all underlying data tables for easy manipulation and further analysis.
Please review the license options at checkout or contact us to confirm which formats are included with your purchase.
Our payment process is fully secure and PCI-DSS compliant.
We use trusted and encrypted payment gateways to ensure that all transactions are protected with industry-standard SSL encryption. Your payment details are never stored on our servers and are handled securely by certified third-party processors.
You can make your purchase with confidence, knowing your personal and financial information is safe with us.
Yes, we do offer special pricing for bulk purchases.
If you're interested in purchasing multiple reports, we’re happy to provide a customized bundle offer or volume-based discount tailored to your needs. Please contact our sales team with the list of reports you’re considering, and we’ll share a personalized quote.
Yes, absolutely.
Our team is available to help you make an informed decision. Whether you have questions about the report’s scope, methodology, customization options, or which license suits you best, we’re here to assist. Please reach out to us at sales@theinsightpartners.com, and one of our representatives will get in touch promptly.
Yes, a billing invoice will be automatically generated and sent to your registered email upon successful completion of your purchase.
If you need the invoice in a specific format or require additional details (such as company name, GST, or VAT information), feel free to contact us, and we’ll be happy to assist.
Yes, certainly.
If you encounter any difficulties accessing or receiving your report, our support team is ready to assist you. Simply reach out to us via email or live chat with your order information, and we’ll ensure the issue is resolved quickly so you can access your report without interruption.


 Get Free Sample For