
North America Automotive Gears Market Drivers and Forecasts by 2030
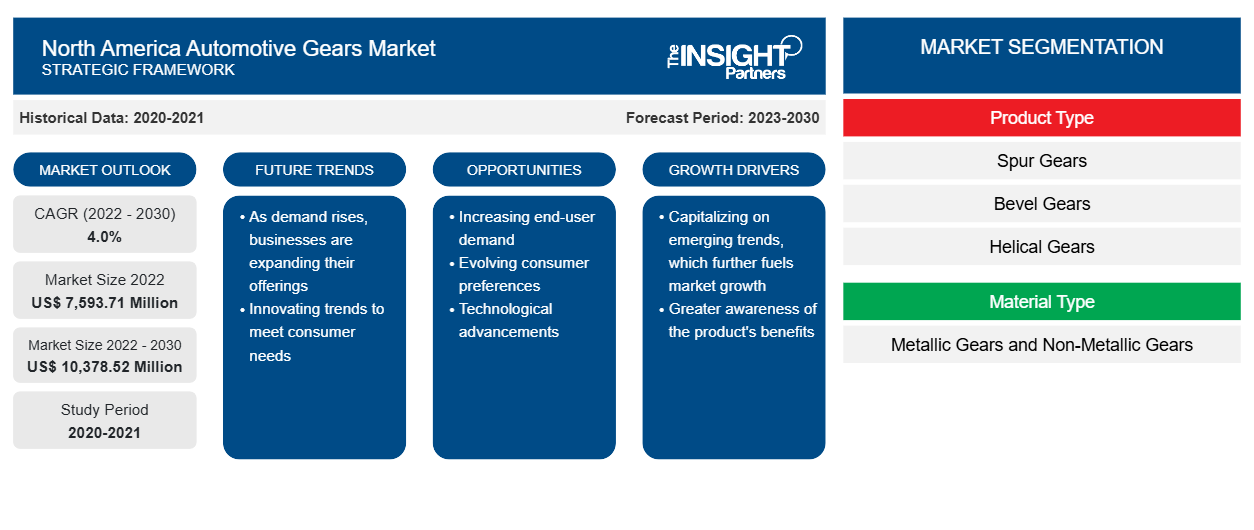
North America Automotive Gears Market Size and Forecasts (2020 - 2030), Regional Share, Trends, and Growth Opportunity Analysis Report Coverage: By Product Type (Spur Gears, Bevel Gears, Helical Gears, Worm Gears, Planetary Gears, Rack & Pinion Gears, Hypoid Gears, and Others), Material Type (Metallic Gears and Non-Metallic Gears), and Application (Transmission System, Steering System, Differential System, and Others)
Historic Data: 2020-2021 | Base Year: 2022 | Forecast Period: 2023-2030- Status : Published
- Report Code : TIPRE00030058
- Category : Automotive and Transportation
- No. of Pages : 92
- Available Report Formats :


The North America automotive gears market accounted for US$ 7,593.71 million in 2022 and is expected to grow at a CAGR of 4.0% from 2022 to 2030 to reach US$ 10,378.52 million by 2030.
Analyst Perspective:
In North America, the US significantly contributes to the automobile industry. According to the Alliance for Automotive Innovation Report in 2021, the automotive industry's ecosystem, from automotive component manufacturers to the original vehicle manufacturers, generates over US$ 1 trillion annually for the US economy. The automotive sector in the US contributed 4.9% of its overall GDP, with manufacturing of vehicles and their parts representing 6% of the overall manufacturing in the country. Motor vehicles and parts, including gears, seating systems, doors, and transmission systems, are heavily exported from the US. Automotive vehicles and their components were the second-largest exporting goods in 2021, valued at ~US$ 105 billion. The rising demand for automotive components by the original vehicle manufacturers worldwide is anticipated to create ample opportunity for the automotive gears market. The original vehicle manufacturers widely use automotive gears to produce good-quality vehicles. The US-based ports have achieved over US$ 400 billion in trade volume in vehicles and components. This yearly sale of cars in the US has created a massive demand for automotive gears market for manufacturing cars.
Market Overview:
The North American automotive industry is a major driving component of its economic growth. According to the Centre for Automotive Research Organization, the automotive industry's total size in the global economy was ~US$ 2.8 trillion in 2022, accounting for 3% of the global economic GDP. The automotive industry in North America generates more than US$ 500 billion in annual sales of vehicles. It employs more than 1.7 million people in the US, as per the National Automobile Dealers Association (NADA) report 2022. As per the same source, the automotive ecosystem (including direct, indirect, and induced value added) annually generates more than US$ 1 trillion in the US, i.e., 4.9% of the US GDP. Thus, the well-established automotive industry is bolstering the automotive gears market growth.
Automotive gears help regulate rotational speed and power by transferring the energy produced by the engine to the wheels safely and efficiently. Typically, gears have several teeth that are in contact with other gears. In various transmission systems, several arrangements of gear of varying sizes are involved to transmit power. Some of the major types of gear used in automotive are spur gear, bevel gear, helical gear, and hypoid gear. Automotive gears are meshed together and deliver appropriate power and torque that help control the vehicle's speed. The rising vehicle production with the surge in disposable income is driving the automotive gears market share in North America. As per the International Organization of Motor Vehicle Manufacturers (OICA), in 2022, global automotive car production increased to 61.5 million (an ~8.0% increase) compared to the previous year. Also, overall car sales in the US market reached 1.75 million units in 2022, which increased by ~12% compared to the previous year. This yearly sale of cars in the US has created a massive demand for automotive gears market for manufacturing cars.
Customize This Report To Suit Your Requirement
Get FREE CUSTOMIZATIONNorth America Automotive Gears Market: Strategic Insights
-
Get Top Key Market Trends of this report.This FREE sample will include data analysis, ranging from market trends to estimates and forecasts.
Market Driver:
Favorable Policies for Manufacturing Vehicle Components Across North America Boosting the Automotive Gears Market Growth
North America has the presence of several leading automotive brand manufacturers, including General Motors Co., Ford Motor Co., PACCAR Inc., Tesla Inc., Navistar International Corp, Rivian Automotive Inc., and BMW AG. These leading players require several automotive components to manufacture commercial and passenger vehicles. In North America, the governments support increasing the local production of automobiles and their parts. The United States government has imposed several favorable policies for manufacturing automotive components. For instance, per the United States-Mexico-Canada Agreement (USMCA), motor vehicles produced in North America must contain ~75% of automotive parts made of steel and aluminum originating from this region. As per the USMCA, the regional value content (RVC) requirements are ~75% for the vehicles produced in North America under the new rule by the North American Free Trade Agreement (NAFTA). Such favorable government policies are increasing automotive gears market growth.
According to Mexico's National Auto Parts Industry (INA) Report, auto parts production reached ~US$ 107 billion in 2022, an increase of 13% compared to the previous year. Favorable trade and manufacturing policies by governments to promote the automotive industry are driving the automotive gears market.
- This FREE sample will include data analysis, ranging from market trends to estimates and forecasts.
Segmental Analysis:
Based on product type, the North America automotive gears market is segmented into planetary gears, spur gears, bevel gears, helical gears, worm gears, rack & pinion gears, hypoid gears, and others.
Spur gears transmit power to the shafts that are parallel to each other. The spur gear's teeth are parallel to the shaft's axis. This causes radial movement of the gears on the shaft. These gears are slightly noisier than helical gears, operating through a single contact line between the teeth. Several key automotive component manufacturers across North American countries are developing advanced spur gear designs that enhance transmission efficiency and power. Key automotive gears market players are investing a considerable amount to develop innovative designs of the spur gears. In September 2020, Associated Electrics, Inc. launched an innovative design of octalock spur gears. These gears were designed in an octagon shape with a locking system that engages the spur gear for maximum longevity and security. Spur gears are primarily used in heavy commercial vehicles for torque and power. Spur gears connect the parallel shaft gear group and are cylindrical gears with a tooth line straight and parallel to the shaft. The rising sales and production of heavy commercial vehicles in North American countries is the major driving factor for the automotive gears market. Volvo, a manufacturer of heavy commercial vehicles, reached a sale of 0.32 million truck units in North America and Europe. Also, according to the International Organization of Motor Vehicle Manufacturers (OICA) report, in 2021, heavy truck sales in North America reached 0.62 million units, an increase of 30% compared to 2020. Such an increase in the sale of heavy commercial vehicles created a steady growth for automotive gears market share in North America.
- This FREE sample will include data analysis, ranging from market trends to estimates and forecasts.
Regional Analysis:
According to Mexico's National Auto Parts Industry (INA) Report, auto parts production reached ~US$ 107 billion in 2022, an increase of 13% compared to the previous year. Favorable trade and manufacturing policies by governments to promote the automotive industry are driving the automotive gears market. For instance, between 2021 and 2022, Canadian subsidiaries of US automotive manufacturers have made substantial investments in Canada. In 2021, General Motors invested more than US$ 785 million, Ford Motors invested US$ 1.5 billion, and Stellantis invested US$ 1.14 billion to expand their production facilities of electric and IC engine vehicles. In 2021, Canadian original vehicle manufacturers imported US$ 13.1 billion of automotive components in the country. Thus, the growing investment in automotive industry may contribute to the growth of automotive gears market share in Canada.
Key Player Analysis:
ThyssenKrupp AG, American Axle & Manufacturing Inc, JTEKT Corp, Univance Corp, and GKN Automotive Ltd are the prominent market participants in the North America automotive gears market.
Recent Developments:
Inorganic and organic strategies such as mergers and acquisitions are highly adopted by companies in the North America automotive gears market. The market initiative is a strategy adopted by automotive gears market players to expand their footprint across the world and to meet the growing customer demand. The market players present in the North America automotive gears market are mainly focusing on product and service enhancements by integrating advanced features and technologies into their offerings. A few recent developments by the key North America automotive gears market players are listed below:
Year |
News |
|
2022 |
American Axle & Manufacturing committed US$ 15 million to Autotech Ventures in a partnership that provided access to new opportunities that complement AAM's mission to develop and produce efficient and powerful electric drivelines. |
|
2023 |
Gear Motions had announced that Auto Gear Inc joined the Gear Motion's family. Auto Gear, located in Syracuse, New York, specializes in efficient and economical low-volume gearbox production, from design to delivery. |
North America Automotive Gears Report Scope
| Report Attribute | Details |
|---|---|
| Market size in 2022 | US$ 7,593.71 Million |
| Market Size by 2030 | US$ 10,378.52 Million |
| CAGR (2022 - 2030) | 4.0% |
| Historical Data | 2020-2021 |
| Forecast period | 2023-2030 |
| Segments Covered |
By Product Type
|
| Regions and Countries Covered |
North America
|
| Market leaders and key company profiles |
|
Frequently Asked Questions

- Historical Analysis (2 Years), Base Year, Forecast (7 Years) with CAGR
- PEST and SWOT Analysis
- Market Size Value / Volume - Regional, Country
- Industry and Competitive Landscape
- Excel Dataset
Recent Reports
Testimonials
The Insight Partners' SCADA System Market report is comprehensive, with valuable insights on current trends and future forecasts. The team was highly professional, responsive, and supportive throughout. We are very satisfied and highly recommend their services.
RAN KEDEM Partner, Reali Technologies LTDsI requested a report on a very specific software market and the team produced the report in a few days. The information was very relevant and well presented. I then requested some changes and additions to the report. The team was again very responsive and I got the final report in less than a week.
JEAN-HERVE JENN Chairman, Future AnalyticaWe worked with The Insight Partners for an important market study and forecast. They gave us clear insights into opportunities and risks, which helped shape our plans. Their research was easy to use and based on solid data. It helped us make smart, confident decisions. We highly recommend them.
PIYUSH NAGPAL Sr. Vice President, High Beam GlobalThe Insight Partners delivered insightful, well-structured market research with strong domain expertise. Their team was professional and responsive throughout. The user-friendly website made accessing industry reports seamless. We highly recommend them for reliable, high-quality research services
YUKIHIKO ADACHI CEO, Deep Blue, LLC.This is the first time I have purchased a market report from The Insight Partners.While I was unsure at first, I visited their web site and felt more comfortable to take the risk and purchase a market report.I am completely satisfied with the quality of the report and customer service. I had several questions and comments with the initial report, but after a couple of dialogs over email with their analyst I believe I have a report that I can use as input to our strategic planning process.Thank you so much for taking the extra time and making this a positive experience.I will definitely recommend your service to others and you will be my first call when we need further market data.
JOHN SUZUKI President and Chief Executive Officer, Board Director, BK TechnologiesI wish to appreciate your support and the professionalism you displayed in the course of attending to my request for information regarding to infectious disease IVD market in Nigeria. I appreciate your patience, your guidance, and the fact that you were willing to offer a discount, which eventually made it possible for us to close a deal. I look forward to engaging The Insight Partners in the future, all thanks to the impression you have created in me as a result of this first encounter.
DR CHIJIOKE ONYIA MANAGING DIRECTOR, PineCrest Healthcare Ltd.Reason to Buy
- Informed Decision-Making
- Understanding Market Dynamics
- Competitive Analysis
- Identifying Emerging Markets
- Customer Insights
- Market Forecasts
- Risk Mitigation
- Boosting Operational Efficiency
- Strategic Planning
- Investment Justification
- Tracking Industry Innovations
- Aligning with Regulatory Trends
Unlock Exclusive Report Discounts
Enquire Now


 Get Free Sample For