Europe Photoresist Process Chemicals Market Trends and Analysis by 2028
Europe Photoresist Process Chemicals Market Forecast to 2028 - COVID-19 Impact and Regional Analysis By Product Type (Solvents, Binders, Sensitizer, and Others), and Application (Microelectronics, Printed Circuit Boards and Others)
- Report Date : Jul 2021
- Report Code : TIPRE00023454
- Category : Chemicals and Materials
- Status : Published
- Available Report Formats :


- No. of Pages : 99
The Europe photoresist process chemicals market is expected to grow from US$ 607.26 million in 2020 to US$ 865.38 million by 2028; it is estimated to grow at a CAGR of 4.5% from 2020 to 2028.
The market for the Europe region includes Germany, France, Spain, the UK, Russia, and the rest of Europe. The chemical industry contributes a major share to the GDP of the region. This industry is supporting the growth of the economy of different countries by assisting with various materials to be utilized in end-use applications that further result in the creation of a diversified array of business opportunities as well as services. The chemical and materials industry of the EU is a crucial industry as it significantly contributes to the country’s GDP as well as employs millions of people in the region. Increasing demand for photoresist chemicals in various product processing for end-use application in semiconductor, automotive, electrical, and other industries are influencing the photoresist chemicals market in Europe.
In case of COVID-19, in Europe, especially France, witnessed an unprecedented rise in number of coronavirus cases, which led to the discontinuation of photoresist process chemicals manufacturing activities. Downfall of other chemical and materials manufacturing sectors has subsequently impacted the demand for photoresist process chemicals during the early months of 2020. Moreover, decline in the overall semiconductor manufacturing activities has led to discontinuation of photoresist process chemicals manufacturing projects, thereby reducing the demand for photoresist process chemicals. Similar trend was witnessed in other Europe countries, i.e., Russia, UK, Italy, Germany and Spain. However, the countries are likely to overcome thus drop in demand with the economic activities regaining their pace, especially in the beginning of the 2021.
With the new advancements and technologies, vendors can attract new customers and expand their footprints in emerging markets. This factor is likely to drive the Europe photoresist process chemicals market. Recent technological advancements have increased the importance of semiconductors across various industry verticals. From being a major component of consumer electronics and peripherals, they have also been witnessing a rise in demand from the automotive sector in recent years. After witnessing a decline in sales numbers in 2019, the semiconductor industry reported positive revenue growth in 2019 despite the troubles caused by the COVID-19 pandemic that brought the world economy to a halt. According to the World Semiconductor Trade Statistics, chip sales rose to US$ 439 billion in 2019. It is predicted to reach US$ 469 billion in 2021. The major semiconductor companies such as Taiwan Semiconductor, Intel, and Texas Instruments have also reported positive results. The Philadelphia Semiconductor Index, which tracks the value of the 30 largest semiconductor firms increased by over 5 times in the last 5 years, from US$ 80 in Jan 2016 to US$ 416 in Jan 2021. Moreover, semiconductors are an integral unit to the technology around us and they reinforce the technological innovations. They provide the essential technologies to the gadgets of everyday use such as televisions, computers, and mobile devices. Photoresist chemicals are used in semiconductor manufacturing for photolithography. Photolithography has been the major driver in the quest to achieve maximum size reduction of gadgets and devices.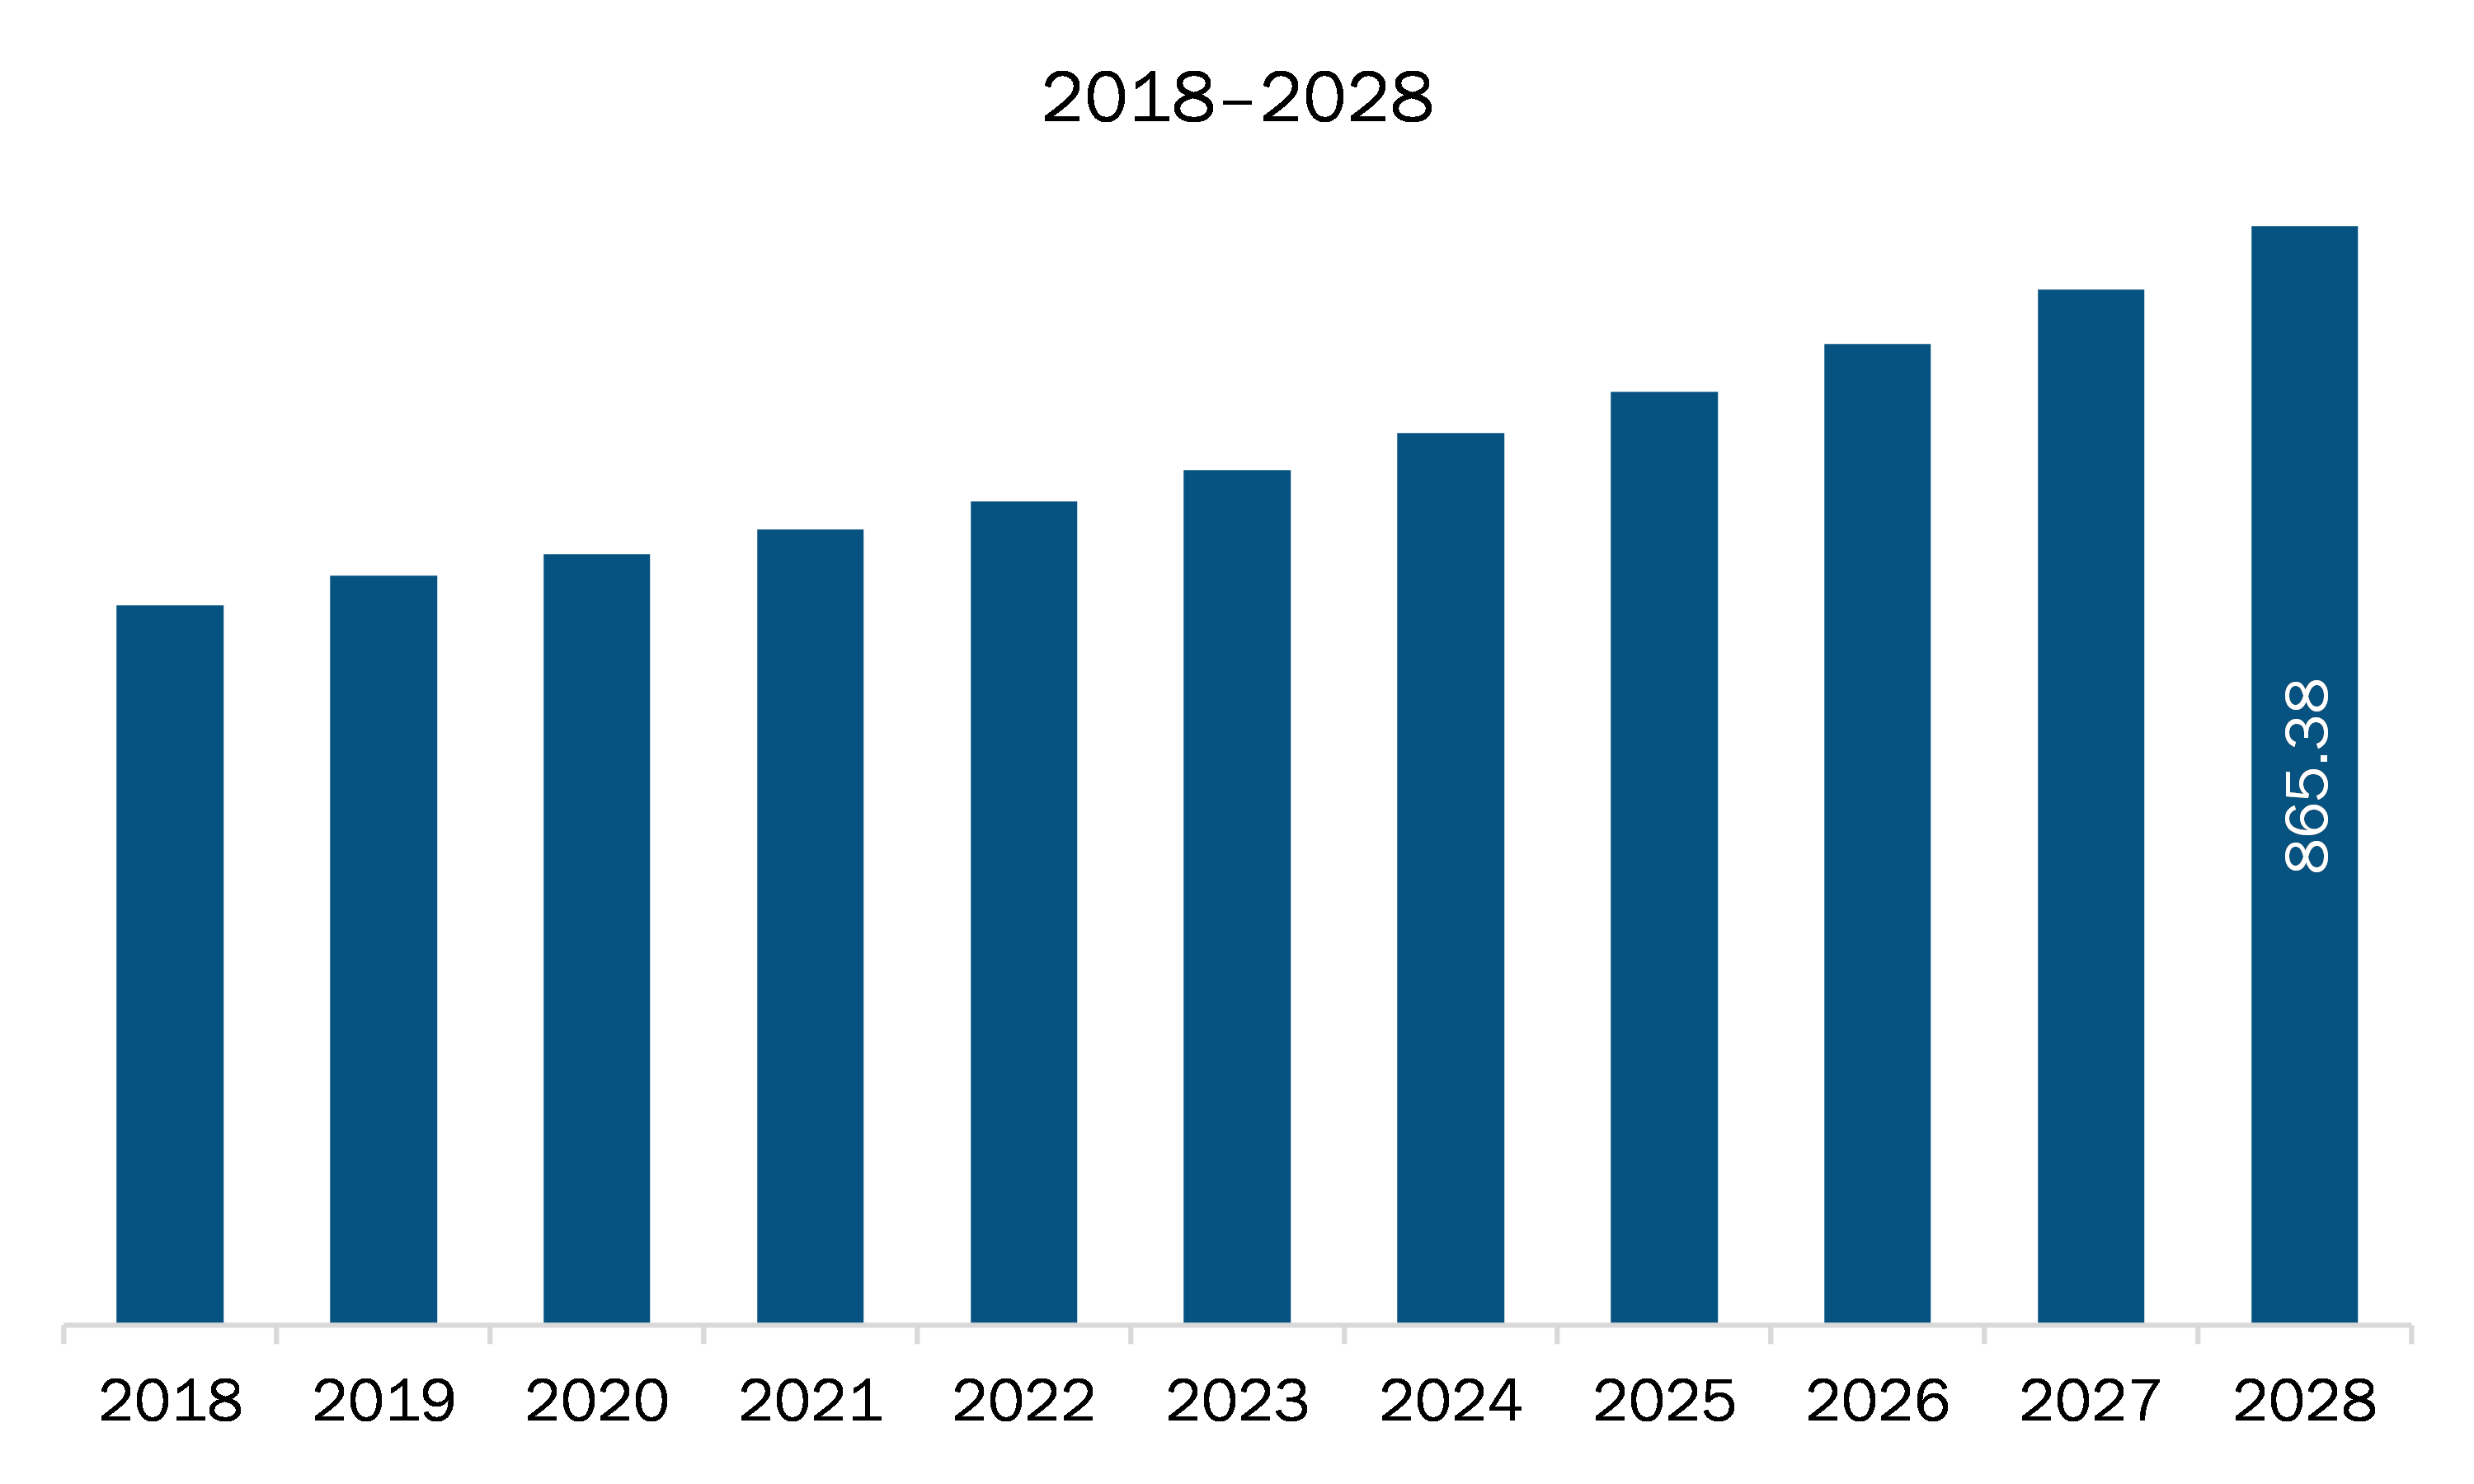
- Sample PDF showcases the content structure and the nature of the information with qualitative and quantitative analysis.
- Request discounts available for Start-Ups & Universities
Europe Photoresist Process Chemicals Market Segmentation
Europe Photoresist Process Chemicals Market – By Product Type
- Solvents
- Binders
- Sensitizer
- Others
Europe Photoresist Process Chemicals Market – By Application
- Microelectronics
- Printed Circuit Boards
- Others
Europe Photoresist Process Chemicals Market – By Country
- Germany
- France
- UK
- Spain
- Russia
- Rest of Europe

Report Coverage
Revenue forecast, Company Analysis, Industry landscape, Growth factors, and Trends

Segment Covered
Product Type, and Application

Regional Scope
North America, Europe, Asia Pacific, Middle East & Africa, South & Central America

Country Scope
UK, Germany, France, Italy, Russia
1. Introduction
1.1 Scope of the Study
1.2 The Insight Partners Research Report Guidance
1.3 Market Segmentation
1.3.1 Europe Photoresist Process Chemicals Market – By Product Type
1.3.2 Europe Photoresist Process Chemicals Market – By Application
1.3.3 Europe Photoresist Process Chemicals Market – By Country
2. Key Takeaways
3. Research Methodology
3.1 Scope of the Study
3.2 Research Methodology
3.2.1 Data Collection:
3.2.2 Primary Interviews:
3.2.3 Hypothesis formulation:
3.2.4 Macro-economic factor analysis:
3.2.5 Developing base number:
3.2.6 Data Triangulation:
3.2.7 Country Level Data:
4. Europe Photoresist Process Chemicals Market Landscape
4.1 Market Overview
4.2 Pest Analysis
4.3 Expert Opinions
5. Europe Photoresist Process Chemicals Market – Key Market Dynamics
5.1 Market Drivers
5.1.1 Expansion of the Semiconductor Industry
5.1.2 An Upsurge in the Penetration of Internet of Things (IoT) and Connected Devices
5.2 Market Restraints
5.2.1 Volatility in the Prices of Raw Materials
5.3 Market Opportunities
5.3.1 Installation of 5G technology
5.4 Future Trends
5.4.1 Increasing Demand for Medical Electronics such as Rapid Diagnostic Systems After COVID-19
5.5 Impact Analysis of Drivers and Restraints
6. Photoresist Process Chemicals – Europe Market Analysis
6.1 Europe Photoresist Process Chemicals Market Overview
6.2 Europe Photoresist Process Chemicals Market Forecast and Analysis
7. Europe Photoresist Chemicals Market Analysis – By Product Type
7.1 Overview
7.2 Photoresist Chemicals Market, By Product Type (2019 and 2028)
7.3 Solvent
7.3.1 Overview
7.3.2 Solvent: Photoresist Chemicals Market Analysis and Forecast to 2028
7.4 Binders
7.4.1 Overview
7.4.2 Binders: Photoresist Chemicals Market Analysis and Forecast to 2028
7.5 Sensitizer
7.5.1 Overview
7.5.2 Sensitizer: Photoresist Chemicals Market Analysis and Forecast to 2028
7.6 Others
7.6.1 Overview
7.6.2 Others: Photoresist Chemicals Market Analysis and Forecast to 2028
8. Europe Photoresist Chemicals Market Analysis – By Application
8.1 Overview
8.2 Photoresist Chemicals Market, By Application (2019 and 2028)
8.3 Microelectronics
8.3.1 Overview
8.3.2 Microelectronics: Photoresist Chemicals Market – Revenue and Forecast to 2028 (US$ Mn)
8.4 Printed Circuit Board
8.4.1 Overview
8.4.2 Printed Circuit Board: Photoresist chemicals Market – Revenue and Forecast to 2028 (US$ Mn)
8.5 Others
8.5.1 Overview
8.5.2 Others: Photoresist Chemicals Market – Revenue and Forecast to 2028 (US$ Mn)
9. Europe Photoresist Chemicals Market – Country Analysis
9.1 Europe: Photoresist Chemicals Market
9.1.2 Europe: Photoresist Chemicals Market, by Key Country
9.1.2.1 Germany: Photoresist Chemicals Market –Revenue and Forecast to 2028 (US$ Mn)
9.1.2.1.1 Germany: Photoresist Chemicals Market, Product Type
9.1.2.1.2 Germany: Photoresist Chemicals Market, Application
9.1.2.2 France: Photoresist Chemicals Market –Revenue and Forecast to 2028 (US$ Mn)
9.1.2.2.1 France: Photoresist Chemicals Market, Product Type
9.1.2.2.2 France: Photoresist Chemicals Market, Application
9.1.2.3 Spain: Photoresist Chemicals Market –Revenue and Forecast to 2028 (US$ Mn)
9.1.2.3.1 Spain: Photoresist Chemicals Market, Product Type
9.1.2.3.2 Spain: Photoresist Chemicals Market, Application
9.1.2.4 UK: Photoresist Chemicals Market –Revenue and Forecast to 2028 (US$ Mn)
9.1.2.4.1 UK: Photoresist Chemicals Market, by Product Type
9.1.2.4.2 UK: Photoresist Chemicals Market, Application
9.1.2.5 Russia: Photoresist Chemicals Market –Revenue and Forecast to 2028 (US$ Mn)
9.1.2.5.1 Russia: Photoresist Chemicals Market, Product Type
9.1.2.5.2 Russia: Photoresist Chemicals Market, Application
9.1.2.6 Rest of Europe: Photoresist Chemicals Market –Revenue and Forecast to 2028 (US$ Mn)
9.1.2.6.1 Rest of Europe: Photoresist Chemicals Market, Product Type
9.1.2.6.2 Rest of Europe: Photoresist Chemicals Market, Application
10. Impact of COVID-19 Pandemic on Europe Photoresist Process Chemicals Market
10.1 Overview
10.2 Europe: Impact Assessment of COVID-19 Pandemic
11. Company Profiles
11.1 Sumitomo Chemical Co., Ltd.
11.1.1 Key Facts
11.1.2 Business Description
11.1.3 Products and Services
11.1.4 Financial Overview
11.1.5 SWOT Analysis
11.2 Tokyo Ohka Kogyo Co., Ltd.
11.2.1 Key Facts
11.2.2 Business Description
11.2.3 Products and Services
11.2.4 Financial Overview
11.2.5 SWOT Analysis
11.3 Tokuyama Corporation
11.3.1 Key Facts
11.3.2 Business Description
11.3.3 Products and Services
11.3.4 Financial Overview
11.3.5 SWOT Analysis
11.4 DuPont
11.4.1 Key Facts
11.4.2 Business Description
11.4.3 Products and Services
11.4.4 Financial Overview
11.4.5 SWOT Analysis
11.5 Allresist GmbH
11.5.1 Key Facts
11.5.2 Business Description
11.5.3 Products and Services
11.5.4 Financial Overview
11.5.5 SWOT Analysis
11.6 Microchemicals Gmbh
11.6.1 Key Facts
11.6.2 Business Description
11.6.3 Products and Services
11.6.4 Financial Overview
11.6.5 SWOT Analysis
11.6.6 Key Developments
12. Appendix
12.1 About The Insight Partners
12.2 Glossary of Terms
LIST OF TABLES
Table 1. Europe Photoresist Process Chemicals Market Revenue and Forecasts to 2028 (US$ Mn)
Table 2. Germany Photoresist Chemicals Market, Product Type- Revenue and Forecast to 2028 (US$ Mn)
Table 3. Germany Photoresist Chemicals Market, Application– Revenue and Forecast to 2028 (US$ Mn)
Table 4. France Photoresist Chemicals Market, Product Type– Revenue and Forecast to 2028 (US$ Mn)
Table 5. France Photoresist Chemicals Market, Application– Revenue and Forecast to 2028 (US$ Mn)
Table 6. Spain Photoresist Chemicals Market, Product Type– Revenue and Forecast to 2028 (US$ Mn)
Table 7. Spain Photoresist Chemicals Market, Application– Revenue and Forecast to 2028 (US$ Mn)
Table 8. UK Photoresist Chemicals Market, by Product Type– Revenue and Forecast to 2028 (US$ Mn)
Table 9. UK Photoresist Chemicals Market, Application– Revenue and Forecast to 2028 (US$ Mn)
Table 10. Russia Photoresist Chemicals Market, Product Type– Revenue and Forecast to 2028 (US$ Mn)
Table 11. Russia Photoresist Chemicals Market, Application– Revenue and Forecast to 2028 (US$ Mn)
Table 12. Rest of Europe Photoresist Chemicals Market, Product Type– Revenue and Forecast to 2028 (US$ Mn)
Table 13. Rest of Europe Photoresist Chemicals Market, Application– Revenue and Forecast to 2028 (US$ Mn)
Table 14. Glossary of Term: Photoresist Process Chemicals Market
LIST OF FIGURES
Figure 1. Photoresist Process Chemicals Market Segmentation
Figure 2. Europe Photoresist Process Chemicals Market Segmentation - Country
Figure 3. Photoresist Process Chemicals Market Overview
Figure 4. Microelectronics Segment Held Larger Share of Photoresist Process Chemicals Market In 2019
Figure 5. Rest of Europe Dominated the Europe Photoresist Process Chemicals Market In 2019
Figure 6. Europe – Pest Analysis
Figure 7. Photoresist Chemicals Market Impact Analysis of Driver and Restraints
Figure 8. Europe Photoresist Process Chemicals Market Revenue Forecast and Analysis To 2028 (US$ Mn)
Figure 9. Photoresist Chemicals Market Revenue Share, By Product Type (2019 and 2028)
Figure 10. Solvent: Photoresist Chemicals Market Analysis and Forecast to 2028 (US$ Mn)
Figure 11. Binders: Photoresist Chemicals Market Analysis and Forecast to 2028 (US$ Mn)
Figure 12. Sensitizer: Photoresist Chemicals Market Analysis and Forecast to 2028 (US$ Mn)
Figure 13. Others: Photoresist Chemicals Market Analysis and Forecast to 2028 (US$ Mn)
Figure 14. Photoresist Chemicals Market Revenue Share, By Application (2019 and 2028)
Figure 15. Microelectronics: Photoresist Chemicals Market – Revenue and Forecast to 2028 (US$ Mn)
Figure 16. Printed Circuit Board: Photoresist chemicals Market – Revenue and Forecast to 2028 (US$ Mn)
Figure 17. Others: Photoresist Chemicals Market – Revenue and Forecast to 2028 (US$ Mn)
Figure 18. Europe: Photoresist Process Chemicals Market, by Key Country – Revenue (2019) (USD Million)
Figure 19. Europe: Photoresist Chemicals Market Revenue Share, by Key Country (2019 and 2028)
Figure 20. Germany: Photoresist Chemicals Market –Revenue and Forecast to 2028 (US$ Mn)
Figure 21. France: Photoresist Chemicals Market –Revenue and Forecast to 2028 (US$ Mn)
Figure 22. Spain: Photoresist Chemicals Market –Revenue and Forecast to 2028 (US$ Mn)
Figure 23. UK: Photoresist Chemicals Market –Revenue and Forecast to 2028 (US$ Mn)
Figure 24. Russia: Photoresist Chemicals Market –Revenue and Forecast to 2028 (US$ Mn)
Figure 25. Rest of Europe: Photoresist Chemicals Market –Revenue and Forecast to 2028 (US$ Mn)
Figure 26. Impact of COVID-19 Pandemic in Europe Country Markets
- Sumitomo Chemical Co., Ltd.
- Tokyo Ohka Kogyo Co., Ltd.
- Tokuyama Corporation
- DuPont
- Allresist GmbH
- Microchemicals Gmbh
The Insight Partners performs research in 4 major stages: Data Collection & Secondary Research, Primary Research, Data Analysis and Data Triangulation & Final Review.
- Data Collection and Secondary Research:
As a market research and consulting firm operating from a decade, we have published many reports and advised several clients across the globe. First step for any study will start with an assessment of currently available data and insights from existing reports. Further, historical and current market information is collected from Investor Presentations, Annual Reports, SEC Filings, etc., and other information related to company’s performance and market positioning are gathered from Paid Databases (Factiva, Hoovers, and Reuters) and various other publications available in public domain.
Several associations trade associates, technical forums, institutes, societies and organizations are accessed to gain technical as well as market related insights through their publications such as research papers, blogs and press releases related to the studies are referred to get cues about the market. Further, white papers, journals, magazines, and other news articles published in the last 3 years are scrutinized and analyzed to understand the current market trends.
- Primary Research:
The primarily interview analysis comprise of data obtained from industry participants interview and answers to survey questions gathered by in-house primary team.
For primary research, interviews are conducted with industry experts/CEOs/Marketing Managers/Sales Managers/VPs/Subject Matter Experts from both demand and supply side to get a 360-degree view of the market. The primary team conducts several interviews based on the complexity of the markets to understand the various market trends and dynamics which makes research more credible and precise.
A typical research interview fulfils the following functions:
- Provides first-hand information on the market size, market trends, growth trends, competitive landscape, and outlook
- Validates and strengthens in-house secondary research findings
- Develops the analysis team’s expertise and market understanding
Primary research involves email interactions and telephone interviews for each market, category, segment, and sub-segment across geographies. The participants who typically take part in such a process include, but are not limited to:
- Industry participants: VPs, business development managers, market intelligence managers and national sales managers
- Outside experts: Valuation experts, research analysts and key opinion leaders specializing in the electronics and semiconductor industry.
Below is the breakup of our primary respondents by company, designation, and region:

Once we receive the confirmation from primary research sources or primary respondents, we finalize the base year market estimation and forecast the data as per the macroeconomic and microeconomic factors assessed during data collection.
- Data Analysis:
Once data is validated through both secondary as well as primary respondents, we finalize the market estimations by hypothesis formulation and factor analysis at regional and country level.
- 3.1 Macro-Economic Factor Analysis:
We analyse macroeconomic indicators such the gross domestic product (GDP), increase in the demand for goods and services across industries, technological advancement, regional economic growth, governmental policies, the influence of COVID-19, PEST analysis, and other aspects. This analysis aids in setting benchmarks for various nations/regions and approximating market splits. Additionally, the general trend of the aforementioned components aid in determining the market's development possibilities.
- 3.2 Country Level Data:
Various factors that are especially aligned to the country are taken into account to determine the market size for a certain area and country, including the presence of vendors, such as headquarters and offices, the country's GDP, demand patterns, and industry growth. To comprehend the market dynamics for the nation, a number of growth variables, inhibitors, application areas, and current market trends are researched. The aforementioned elements aid in determining the country's overall market's growth potential.
- 3.3 Company Profile:
The “Table of Contents” is formulated by listing and analyzing more than 25 - 30 companies operating in the market ecosystem across geographies. However, we profile only 10 companies as a standard practice in our syndicate reports. These 10 companies comprise leading, emerging, and regional players. Nonetheless, our analysis is not restricted to the 10 listed companies, we also analyze other companies present in the market to develop a holistic view and understand the prevailing trends. The “Company Profiles” section in the report covers key facts, business description, products & services, financial information, SWOT analysis, and key developments. The financial information presented is extracted from the annual reports and official documents of the publicly listed companies. Upon collecting the information for the sections of respective companies, we verify them via various primary sources and then compile the data in respective company profiles. The company level information helps us in deriving the base number as well as in forecasting the market size.
- 3.4 Developing Base Number:
Aggregation of sales statistics (2020-2022) and macro-economic factor, and other secondary and primary research insights are utilized to arrive at base number and related market shares for 2022. The data gaps are identified in this step and relevant market data is analyzed, collected from paid primary interviews or databases. On finalizing the base year market size, forecasts are developed on the basis of macro-economic, industry and market growth factors and company level analysis.
- Data Triangulation and Final Review:
The market findings and base year market size calculations are validated from supply as well as demand side. Demand side validations are based on macro-economic factor analysis and benchmarks for respective regions and countries. In case of supply side validations, revenues of major companies are estimated (in case not available) based on industry benchmark, approximate number of employees, product portfolio, and primary interviews revenues are gathered. Further revenue from target product/service segment is assessed to avoid overshooting of market statistics. In case of heavy deviations between supply and demand side values, all thes steps are repeated to achieve synchronization.
We follow an iterative model, wherein we share our research findings with Subject Matter Experts (SME’s) and Key Opinion Leaders (KOLs) until consensus view of the market is not formulated – this model negates any drastic deviation in the opinions of experts. Only validated and universally acceptable research findings are quoted in our reports.
We have important check points that we use to validate our research findings – which we call – data triangulation, where we validate the information, we generate from secondary sources with primary interviews and then we re-validate with our internal data bases and Subject matter experts. This comprehensive model enables us to deliver high quality, reliable data in shortest possible time.
 Get Free Sample For