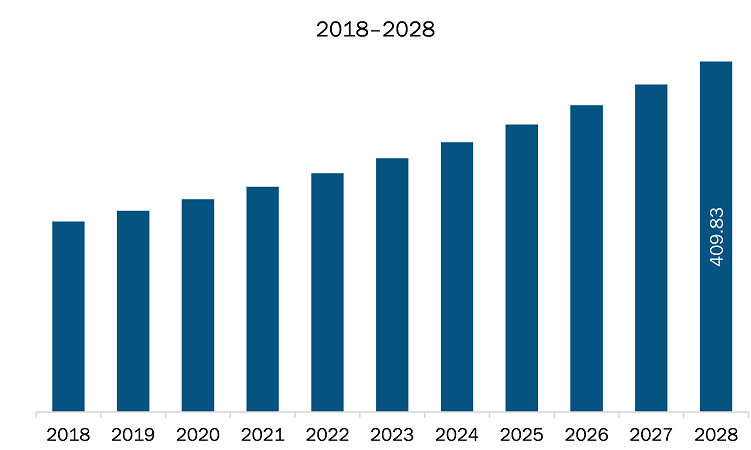
The America manuka honey market in North America is expected to grow US$ 409.83 million by 2028 from US$ 248.74 million in 2020. The market is estimated to grow at a CAGR of 6.4% from 2020 to 2028.
The US, Canada, and Mexico are the major counties in considered in North America. Manuka honey is made from the nectar of the manuka tree and is only produced in Australia and New Zealand. The key active ingredient in manuka honey is methylglyoxal. This is an antibacterial organic compound that can be used for medicine and everyday health benefits. The key behind this is that bacteria cannot become resilient to methylglyoxal like they can to antibiotics, and antibiotic resistant bacteria. Various species of bacteria, such as Streptococcus and Staphylococcus aureus are prone to manuka honey. Manuka honey also appears to be effective against Clostridium difficile, a hard-to-treat bacteria that infects bowel and causes diarrhea. Also, it is said that manuka honey seems to attack infectious bacteria that form a biofilm, or a thin, slippery layer of bacteria for the reason that once an infection has formed a biofilm, it’s measured to be untreatable. Till date, there are no reports or evidence of microbial resistance to honey, which suggests that it might be effective against long-lasting wound infections and resistant organisms that do not heal with regular antibiotic therapy. Additionally, manuka honey is used for skincare purposes as it helps reduce inflammation and irritation associated with acne. Consumers directly apply a thin layer of manuka honey to the affected area of the skin. The rising prevalence of diseases due to unhealthy lifestyle has increased the awareness regarding healthy diets and the prevention of health disorders such as diabetes, stroke, heart diseases, and obesity. An upsurge in the number of people suffering from celiac diseases results in the increasing demand for gluten free products. Consumers are becoming aware about the ill effects associated with gluten consumption; therefore, they are increasingly opting gluten-free products such as manuka honey. Therefore, all these factors are driving the growth of the manuka honey market.The US has the highest number of confirmed cases of coronavirus, as, compared to Canada and Mexico. This is negatively impacting the food and beverages industry in the region as the COVID-19 pandemic negatively affects the supply and distribution chain. The ongoing pandemic has drastically altered the status of the manuka honey industry has negatively impacted the growth of the market. The COVID-19 outbreak has distorted operational efficiency and disrupted the value chains due to the sudden closure of national and international boundaries, creating revenue loss and damage. The disruptive value chain has had a negative impact on raw material supply, which, in turn, is impacting the growth of the manuka honey market. However, as the economies are planning to revive their operations, the demand for manuka honey is expected to rise. Although the focus over just-in-time production is another concerning factor hindering market growth. With the growing consciousness towards health amongst consumers and diversification of application bases in post-pandemic times, the demand for manuka honey is expected to take huge leaps.
With the new features and technologies, companies can attract new customers and expand their footprints in emerging markets. This factor is likely to drive the manuka honey market. The North America manuka honey market is expected to grow at a good CAGR during the forecast period.
- Sample PDF showcases the content structure and the nature of the information with qualitative and quantitative analysis.
- Request discounts available for Start-Ups & Universities
North America Manuka Honey Market Segmentation
- Sample PDF showcases the content structure and the nature of the information with qualitative and quantitative analysis.
- Request discounts available for Start-Ups & Universities
North America Manuka Honey Market – By Nature
- Organic
- Conventional
North America Manuka Honey Market – By Type
- UMF 5+/MGO 83 mg/kg (ppm)
- UMF 10+/MGO 263 mg/kg (ppm)
- UMF 15+/MGO 514 mg/kg (ppm)
- UMF 20+/MGO 829 mg/kg (ppm)
North America Manuka Honey Market – By Distribution Channel
- Supermarkets/Hypermarkets
- Convenience Stores
- Online Stores
- Others
North America Manuka Honey Market, by Country
- US
- Canada
- Mexico
North America Manuka Honey Market -Companies Mentioned
- 100% Pure New Zealand Honey
- Arataki Honey
- Comvita
- Manuka Health
- Oha Honey
- Midlands Holdings
- Capilano Honey Ltd
- Streamland
- Wedderspoon Organic

Report Coverage
Revenue forecast, Company Analysis, Industry landscape, Growth factors, and Trends

Segment Covered
Nature, Type, and Distribution Channel

Regional Scope
North America, Europe, Asia Pacific, Middle East & Africa, South & Central America

Country Scope
US, Canada
TABLE OF CONTENTS
1. Introduction
1.1 Study Scope
1.2 The Insight Partners Research Report Guidance
1.3 Market Segmentation
2. Key Takeaways
3. Research Methodology
3.1 Scope of the Study
3.2 Research Methodology
3.2.1 Data Collection
3.2.2 Primary Interviews
3.2.3 Hypothesis Formulation
3.2.4 Macro-economic Factor Analysis
3.2.5 Developing Base Number
3.2.6 Data Triangulation
3.2.7 Country Level Data
4. North America Manuka Honey Market Landscape
4.1 Market Overview
4.2 PEST Analysis
4.3 Expert Opinion
5. North America Manuka Honey Market – Key Market Dynamics
5.1 Market Drivers
5.1.1 Healthcare Benefits Associated with Manuka Honey
5.1.2 Raising Use of Manuka Honey for Medical Purposes
5.2 Market Restraints
5.2.1 High Cost Associated with Manuka Honey
5.3 Market Opportunities
5.3.1 Augmented Demand from Different Applications
5.4 Future Trends
5.4.1 Growing Adoption of Self-Grooming Products
5.5 Impact Analysis of Drivers and Restraints
6. North America Manuka Honey – Market Analysis
6.1 Manuka Honey Market Overview
6.2 North America Manuka Honey Market –Revenue and Forecast to 2028 (US$ Million)
7. North America Manuka Honey Market Analysis – By Nature
7.1 Overview
7.2 North America Manuka Honey Market Breakdown, By Nature, 2019 & 2028
7.3 Organic
7.3.1 Overview
7.3.2 Organic: North America Manuka Honey Market, Revenue and Forecast to 2028 (US$ Million)
7.4 Conventional
7.4.1 Overview
7.4.2 Conventional: North America Manuka Honey Market, Revenue and Forecast to 2028 (US$ Million)
8. North America Manuka Honey Market Analysis – By Type
8.1 Overview
8.2 North America Manuka Honey Market Breakdown, By Type, 2019 & 2028
8.3 UMF 5+/MGO 83 mg/kg (ppm)
8.3.1 Overview
8.3.2 UMF 5+/MGO 83 mg/kg (ppm): North America Manuka Honey Market, Revenue and Forecast to 2028 (US$ Million)
8.4 UMF 10+/MGO 263 mg/kg (ppm)
8.4.1 Overview
8.4.2 UMF 10+/MGO 263 mg/kg (ppm): North America Manuka Honey Market, Revenue and Forecast to 2028 (US$ Million)
8.5 UMF 15+/MGO 514 mg/kg (ppm)
8.5.1 Overview
8.5.2 UMF 15+/MGO 514 mg/kg (ppm): North America Manuka Honey Market, Revenue and Forecast to 2028 (US$ Million)
8.6 UMF 20+/MGO 829 mg/kg (ppm)
8.6.1 Overview
8.6.2 UMF 20+/MGO 829 mg/kg (ppm): North America Manuka Honey Market, Revenue and Forecast to 2028 (US$ Million)
9. North America Manuka Honey Market Analysis – By Distribution Channel
9.1 Overview
9.2 North America Manuka Honey Market Breakdown, By Distribution Channel, 2019 & 2028
9.3 Supermarkets/ Hypermarkets
9.3.1 Overview
9.3.2 Supermarkets/Hypermarkets: North America Manuka Honey Market, Revenue and Forecast to 2028 (US$ Million)
9.4 Convenience Stores
9.4.1 Overview
9.4.2 Convenience Stores: North America Manuka Honey Market, Revenue and Forecast to 2028 (US$ Million)
9.5 Online Stores
9.5.1 Overview
9.5.2 Online Stores: North America Manuka Honey Market, Revenue and Forecast to 2028 (US$ Million)
9.6 Others
9.6.1 Overview
9.6.2 Others: Manuka honey Market – Revenue and Forecast to 2028 (US$ Million)
10. North America Manuka Honey Market – Country Analysis
10.1 Overview
10.1.1 North America: Manuka Honey Market, By Key Country
10.1.1.1 US: Manuka Honey Market – Revenue and Forecast to 2028 (US$ Million)
10.1.1.1.1 US: Manuka Honey Market, By Nature
10.1.1.1.2 US: Manuka Honey Market, By Type
10.1.1.1.3 US: Manuka Honey Market, By Distribution Channel
10.1.1.2 Canada: Manuka Honey Market – Revenue and Forecast to 2028 (US$ Million)
10.1.1.2.1 Canada: Manuka Honey Market, By Nature
10.1.1.2.2 Canada: Manuka Honey Market, By Type
10.1.1.2.3 Canada: Manuka Honey Market, By Distribution Channel
10.1.1.3 Mexico: Manuka Honey Market – Revenue and Forecast to 2028 (US$ Million)
10.1.1.3.1 Mexico: Manuka Honey Market, By Nature
10.1.1.3.2 Mexico: Manuka Honey Market, By Type
10.1.1.3.3 Mexico: Manuka Honey Market, By Distribution Channel
11. Overview- North America Manuka Honey Market Impact of Coronavirus Outbreak
11.1 North America Manuka Honey Market Impact Assessment of COVID-19 Pandemic
11.2 Impact of COVID-19 Pandemic in North American Country Markets
12. Company Profiles
12.1% Pure New Zealand Honey
12.1.1 Key Facts
12.1.2 Business Description
12.1.3 Products and Services
12.1.4 Financial Overview
12.1.5 SWOT Analysis
12.1.6 Key Developments
12.2 Arataki Honey
12.2.1 Key Facts
12.2.2 Business Description
12.2.3 Products and Services
12.2.4 Financial Overview
12.2.5 SWOT Analysis
12.2.6 Key Developments
12.3 Comvita
12.3.1 Key Facts
12.3.2 Business Description
12.3.3 Products and Services
12.3.4 Financial Overview
12.3.5 SWOT Analysis
12.3.6 Key Developments
12.4 Manuka Health
12.4.1 Key Facts
12.4.2 Business Description
12.4.3 Products and Services
12.4.4 Financial Overview
12.4.5 SWOT Analysis
12.4.6 Key Developments
12.5 Oha Honey
12.5.1 Key Facts
12.5.2 Business Description
12.5.3 Products and Services
12.5.4 Financial Overview
12.5.5 SWOT Analysis
12.5.6 Key Developments
12.6 Midlands Holdings
12.6.1 Key Facts
12.6.2 Business Description
12.6.3 Products and Services
12.6.4 Financial Overview
12.6.5 SWOT Analysis
12.6.6 Key Developments
12.7 Capilano Honey Ltd
12.7.1 Key Facts
12.7.2 Business Description
12.7.3 Products and Services
12.7.4 Financial Overview
12.7.5 SWOT Analysis
12.7.6 Key Developments
12.8 Streamland
12.8.1 Key Facts
12.8.2 Business Description
12.8.3 Products and Services
12.8.4 Financial Overview
12.8.5 SWOT Analysis
12.8.6 Key Developments
12.9 Three Peaks Manuka Honey
12.9.1 Key Facts
12.9.2 Business Description
12.9.3 Products and Services
12.9.4 Financial Overview
12.9.5 SWOT Analysis
12.9.6 Key Developments
12.10 Wedderspoon Organic
12.10.1 1.10.1 Key Facts
12.10.2 Business Description
12.10.3 Products and Services
12.10.4 Financial Overview
12.10.5 SWOT Analysis
12.10.6 Key Developments
13. Appendix
13.1 About The Insight Partners
13.2 Word Index
LIST OF TABLES
Table 1. US: Manuka Honey Market, By Nature –Revenue and Forecast to 2028 (US$ Million)
Table 2. US: Manuka Honey Market, By Type –Revenue and Forecast to 2028 (US$ Million)
Table 3. US: Manuka Honey Market, By Distribution Channel–Revenue and Forecast to 2028 (US$ Million)
Table 4. Canada: Manuka Honey Market, By Nature –Revenue and Forecast to 2028 (US$ Million)
Table 5. Canada: Manuka Honey Market, By Type –Revenue and Forecast to 2028 (US$ Million)
Table 6. Canada: Manuka Honey Market, By Distribution Channel–Revenue and Forecast to 2028 (US$ Million)
Table 7. Mexico: Manuka Honey Market, By Nature –Revenue and Forecast to 2028 (US$ Million)
Table 8. Mexico: Manuka Honey Market, By Type –Revenue and Forecast to 2028 (US$ Million)
Table 9. Mexico: Manuka Honey Market, By Distribution Channel–Revenue and Forecast to 2028 (US$ Million)
Table 10. List of Abbreviation
LIST OF FIGURES
Figure 1. North America Manuka Honey Market Segmentation
Figure 2. North America Manuka Honey Market Segmentation – By Country
Figure 3. North America Manuka Honey Market Overview
Figure 4. Conventional Segment Held Largest Share of North America Manuka Honey Market
Figure 5. Supermarkets/Hypermarkets Segment Held Largest Share of North America Manuka Honey Market
Figure 6. US Held Largest Share of North America Manuka Honey Market
Figure 7. North America Manuka Honey Market, Industry Landscape
Figure 8. North America: PEST Analysis
Figure 9. Expert Opinion
Figure 10. Manuka Honey Market Impact Analysis of Drivers and Restraints
Figure 11. North America: Manuka Honey Market – Revenue and Forecast to 2028 (US$ Million)
Figure 12. North America: Manuka Honey Market Revenue Share, By Nature (2019 and 2028)
Figure 13. Organic: North America Manuka Honey Market, Revenue and Forecast to to 2028 (US$ Million)
Figure 14. Conventional: North America Manuka Honey Market, Revenue and Forecast to to 2028 (US$ Million)
Figure 15. North America: Manuka Honey Market Revenue Share, by Type (2019 and 2028)
Figure 16. UMF 5+/MGO 83 mg/kg (ppm): North America Manuka Honey Market, Revenue and Forecast to 2028 (US$ Million)
Figure 17. UMF 10+/MGO 263 mg/kg (ppm): North America Manuka Honey Market, Revenue and Forecast to 2028 (US$ Million)
Figure 18. UMF 15+/MGO 514 mg/kg (ppm): North America Manuka Honey Market, Revenue and Forecast to 2028 (US$ Million)
Figure 19. UMF 20+/MGO 829 mg/kg (ppm).: North America Manuka Honey Market, Revenue and Forecast to 2028 (US$ Million)
Figure 20. North America: Manuka Honey Market Revenue Share, By Distribution Channel (2019 and 2028)
Figure 21. Supermarkets/Hypermarkets: North America Manuka Honey Market, Revenue and Forecast to 2028 (US$ Million)
Figure 22. Convenience Stores: North America Manuka Honey Market, Revenue and Forecast to 2028 (US$ Million)
Figure 23. Online Stores: North America Manuka Honey Market, Revenue and Forecast to 2028 (US$ Million)
Figure 24. Others: Manuka honey Market – Revenue and Forecast to 2028 (US$ Million)
Figure 25. Geographic Overview of North America Manuka Honey Market
Figure 26. North America: Manuka Honey Market Revenue Share, By Key Country (2019 and 2028)
Figure 27. US: Manuka Honey Market – Revenue and Forecast to 2028 (US$ Million)
Figure 28. Canada: Manuka Honey Market – Revenue and Forecast to 2028 (US$ Million)
Figure 29. Mexico: Manuka Honey Market – Revenue and Forecast to 2028 (US$ Million)
- 100% Pure New Zealand Honey
- Arataki Honey
- Comvita
- Manuka Health
- Oha Honey
- Midlands Holdings
- Capilano Honey Ltd
- Streamland
- Wedderspoon Organic
The Insight Partners performs research in 4 major stages: Data Collection & Secondary Research, Primary Research, Data Analysis and Data Triangulation & Final Review.
- Data Collection and Secondary Research:
As a market research and consulting firm operating from a decade, we have published many reports and advised several clients across the globe. First step for any study will start with an assessment of currently available data and insights from existing reports. Further, historical and current market information is collected from Investor Presentations, Annual Reports, SEC Filings, etc., and other information related to company’s performance and market positioning are gathered from Paid Databases (Factiva, Hoovers, and Reuters) and various other publications available in public domain.
Several associations trade associates, technical forums, institutes, societies and organizations are accessed to gain technical as well as market related insights through their publications such as research papers, blogs and press releases related to the studies are referred to get cues about the market. Further, white papers, journals, magazines, and other news articles published in the last 3 years are scrutinized and analyzed to understand the current market trends.
- Primary Research:
The primarily interview analysis comprise of data obtained from industry participants interview and answers to survey questions gathered by in-house primary team.
For primary research, interviews are conducted with industry experts/CEOs/Marketing Managers/Sales Managers/VPs/Subject Matter Experts from both demand and supply side to get a 360-degree view of the market. The primary team conducts several interviews based on the complexity of the markets to understand the various market trends and dynamics which makes research more credible and precise.
A typical research interview fulfils the following functions:
- Provides first-hand information on the market size, market trends, growth trends, competitive landscape, and outlook
- Validates and strengthens in-house secondary research findings
- Develops the analysis team’s expertise and market understanding
Primary research involves email interactions and telephone interviews for each market, category, segment, and sub-segment across geographies. The participants who typically take part in such a process include, but are not limited to:
- Industry participants: VPs, business development managers, market intelligence managers and national sales managers
- Outside experts: Valuation experts, research analysts and key opinion leaders specializing in the electronics and semiconductor industry.
Below is the breakup of our primary respondents by company, designation, and region:

Once we receive the confirmation from primary research sources or primary respondents, we finalize the base year market estimation and forecast the data as per the macroeconomic and microeconomic factors assessed during data collection.
- Data Analysis:
Once data is validated through both secondary as well as primary respondents, we finalize the market estimations by hypothesis formulation and factor analysis at regional and country level.
- 3.1 Macro-Economic Factor Analysis:
We analyse macroeconomic indicators such the gross domestic product (GDP), increase in the demand for goods and services across industries, technological advancement, regional economic growth, governmental policies, the influence of COVID-19, PEST analysis, and other aspects. This analysis aids in setting benchmarks for various nations/regions and approximating market splits. Additionally, the general trend of the aforementioned components aid in determining the market's development possibilities.
- 3.2 Country Level Data:
Various factors that are especially aligned to the country are taken into account to determine the market size for a certain area and country, including the presence of vendors, such as headquarters and offices, the country's GDP, demand patterns, and industry growth. To comprehend the market dynamics for the nation, a number of growth variables, inhibitors, application areas, and current market trends are researched. The aforementioned elements aid in determining the country's overall market's growth potential.
- 3.3 Company Profile:
The “Table of Contents” is formulated by listing and analyzing more than 25 - 30 companies operating in the market ecosystem across geographies. However, we profile only 10 companies as a standard practice in our syndicate reports. These 10 companies comprise leading, emerging, and regional players. Nonetheless, our analysis is not restricted to the 10 listed companies, we also analyze other companies present in the market to develop a holistic view and understand the prevailing trends. The “Company Profiles” section in the report covers key facts, business description, products & services, financial information, SWOT analysis, and key developments. The financial information presented is extracted from the annual reports and official documents of the publicly listed companies. Upon collecting the information for the sections of respective companies, we verify them via various primary sources and then compile the data in respective company profiles. The company level information helps us in deriving the base number as well as in forecasting the market size.
- 3.4 Developing Base Number:
Aggregation of sales statistics (2020-2022) and macro-economic factor, and other secondary and primary research insights are utilized to arrive at base number and related market shares for 2022. The data gaps are identified in this step and relevant market data is analyzed, collected from paid primary interviews or databases. On finalizing the base year market size, forecasts are developed on the basis of macro-economic, industry and market growth factors and company level analysis.
- Data Triangulation and Final Review:
The market findings and base year market size calculations are validated from supply as well as demand side. Demand side validations are based on macro-economic factor analysis and benchmarks for respective regions and countries. In case of supply side validations, revenues of major companies are estimated (in case not available) based on industry benchmark, approximate number of employees, product portfolio, and primary interviews revenues are gathered. Further revenue from target product/service segment is assessed to avoid overshooting of market statistics. In case of heavy deviations between supply and demand side values, all thes steps are repeated to achieve synchronization.
We follow an iterative model, wherein we share our research findings with Subject Matter Experts (SME’s) and Key Opinion Leaders (KOLs) until consensus view of the market is not formulated – this model negates any drastic deviation in the opinions of experts. Only validated and universally acceptable research findings are quoted in our reports.
We have important check points that we use to validate our research findings – which we call – data triangulation, where we validate the information, we generate from secondary sources with primary interviews and then we re-validate with our internal data bases and Subject matter experts. This comprehensive model enables us to deliver high quality, reliable data in shortest possible time.
 Get Free Sample For