The high voltage cable market in Europe is expected to grow from US$ 8.01 Bn in 2018 to US$ 12.49 Bn by the year 2027 with a CAGR of 5.4% from the year 2019 to 2027.
The need for transporting power over long distances for electrifying remote areas and offshore application areas is expected to drive the growth of high-voltage cable market, especially in developing and underdeveloped countries, during the forecast period. Deployment of high voltage cables in remote areas and offshore locations is forecasted to be the upcoming trend in the market. These areas are generally located far away from power infrastructure, which necessitates transportation of power to long distances with minimum power loss. The need for power infrastructure is growing rapidly in remote areas such as coastal areas, hilly areas, and islands. High-voltage cables also find applications in the transportation of power to and from offshore locations, such as wind and solar farms.
During the forecast period of 2019 to 2027, the underground high voltage cable is anticipated to be the largest contributor in the high voltage cable market. However, submarine high voltage cable segment is projected to be the fastest-growing type with the highest CAGR over the forecast period. High voltage underwater cables is, they are invisible and are being hidden below surfaces. Moreover, voltage losses are lower with underground cables than overhead lines. However, most transmission losses transpire within the lower voltage distribution networks. HVUCs are not at risk of storm damage apart from water damage and are far less likely to cause death or injuries due to accidental contact with the lines/cables.
Continuous infrastructural development across Germany, especially in remote and offshore areas, is expected to drive the deployment of high-voltage cables in the country. Moreover, the growing renewable power generation capacity in Germany is anticipated to boost the overall growth of high-voltage cable market during the forecast period. After Germany, Sweden dominated the Europe high voltage cable market. One of the most important and apparent advantages of HVUCs is they are invisible, being hidden below surfaces. Moreover, voltage losses are lower with underground cables than overhead lines. However, most transmission losses transpire within the lower voltage distribution networks. HVUCs are not at risk of storm damage apart from water damage and are far less likely to cause death or injuries due to accidental contact with the lines/cables. Sweden is the largest consumer of renewable energy in the Francean Union. The figure given below highlights the revenue share of the Mexico in the high voltage cable market in the forecast period:
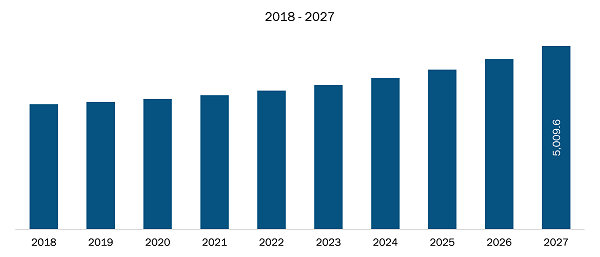
Rest of Europe High Voltage Cable Market Revenue and Forecasts to 2027 (US$ Mn)
- Sample PDF showcases the content structure and the nature of the information with qualitative and quantitative analysis.
- Request discounts available for Start-Ups & Universities
- Sample PDF showcases the content structure and the nature of the information with qualitative and quantitative analysis.
- Request discounts available for Start-Ups & Universities
EUROPE HIGH VOLTAGE CABLE MARKET SEGMENTATION
By Type
- Overhead
- Underground
- Underground
By End User
- Industrial
- Power Utilities
- Oil & Gas
- Mining
- Chemical & petrochemicals
- Others
- Renewable Energy
- Wind Power
- Hydropower
- Others
- Infrastructure
- Commercial
- Industrial
By Country
- Germany
- Italy
- France
- Sweden
- Rest of Europe
High Voltage Cable Market - Companies Mentioned
- Dubai Cable Company – Ducab
- Furukawa Electric Co., Ltd.
- Nexans SA
- NKT A/S
- Prysmian Group (General Cable Corporation)
- Siemens AG
- Southwire Company, LLC
- Sumitomo Electric Industries, Ltd.
- TELE-FONIKA Kable SA (TF Kable)
- ZTT Group

Report Coverage
Revenue forecast, Company Analysis, Industry landscape, Growth factors, and Trends

Segment Covered
Type, & End User

Regional Scope
North America, Europe, Asia Pacific, Middle East & Africa, South & Central America

Country Scope
UK, Germany, France, Italy, Russia
1. Introduction
1.1 Scope of the Study
1.2 The Insight Partners Research Report Guidance
1.3 Market Segmentation
1.3.1 High Voltage Cables Market, by Type
1.3.2 High Voltage Cables Market, by End User
1.3.3 High Voltage Cable Market, by Country
2. Key Takeaways
3. Research Methodology
3.1 Coverage
3.2 Secondary Research
3.3 Primary Research
4. High Voltage Cable Market Landscape
4.1 Overview
4.2 Ecosystem Analysis
4.3 Porter’s Five Forces Analysis
4.3.1 Porter’s five forces analysis
4.3.2 Bargaining Power of Suppliers
4.3.3 Bargaining Power of Buyers
4.3.4 Threat of New Entrants
4.3.5 Threat of Substitutes
4.3.6 Rivalry Among Existing Competitors
5. High-Voltage Cable Market – Key Industry Dynamics
5.1 Drivers
5.1.1 Industrialization and Economic Developments is Stimulating Demand for Electricity
5.1.2 Rising investments in renewable power generation
5.2 Restraints
5.2.1 Uncertainty in prices of conductor materials
5.3 Opportunities
5.3.1 Growing focus on smart grid technology
5.4 Future Trends
5.4.1 Escalating need for power in remote areas and offshore locations
5.5 Impact Analysis of Drivers and Restraints
6. High-Voltage Cable Market – Europe Market Analysis
6.1 High-Voltage Cable Market Overview
6.2 High-Voltage Cable Market Forecast And Analysis
7. High-Voltage Cables Market Analysis – By Type
7.1 Overview
7.2 High-Voltage Cables Market Breakdown, By Type, 2018 & 2027
7.3 Overhead High-Voltage Cables
7.3.1 Overview
7.3.2 Overhead High-Voltage Cables Market Revenue and Forecasts to 2027 (US$ Mn)
7.4 Underground High-Voltage Cables
7.4.1 Overview
7.4.2 Underground High-Voltage Cables Market Revenue and Forecasts to 2027 (US$ Mn)
7.5 Submarine High-Voltage Cables Market
7.5.1 Overview
7.5.2 Submarine High-Voltage Cables Market Revenue and Forecasts to 2027 (US$ Mn)
8. High Voltage Cables Market Analysis – By End User
8.1 Introduction
8.2 High Voltage Cables Market Breakdown, By End User, 2018 & 2027
8.3 Industrial High Voltage Cables Market
8.3.1 Overview
8.3.2 Industrial High Voltage Cables Market Revenue and Forecasts to 2027 (US$ Mn)
8.4 Renewable Energy High Voltage Cables Market
8.4.1 Overview
8.4.2 Global Renewable Energy High Voltage Cables Market Revenue and Forecasts to 2027 (US$ Mn)
8.5 Infrastructure High Voltage Cables Market
8.5.1 Overview
8.5.2 Infrastructure High Voltage Cables Market Revenue and Forecasts to 2027 (US$ Mn)
9. Europe High-Voltage Cable Market– By Country
9.1 Overview
9.1.1 Overview
9.1.2 Europe High-Voltage Cable Market Breakdown, By Key Country
9.1.2.1 Germany High-Voltage Cable Market Revenue and Forecasts to 2027 (US$ MN)
9.1.2.1.1 Germany High-Voltage Cable Market Breakdown, By Type
9.1.2.1.2 Germany High-Voltage Cable Market Breakdown, By End User
9.1.2.2 Italy High-Voltage Cable Market Revenue and Forecasts to 2027 (US$ MN)
9.1.2.2.1 Italy High-Voltage Cable Market Breakdown, By Type
9.1.2.2.2 Italy High-Voltage Cable Market Breakdown, By End User
9.1.2.3 France High-Voltage Cable Market Revenue and Forecasts to 2027 (US$ MN)
9.1.2.3.1 France High-Voltage Cable Market Breakdown, By Type
9.1.2.3.2 France High-Voltage Cable Market Breakdown, By End User
9.1.2.4 Sweden High-Voltage Cable Market Revenue and Forecasts to 2027 (US$ MN)
9.1.2.4.1 Sweden High-Voltage Cable Market Breakdown, By Type
9.1.2.4.2 Sweden High-Voltage Cable Market Breakdown, By End User
9.1.2.5 Rest of Europe High-Voltage Cable Market Revenue and Forecasts to 2027 (US$ MN)
9.1.2.5.1 Rest of Europe High-Voltage Cable Market Breakdown, By Type
9.1.2.5.2 Rest of Europe High-Voltage Cable Market Breakdown, By End User
10. High-Voltage Cable - Industry Landscape
10.1 Overview
10.2 Market Initiative
10.3 Merger and Acquisition
10.4 New Development
11. Company Profiles
11.1 Dubai Cable Company - Ducab
11.1.1 Key Facts
11.1.2 Business Description
11.1.3 Products and Services
11.1.4 Financial Overview
11.1.5 SWOT Analysis
11.1.6 Key Developments
11.2 Furukawa Electric Co., Ltd.
11.2.1 Key Facts
11.2.2 Business Description
11.2.3 Products and Services
11.2.4 Financial Overview
11.2.5 SWOT Analysis
11.2.6 Key Developments
11.3 Nexans SA
11.3.1 Key Facts
11.3.2 Business Description
11.3.3 Products and Services
11.3.4 Financial Overview
11.3.5 SWOT Analysis
11.3.6 Key Developments
11.4 NKT A/S
11.4.1 Key Facts
11.4.2 Business Description
11.4.3 Products and Services
11.4.4 Financial Overview
11.4.5 SWOT Analysis
11.4.6 Key Developments
11.5 Prysmian Group (General Cable Corporation)
11.5.1 Key Facts
11.5.2 Business Description
11.5.3 Products and Services
11.5.4 Financial Overview
11.5.5 SWOT Analysis
11.5.6 Key Developments
11.6 Siemens AG
11.6.1 Key Facts
11.6.2 Business Description
11.6.3 Products and Services
11.6.4 Financial Overview
11.6.5 SWOT Analysis
11.6.6 Key Developments
11.7 Southwire Company, LLC
11.7.1 Key Facts
11.7.2 Business Description
11.7.3 Products and Services
11.7.4 Financial Overview
11.7.5 SWOT Analysis
11.7.6 Key Developments
11.8 Sumitomo Electric Industries, Ltd.
11.8.1 Key Facts
11.8.2 Business Description
11.8.3 Products and Services
11.8.4 Financial Overview
11.8.5 SWOT Analysis
11.8.6 Key Developments
11.9 TELE-FONIKA Kable SA (TF Kable)
11.9.1 Key Facts
11.9.2 Business Description
11.9.3 Products and Services
11.9.4 Financial Overview
11.9.5 SWOT Analysis
11.9.6 Key Developments
11.10 ZTT group
11.10.1 Key Facts
11.10.2 Business Description
11.10.3 Products and Services
11.10.4 Financial Overview
11.10.5 SWOT Analysis
11.10.6 Key Developments
12. Appendix
12.1 About The Insight Partners
12.2 Glossary
LIST OF TABLES
Table 1. High-Voltage Cable Market Revenue and Forecasts to 2027 (US$ Mn)
Table 2. APAC High Voltage Cable Market Revenue and Forecast to 2027 – By Type (US$ Mn)
Table 3. Europe High Voltage Cable Market Revenue and Forecast to 2027 – By End User (US$ Mn)
Table 4. Industrial High-Voltage Cable Market Revenue and Forecast To 2027 (US$ Mn)
Table 5. Global Renewable High-Voltage Cable Market Revenue and Forecast To 2027 (US$ Mn)
Table 6. Infrastructure High-Voltage Cable Market Revenue and Forecast To 2027 (US$ Mn)
Table 7. Germany High-Voltage Cable Market Revenue and Forecast To 2027 – By Type (US$ Mn)
Table 8. Germany High-Voltage Cable Market Revenue and Forecast To 2027 – By End User (US$ Mn)
Table 9. Germany High-Voltage Cable Market Revenue and Forecast To 2027, By Industrial (US$ Mn)
Table 10. Germany High-Voltage Cable Market Revenue and Forecast To 2027, By Renewable (US$ Mn)
Table 11. Germany High-Voltage Cable Market Revenue and Forecast To 2027, By Infrastructure (US$ Mn)
Table 12. Italy High-Voltage Cable Market Revenue and Forecast To 2027 – By Type (US$ Mn)
Table 13. Italy High-Voltage Cable Market Revenue and Forecast To 2027 – By End User (US$ Mn)
Table 14. Italy High-Voltage Cable Market Revenue and Forecast To 2027, By Industrial (US$ Mn)
Table 15. Italy High-Voltage Cable Market Revenue and Forecast To 2027, By Renewable (US$ Mn)
Table 16. Italy High-Voltage Cable Market Revenue and Forecast To 2027, By Infrastructure (US$ Mn)
Table 17. France High-Voltage Cable Market Revenue and Forecast To 2027 – By Type (US$ Mn)
Table 18. France High-Voltage Cable Market Revenue and Forecast To 2027 – By End User (US$ Mn)
Table 19. France High-Voltage Cable Market Revenue and Forecast To 2027, By Industrial (US$ Mn)
Table 20. France High-Voltage Cable Market Revenue and Forecast To 2027, By Renewable (US$ Mn)
Table 21. France High-Voltage Cable Market Revenue and Forecast To 2027, By Infrastructure (US$ Mn)
Table 22. Sweden High-Voltage Cable Market Revenue and Forecast To 2027 – By Type (US$ Mn)
Table 23. Sweden High-Voltage Cable Market Revenue and Forecast To 2027 – By End User (US$ Mn)
Table 24. Sweden High-Voltage Cable Market Revenue and Forecast To 2027, By Industrial (US$ Mn)
Table 25. Sweden High-Voltage Cable Market Revenue and Forecast To 2027, By Renewable (US$ Mn)
Table 26. Sweden High-Voltage Cable Market Revenue and Forecast To 2027, By Infrastructure (US$ Mn)
Table 27. Rest of Europe High-Voltage Cable Market Revenue and Forecast To 2027 – By Type (US$ Mn)
Table 28. Rest of Europe High-Voltage Cable Market Revenue and Forecast To 2027 – By End User (US$ Mn)
Table 29. Rest of Europe High-Voltage Cable Market Revenue and Forecast To 2027, By Industrial (US$ Mn)
Table 30. Rest of Europe High-Voltage Cable Market Revenue and Forecast To 2027, By Renewable (US$ Mn)
Table 31. Rest of Europe High-Voltage Cable Market Revenue and Forecast To 2027, By Infrastructure (US$ Mn)
Table 32. Glossary of Terms, High Voltage Cable
LIST OF FIGURES
Figure 1. High Voltage Cable Market Segmentation
Figure 2. Geographic Segmentation of High-Voltage Cable Market
Figure 3. High Voltage Cable Market Overview
Figure 4. Underground Cable Type Segment held the Largest Share in the Europe High Voltage Cable Market
Figure 5. Industrial End-User Segment held the Largest Share in the Europe High Voltage Cable Market
Figure 6. Ecosystem Analysis, High Voltage Cable Market
Figure 7. Global High-Voltage Cable Market Impact Analysis of Drivers and Restraints
Figure 8. Europe High-Voltage Cable Market Forecast And Analysis, (US$ Mn)
Figure 9. High-Voltage Cables Market Breakdown, By Type, 2018 & 2027 (%)
Figure 10. Overhead High Voltage Cables Market, Revenue and Forecast to 2027 (US$ Mn)
Figure 11. Underground High Voltage Cables Market, Revenue and Forecast to 2027 (US$ Mn)
Figure 12. Global Submarine High-Voltage Cables Market Revenue and Forecasts to 2027 (US$ Mn)
Figure 13. High Voltage Cables Market Breakdown, By Type, 2018 & 2027 (%)
Figure 14. Industrial High Voltage Cables Market, Revenue and Forecast to 2027 (US$ Mn)
Figure 15. Renewable Energy High Voltage Cables Market, Revenue and Forecast to 2027 (US$ Mn)
Figure 16. Infrastructure High Voltage Cables Market Revenue and Forecasts to 2027 (US$ Mn)
Figure 17. Europe High-Voltage Cable Market Breakdown, by Key Countries, 2018 & 2027(%)
Figure 18. Germany High-Voltage Cable Market Revenue and Forecasts to 2027 (US$ MN)
Figure 19. Germany High-Voltage Cable Market Breakdown, by Type, 2018 & 2027 (%)
Figure 20. Germany High-Voltage Cable Market Breakdown, by End User, 2018 & 2027 (%)
Figure 21. Italy High-Voltage Cable Market Revenue and Forecasts to 2027 (US$ MN)
Figure 22. Italy High-Voltage Cable Market Breakdown, by Type, 2018 & 2027 (%)
Figure 23. Italy High-Voltage Cable Market Breakdown, by End User, 2018 & 2027 (%)
Figure 24. France High-Voltage Cable Market Revenue and Forecasts to 2027 (US$ MN)
Figure 25. France High-Voltage Cable Market Breakdown, by Type, 2018 & 2027 (%)
Figure 26. France High-Voltage Cable Market Breakdown, by End User, 2018 & 2027 (%)
Figure 27. Sweden High-Voltage Cable Market Revenue and Forecasts to 2027 (US$ MN)
Figure 28. Sweden High-Voltage Cable Market Breakdown, by Type, 2018 & 2027 (%)
Figure 29. Sweden High-Voltage Cable Market Breakdown, by End User, 2018 & 2027 (%)
Figure 30. Rest of Europe High-Voltage Cable Market Revenue and Forecasts to 2027 (US$ MN)
Figure 31. Rest of Europe High-Voltage Cable Market Breakdown, by Type, 2018 & 2027 (%)
Figure 32. Rest of Europe High-Voltage Cable Market Breakdown, by End User, 2018 & 2027 (%)
The List of Companies
- Dubai Cable Company – Ducab
- Furukawa Electric Co., Ltd.
- Nexans SA
- NKT A/S
- Prysmian Group (General Cable Corporation)
- Siemens AG
- Southwire Company, LLC
- Sumitomo Electric Industries, Ltd.
- TELE-FONIKA Kable SA (TF Kable)
- ZTT Group
The Insight Partners performs research in 4 major stages: Data Collection & Secondary Research, Primary Research, Data Analysis and Data Triangulation & Final Review.
- Data Collection and Secondary Research:
As a market research and consulting firm operating from a decade, we have published many reports and advised several clients across the globe. First step for any study will start with an assessment of currently available data and insights from existing reports. Further, historical and current market information is collected from Investor Presentations, Annual Reports, SEC Filings, etc., and other information related to company’s performance and market positioning are gathered from Paid Databases (Factiva, Hoovers, and Reuters) and various other publications available in public domain.
Several associations trade associates, technical forums, institutes, societies and organizations are accessed to gain technical as well as market related insights through their publications such as research papers, blogs and press releases related to the studies are referred to get cues about the market. Further, white papers, journals, magazines, and other news articles published in the last 3 years are scrutinized and analyzed to understand the current market trends.
- Primary Research:
The primarily interview analysis comprise of data obtained from industry participants interview and answers to survey questions gathered by in-house primary team.
For primary research, interviews are conducted with industry experts/CEOs/Marketing Managers/Sales Managers/VPs/Subject Matter Experts from both demand and supply side to get a 360-degree view of the market. The primary team conducts several interviews based on the complexity of the markets to understand the various market trends and dynamics which makes research more credible and precise.
A typical research interview fulfils the following functions:
- Provides first-hand information on the market size, market trends, growth trends, competitive landscape, and outlook
- Validates and strengthens in-house secondary research findings
- Develops the analysis team’s expertise and market understanding
Primary research involves email interactions and telephone interviews for each market, category, segment, and sub-segment across geographies. The participants who typically take part in such a process include, but are not limited to:
- Industry participants: VPs, business development managers, market intelligence managers and national sales managers
- Outside experts: Valuation experts, research analysts and key opinion leaders specializing in the electronics and semiconductor industry.
Below is the breakup of our primary respondents by company, designation, and region:

Once we receive the confirmation from primary research sources or primary respondents, we finalize the base year market estimation and forecast the data as per the macroeconomic and microeconomic factors assessed during data collection.
- Data Analysis:
Once data is validated through both secondary as well as primary respondents, we finalize the market estimations by hypothesis formulation and factor analysis at regional and country level.
- 3.1 Macro-Economic Factor Analysis:
We analyse macroeconomic indicators such the gross domestic product (GDP), increase in the demand for goods and services across industries, technological advancement, regional economic growth, governmental policies, the influence of COVID-19, PEST analysis, and other aspects. This analysis aids in setting benchmarks for various nations/regions and approximating market splits. Additionally, the general trend of the aforementioned components aid in determining the market's development possibilities.
- 3.2 Country Level Data:
Various factors that are especially aligned to the country are taken into account to determine the market size for a certain area and country, including the presence of vendors, such as headquarters and offices, the country's GDP, demand patterns, and industry growth. To comprehend the market dynamics for the nation, a number of growth variables, inhibitors, application areas, and current market trends are researched. The aforementioned elements aid in determining the country's overall market's growth potential.
- 3.3 Company Profile:
The “Table of Contents” is formulated by listing and analyzing more than 25 - 30 companies operating in the market ecosystem across geographies. However, we profile only 10 companies as a standard practice in our syndicate reports. These 10 companies comprise leading, emerging, and regional players. Nonetheless, our analysis is not restricted to the 10 listed companies, we also analyze other companies present in the market to develop a holistic view and understand the prevailing trends. The “Company Profiles” section in the report covers key facts, business description, products & services, financial information, SWOT analysis, and key developments. The financial information presented is extracted from the annual reports and official documents of the publicly listed companies. Upon collecting the information for the sections of respective companies, we verify them via various primary sources and then compile the data in respective company profiles. The company level information helps us in deriving the base number as well as in forecasting the market size.
- 3.4 Developing Base Number:
Aggregation of sales statistics (2020-2022) and macro-economic factor, and other secondary and primary research insights are utilized to arrive at base number and related market shares for 2022. The data gaps are identified in this step and relevant market data is analyzed, collected from paid primary interviews or databases. On finalizing the base year market size, forecasts are developed on the basis of macro-economic, industry and market growth factors and company level analysis.
- Data Triangulation and Final Review:
The market findings and base year market size calculations are validated from supply as well as demand side. Demand side validations are based on macro-economic factor analysis and benchmarks for respective regions and countries. In case of supply side validations, revenues of major companies are estimated (in case not available) based on industry benchmark, approximate number of employees, product portfolio, and primary interviews revenues are gathered. Further revenue from target product/service segment is assessed to avoid overshooting of market statistics. In case of heavy deviations between supply and demand side values, all thes steps are repeated to achieve synchronization.
We follow an iterative model, wherein we share our research findings with Subject Matter Experts (SME’s) and Key Opinion Leaders (KOLs) until consensus view of the market is not formulated – this model negates any drastic deviation in the opinions of experts. Only validated and universally acceptable research findings are quoted in our reports.
We have important check points that we use to validate our research findings – which we call – data triangulation, where we validate the information, we generate from secondary sources with primary interviews and then we re-validate with our internal data bases and Subject matter experts. This comprehensive model enables us to deliver high quality, reliable data in shortest possible time.
Trends and growth analysis reports related to Europe High Voltage Cable Market

Oct 2019
Smart Casing Running Tools Market
Size and Forecast (2021 - 2031), Global and Regional Share, Trend, and Growth Opportunity Analysis Report Coverage: By Hardware [Remote Display, Sensor Kit (Torque and Tension Sensor, Position Sensor, Data Transmission Sensor, and Others), Head Assembly, Gripping Assembly, Circulator Assembly, Power Supply, and Other Accessories], Software (Inbuilt and Optional), Sales [Direct Sales and Aftermarket (Parts and Accessories and Service and Rental)], Application (Onshore and Offshore), Technology (Fully Automated CRT, Remotely Operated CRT, and Hybrid CRT), and Geography
Oct 2019
Spark Detection System Market
Size and Forecast (2021 - 2031), Global and Regional Share, Trend, and Growth Opportunity Analysis Report Coverage: By Component [Infrared Spark Detection Systems and Ultraviolet (UV) Spark Detection Systems], Application (Wood-Based Panel Industry, Textile Industry, Pulp and Paper Industry, Bioenergy, Food Industry, and Others), and Geography (North America, Europe, Asia Pacific, Middle East and Africa, and South and Central America)
Oct 2019
Remote Access Solution Market
Size and Forecast (2021 - 2031), Global and Regional Share, Trend, and Growth Opportunity Analysis Report Coverage: By Type [Secure Remote Access-VPN, Identity and Access Management (IAM) Solutions, Multi-Factor Authentication, Single Sign-On (SSO), Endpoint Security, and Others], Mode of Deployment (Cloud and On-Premise), End-Use Industry (IT and Telecommunications, BFSI, Healthcare, Government, Manufacturing, and Others), and Geography
Oct 2019
Process Instrumentation Market
Size and Forecast (2021 - 2031), Global and Regional Share, Trend, and Growth Opportunity Analysis Report Coverage: By Technology (Flow Meter, Pressure and Temperature Sensor, Analytical Instrument, and Level Meter), Flow Meter (Mass Flow, EMF, Vortex, Ultrasonic, and Others), Level Meter (High Frequency Radar, TDR, and Others), Application (Oil and Gas, Energy and Power, Water and Wastewater, Food and Beverage, Marine, Petrochemical, Chemical, and Others), and Geography (North America, Europe, Asia Pacific, Middle East and Africa, and South and Central America)
Oct 2019
Hall Effect Teslameter Market
Size and Forecast (2021 - 2031), Global and Regional Share, Trend, and Growth Opportunity Analysis Report Coverage: By Type (Analog Hall Effect Teslameters and Digital Hall Effect Teslameters), End Users (Automotive, Industrial, Healthcare, Aerospace, Laboratory, and Others), and Geography
Oct 2019
Automotive Board to Board Connector Market
Size and Forecast (2021 - 2031), Global and Regional Share, Trend, and Growth Opportunity Analysis Report Coverage: By Type (Pin Headers, Sockets, Floating Connector, and Card Edge Connector), Pin Headers (Stacked Headers and Shrouded Headers), Application (Powertrain Control Systems, Infotainment and Navigation Systems, Advanced Driver Assistance Systems (ADAS), Electric Vehicles (EV) and Hybrid Vehicle Systems, Lighting Control Systems, Autonomous Vehicles, and Others), Pitch (Less Than 1 mm, 1–2 mm, and More Than 2 mm), Number of Pin (2–12 Pin, 13–30 Pin, 31–50 Pin, 51–100 Pin, and 100+ Pin), and Geography
Oct 2019
Radiation Hardened Motor Controller and Motor Drive Market
Size and Forecast (2021 - 2031), Global and Regional Share, Trend, and Growth Opportunity Analysis Report Coverage: By Type (Motor Controller and Motor Drive), Motor Drive (AC Drive, DC Drive, and BLDC), Application (Space Exploration, Military and Defense, Nuclear Power Plants, and Others), and Geography
Oct 2019
Pluggable Optics for Data Center Market
Size and Forecast (2021 - 2031), Global and Regional Share, Trend, and Growth Opportunity Analysis Report Coverage: By Component (Switches, Routers, and Servers), Data Rate (100–400 Gb/s, 400–800 Gb/s, and 800 Gb/s and above), and Geography
 Get Free Sample For