Noninvasive Fat Reduction Market Overview and Growth by 2031
Noninvasive Fat Reduction Market Size and Forecast (2021 - 2031), Global and Regional Share, Trend, and Growth Opportunity Analysis Report Coverage: By Technology (Cryolipolysis, Laser Lipolysis, Ultrasound, and Others), End User (Hospitals, Dermatology Clinics & Cosmetic Clinics, and Others), and Geography (North America, Europe, Asia Pacific, Middle East & Africa, and South & Central America)
- Report Date : Apr 2024
- Report Code : TIPRE00039018
- Category : Life Sciences
- Status : Published
- Available Report Formats :


- No. of Pages : 145
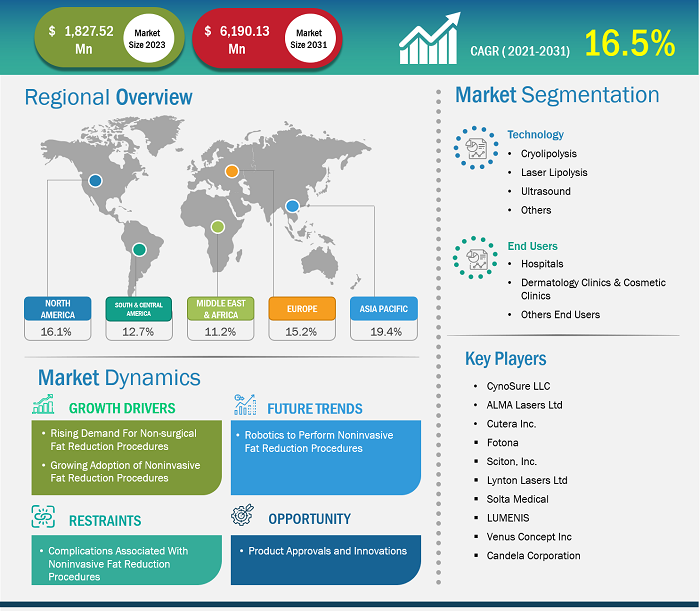
The noninvasive fat reduction market size is projected to grow from US$ 1.8 billion in 2023 to US$ 6.1 billion by 2031; the market is estimated to record a CAGR of 16.5% during 2023–2031. The rising demand for nonsurgical fat reduction procedures propels the noninvasive fat reduction market growth. However, complications associated with noninvasive fat reduction procedures impede the market growth.
Growth Drivers:
Rising Demand for Nonsurgical Fat Reduction Procedures
Nonsurgical fat reduction involves the removal of fat cells from target areas by inducing apoptosis, which can result in the reduction of subcutaneous fat pockets (fat deposited beneath the skin and above the muscle). Nonsurgical fat reduction procedures implement advanced techniques such as cryolipolysis, injection lipolysis, radiofrequency lipolysis, and laser lipolysis.
Fig: Number of Nonsurgical Fat Reduction Procedures–Global and Country-Wise Data
| ||
|
|
|
Global | 730,980 |
|
US | 217,277 | |
Mexico | 27,895 | |
Germany | 11,455 | |
Italy | 9,816 | |
Spain | 7,056 | |
Japan | 122,696 | |
India | 9,600 | |
Brazil | 33,720 | |
Argentina | 55,360 | |
Source: International Society of Aesthetic Plastic Surgery Report
Fig: Number of Nonsurgical Fat Reduction Procedures Performed in 2021 by Age Group
|
|
18 Years or Younger | 24,488 |
19–34 Years | 284,790 |
35–50 Years | 323,166 |
51–64 Years | 87,937 |
65 Years and Older | 10,599 |
Source: International Society of Aesthetic Plastic Surgery Report
Fig: Nonsurgical Fat Reduction Procedures Performed in2021 by Gender
Female | Male |
605,669 | 125,311 |
Source: International Society of Aesthetic Plastic Surgery Report
Customize Research To Suit Your Requirement
We can optimize and tailor the analysis and scope which is unmet through our standard offerings. This flexibility will help you gain the exact information needed for your business planning and decision making.
Noninvasive Fat Reduction Market: Strategic Insights
Market Size Value in US$ 1.8 billion in 2023 Market Size Value by US$ 6.1 billion by 2031 Growth rate CAGR of 16.5% from 2023 to 2031 Forecast Period 2023-2031 Base Year 2021

Mrinal
Have a question?
Mrinal will walk you through a 15-minute call to present the report’s content and answer all queries if you have any.
 Speak to Analyst
Customize Research To Suit Your Requirement
We can optimize and tailor the analysis and scope which is unmet through our standard offerings. This flexibility will help you gain the exact information needed for your business planning and decision making.
Noninvasive Fat Reduction Market: Strategic Insights
| Market Size Value in | US$ 1.8 billion in 2023 |
| Market Size Value by | US$ 6.1 billion by 2031 |
| Growth rate | CAGR of 16.5% from 2023 to 2031 |
| Forecast Period | 2023-2031 |
| Base Year | 2021 |
Mrinal
Have a question?
Mrinal will walk you through a 15-minute call to present the report’s content and answer all queries if you have any.
Speak to Analyst
Report Segmentation and Scope:
The noninvasive fat reduction market analysis has been carried out by considering the following segments: technology and end user.
Segmental Analysis:
By technology, the noninvasive fat reduction market is segmented into cryolipolysis, laser lipolysis, ultrasound, and others. The cryolipolysis segment held the largest noninvasive fat reduction market share in 2023 and is anticipated to register the highest CAGR of 17.8% during 2023–2031. Cryolipolysis, commonly known as "CoolSculpting," is a procedure implemented to break down fat cells by exposing the targeted area to cold temperatures. It is one of the most safe and effective cosmetic procedures performed worldwide for localized fat reduction. The American Society of Plastic Surgeons 2024 report revealed that 450,000 cryolipolysis procedures were performed globally.
Additionally, cryolipolysis is one of the most cost-effective procedures for fat reduction. According to the American Society of Plastic Surgeons (ASPS) report, in 2020, the average "CoolSculpting" procedure cost was between US$ 1,300 and US$ 1,500.
Table: Price Range of Cryolipolysis
| |
|
|
High-End Cost | 4,000 |
Average Cost | 1,376 |
Low-End Cost | 1,000 |
Source: American Society of Plastic Surgeons, February 2022
The table below shows a comparison of the average price of CoolSculpting across different countries––
Table: Average CoolScuplting Cost by Country (Approx.)
|
|
Canada | 750–4,000 |
Mexico | 500–4,000 |
Colombia | 500–2,000 |
UK | 750–4,000 |
Australia | 850–3,500 |
Japan | 1,500–3,500 |
UAE | 500–3,000 |
Source: AEDIT, LLC Company February 2022 Updates from the Website
Cost-effectiveness has, therefore, resulted in a high volume of noninvasive fat reduction procedures performed globally, which, in turn, stimulates the growth of the cryolipolysis segment in the noninvasive fat reduction market.
Noninvasive Fat Reduction Market Trends
Robotics
to Perform Noninvasive Fat Reduction Procedures
Companies are trying to launch technologically advanced, noninvasive, fat-reducing products. Dominion Aesthetic Technologies, Inc.'s EON is one such example. EON includes a programmable articulated robotic arm that uses sensors to map the body's unique topography, providing 100% personalized treatment. Also, the programmable articulated robotic arm understands the body better than other fat contouring machines; it is capable of mapping the entire treatment area, reducing the chances of irregular results and increasing comfort levels. EON is an FDA-cleared product that has been proven safe, effective, and better than laser treatment. Laser treatment targets unwanted fat cells, while EON targets only abdominal fat without causing any harm to the rest of the body, producing effective results. For example, during the apoptosis procedure, EON permanently removes subcutaneous fat cells by delivering consistent and powerful laser energy through the robotic arm, whereas jet impingement ensures a comfortable and safe patient experience. Treatment by EON takes about 20 minutes, with the whole treatment being completed within 60 minutes, requiring no downtime. This treatment time is remarkably short compared to other fat-reduction treatment machines that exist in the market. Therefore, such advanced robotic delivery technologies provide effective fat reduction results and patient safety in the long run. Thus, the use of robotics to perform noninvasive fat reduction procedures acts as a new trend that is likely to boost the noninvasive fat reduction market growth in the coming years.
Regional Analysis:
The scope of the noninvasive fat reduction market report entails North America, Europe, Asia Pacific, South & Central America, and the Middle East & Africa. In 2022, North America held the largest noninvasive fat reduction market share. The US is the largest contributor to the market in North America. Rising consciousness among Americans to improve physical appearance and overall wellness has been observed. Americans adopt body contouring procedures post-bariatric surgeries to sculpt their body in order to improve their overall physique. According to the American Society of Plastic Surgeons 2024 report, approx. 70% of Americans are transitioning toward nonsurgical fat reduction procedures to quickly tackle obesity.
Table: Number of Nonsurgical Fat Reduction Procedures and Nonsurgical Procedures Performed in US
|
|
|
Total Nonsurgical Procedures | 528,527 | 41.1% |
Nonsurgical Fat Reduction | 217,277 |
Source: International Society of Aesthetic Plastic Surgery (ISAPS) report, 2021
The International Society of Aesthetic Plastic Surgery (ISAPS) report further reveals that nonsurgical fat reduction procedures in the US accounted for 29.1% of the total nonsurgical procedures performed in 2021. Among all the nonsurgical fat reduction procedures in the US, “CoolSculpting” is highly adopted.
Table: Average CoolSculpting Procedure Cost in US States (Approx.)
|
|
New York (New York) | 2,000–4,000 |
Chicago (Illinois) | 2,000–4,000 |
Miami (Florida) | 1,000–4,000 |
Austin (Texas) | 1,000–4,000 |
Los Angeles (California) | 1,500–4,000 |
Source: AEDIT, LLC., FEBRUARY 2022 STATS FROM THE WEBSITE
Therefore, the high adoption of “CoolSculpting” procedures for fat reduction among US citizens is the key factor influencing the noninvasive fat reduction market.
Additionally, Canada accounts second largest market share that favors the growth of the noninvasive fat reduction market in North America. Canadians have a positive attitude toward the adoption of medical aesthetics procedures. A survey conducted by Environics Analytics (EA) across Toronto and Vancouver markets, published in May 2023, estimated that over 2.5 million Canadian people are likely to receive noninvasive aesthetic procedures by 2027. These noninvasive aesthetic procedures include injectables to combat aging and wrinkles and the use of dermal filler to restore facial volume by removing excess facial fat. Further, the survey revealed that a notable number of young adults are willing to undergo medical aesthetic procedures. For instance, individuals in the age group between 18 and 29 have shown positive responses to receiving medical aesthetics treatment across Toronto and Vancouver. Additionally, the GFK (an NIQ Company) report revealed that 15% of Canadians are dissatisfied with their physical appearance, of which 4% are unhappy with their looks. These concerns are accelerating the adoption of noninvasive body contouring procedures to remove fat from faces, thighs, arms, and other body parts.
Noninvasive Fat Reduction Market Report Scope
Industry Developments and Future Opportunities:
The noninvasive fat reduction market forecast can help stakeholders in this marketplace plan their growth strategies. As per company press releases, a few strategic developments by leading players operating in the market are listed below:
- In March 2023, CUTERA, INC.'s "truBody" brand is an award-winning product that is clinically proven technologies for a customized, convenient, and complete approach to fat reduction and muscle toning with 15-minute treatment options. The truBody brand's "truSculpt" is intended for fat reduction for muscle toning and is a fast and effective combination approach, allowing practitioners and patients to achieve optimal results.
- In April 2019, Alma Lasers, Inc. announced the launch of the fat transfer system "BeautiFill," the first laser-based system designed to optimize the process, time, and quality of autologous fat transfer for complete aesthetic contouring. The BeautiFill combines laser, suction, and fat processing into one simple allowing physicians to quickly harvest and process high-quality fat for immediate reimplantation to address volume loss.
- In June 2020, Lynton Lasers announced the launch of OANDA Coolwaves—a new smart handpiece to treat the submental area. The submental area is one of the most challenging areas of the neck and head, as the patient's problem is related to either excess fat or skin laxity. Therefore, ONDA's new ergonomic handpiece is designed specifically to optimize the effectiveness in treating the submental area as the Coolwaves technology utilizes a controlled wavelength on the microwave spectrum of 2.45 Ghz to target unwanted deposits of subcutaneous fat and skin laxity.
Competitive Landscape and Key Companies:
Cynosure LLC, Alma Lasers Ltd, Cutera Inc, Fotona, Sciton, Inc., Lynton Lasers Ltd, Solta Medical, Lumenis, Venus Concept Inc, and Candela Corporation are among the prominent companies profiled in the noninvasive fat reduction market report. These companies focus on developing new technologies, upgrading existing products, and expanding their geographic presence to meet the growing consumer demand worldwide.

Report Coverage
Revenue forecast, Company Analysis, Industry landscape, Growth factors, and Trends

Segment Covered
Technology, End User, and Geography

Regional Scope
North America, Europe, Asia Pacific, Middle East & Africa, South & Central America

Country Scope
This text is related
to country scope.
Frequently Asked Questions
The noninvasive fat reduction market majorly consists of the players such Cynosure LLC, Alma Lasers Ltd, Cutera Inc, Fotona, Sciton, Inc., Lynton Lasers Ltd, Solta Medical, Lumenis, Venus Concept Inc, and Candela Corporation, and amongst others.
Global noninvasive fat reduction market is segmented by region into North America, Europe, Asia Pacific, Middle East & Africa and South & Central America. North America held the largest market share of the noninvasive fat reduction market in 2023.
Cynosure LLC and Candela Corporation are the top two companies that hold huge market shares in the noninvasive fat reduction market.
The dermatology & cosmetic clinics segment dominated the global noninvasive fat reduction market and held the largest market share in 2023.
Noninvasive fat reduction includes minimally invasive treatment that selectively break down fat cells in specific areas. Also, the product selectively reduces the size of subcutaneous fat pockets for the obese patients. Also, the patients who are not responsive towards surgical option for body reshaping, non-surgical treatments can prove as the best suitable option that reduces isolated pockets with little or no downtime.
The cryolipolysis segment held the largest share of the market in the global noninvasive fat reduction market and held the largest market share in 2023.
Key factors that are driving the growth of this market are rising demand for nonsurgical fat reduction procedures is expected to boost the market growth for the noninvasive fat reduction over the years.
The CAGR value of the noninvasive fat reduction market during the forecasted period of 2023-2031 is 16.5%.
1. Introduction
1.1 The Insight Partners Research Report Guidance
1.2 Market Segmentation
2. Executive Summary
2.1 Key Insights
3. Research Methodology
3.1 Coverage
3.2 Secondary Research
3.3 Primary Research
4. Noninvasive Fat Reduction Market Landscape
4.1 PEST Analysis
5. Noninvasive Fat Reduction Market – Key Market Dynamics
5.1 Noninvasive Fat Reduction Market – Key Market Dynamics
5.2 Market Drivers
5.2.1 Rising Demand for Non-Surgical Fat Reduction Procedures
5.2.2 Growing Adoption of Noninvasive Fat Reduction Procedures
5.3 Market Restraints
5.3.1 Complications Associated With Noninvasive Fat Reduction Procedures
5.4 Market Opportunities
5.4.1 Product Approvals and Innovations
5.5 Future Trends
5.5.1 Robotics to Perform Noninvasive Fat Reduction Procedures
5.6 Impact of Drivers and Restraints:
6. Noninvasive Fat Reduction Market – Global Market Analysis
6.1 Noninvasive Fat Reduction Market Revenue (US$ Million), 2023–2031
6.1.1 Overview
6.2 Noninvasive Fat Reduction Market – Revenue and Forecast to 2030 (US$ Million)
7. Noninvasive Fat Reduction Market Analysis – by Technology
7.1 Cryolipolysis
7.1.1 Overview
7.1.2 Cryolipolysis: Noninvasive Fat Reduction Market – Revenue and Forecast to 2031 (US$ Million)
7.2 Laser Lipolysis
7.2.1 Overview
7.2.2 Laser Lipolysis: Noninvasive Fat Reduction Market – Revenue and Forecast to 2031 (US$ Million)
7.3 Ultrasound
7.3.1 Overview
7.3.2 Ultrasound: Noninvasive Fat Reduction Market – Revenue and Forecast to 2031 (US$ Million)
7.4 Others
7.4.1 Overview
7.4.2 Others: Noninvasive Fat Reduction Market – Revenue and Forecast to 2031 (US$ Million)
8. Noninvasive Fat Reduction Market Analysis – by End Users
8.1 Hospitals
8.1.1 Overview
8.1.2 Hospitals: Noninvasive Fat Reduction Market – Revenue and Forecast to 2031 (US$ Million)
8.2 Dermatology and Cosmetic Clinics
8.2.1 Overview
8.2.2 Dermatology and Cosmetic Clinics: Noninvasive Fat Reduction Market – Revenue and Forecast to 2031 (US$ Million)
8.3 Other End Users
8.3.1 Overview
8.3.2 Other End Users: Noninvasive Fat Reduction Market – Revenue and Forecast to 2031 (US$ Million)
9. Noninvasive Fat Reduction Market – Geographical Analysis
9.1 Overview
9.2 North America
9.2.1 North America Noninvasive Fat Reduction Market Overview
9.2.2 North America: Noninvasive Fat Reduction Market – Revenue and Forecast to 2031 (US$ Million)
9.2.3 North America: Noninvasive Fat Reduction Market Breakdown, by Technology
9.2.3.1 North America: Noninvasive Fat Reduction Market – Revenue and Forecast Analysis – by Technology
9.2.4 North America: Noninvasive Fat Reduction Market Breakdown, by End Users
9.2.4.1 North America: Noninvasive Fat Reduction Market – Revenue and Forecast Analysis – by End Users
9.2.5 North America: Noninvasive Fat Reduction Market – Revenue and Forecast Analysis – by Country
9.2.5.1 United States: Noninvasive Fat Reduction Market – Revenue and Forecast to 2030 (US$ Million)
9.2.5.1.1 Overview
9.2.5.2 United States: Noninvasive Fat Reduction Market – Revenue and Forecast to 2031 (US$ Million)
9.2.5.2.1 United States: Noninvasive Fat Reduction Market Breakdown, by Technology
9.2.5.2.2 United States: Noninvasive Fat Reduction Market Breakdown, by End Users
9.2.5.3 Canada: Noninvasive Fat Reduction Market – Revenue and Forecast to 2030 (US$ Million)
9.2.5.3.1 Overview
9.2.5.4 Canada: Noninvasive Fat Reduction Market – Revenue and Forecast to 2031 (US$ Million)
9.2.5.4.1 Canada: Noninvasive Fat Reduction Market Breakdown, by Technology
9.2.5.4.2 Canada: Noninvasive Fat Reduction Market Breakdown, by End Users
9.2.5.5 Mexico: Non-Invasive Fat Reduction Market – Revenue and Forecast to 2030 (US$ Million)
9.2.5.5.1 Overview
9.2.5.6 Mexico: Noninvasive Fat Reduction Market – Revenue and Forecast to 2031 (US$ Million)
9.2.5.6.1 Mexico: Noninvasive Fat Reduction Market Breakdown, by Technology
9.2.5.6.2 Mexico: Noninvasive Fat Reduction Market Breakdown, by End Users
9.3 Europe
9.3.1 Europe Noninvasive Fat Reduction Market Overview
9.3.2 Europe: Noninvasive Fat Reduction Market – Revenue and Forecast to 2031 (US$ Million)
9.3.2.1 Europe: Noninvasive Fat Reduction Market – Revenue and Forecast Analysis – by Technology
9.3.2.2 Europe: Noninvasive Fat Reduction Market – Revenue and Forecast Analysis – by End Users
9.3.3 Europe: Noninvasive Fat Reduction Market – Revenue and Forecast Analysis – by Country
9.3.3.1 United Kingdom: Noninvasive Fat Reduction Market – Revenue and Forecast to 2030 (US$ Million)
9.3.3.1.1 Overview
9.3.3.2 United Kingdom: Noninvasive Fat Reduction Market – Revenue and Forecast to 2031 (US$ Million)
9.3.3.2.1 United Kingdom: Noninvasive Fat Reduction Market Breakdown, by Technology
9.3.3.2.2 United Kingdom: Noninvasive Fat Reduction Market Breakdown, by End Users
9.3.3.3 Germany: Noninvasive Fat Reduction Market – Revenue and Forecast to 2030 (US$ Million)
9.3.3.3.1 Overview
9.3.3.4 Germany: Noninvasive Fat Reduction Market – Revenue and Forecast to 2031 (US$ Million)
9.3.3.4.1 Germany: Noninvasive Fat Reduction Market Breakdown, by Technology
9.3.3.4.2 Germany: Noninvasive Fat Reduction Market Breakdown, by End Users
9.3.3.5 France: Noninvasive Fat Reduction Market – Revenue and Forecast to 2030 (US$ Million)
9.3.3.5.1 Overview
9.3.3.6 France: Noninvasive Fat Reduction Market – Revenue and Forecast to 2031 (US$ Million)
9.3.3.6.1 France: Noninvasive Fat Reduction Market Breakdown, by Technology
9.3.3.6.2 France: Noninvasive Fat Reduction Market Breakdown, by End Users
9.3.3.7 Spain: Noninvasive Fat Reduction Market – Revenue and Forecast to 2030 (US$ Million)
9.3.3.7.1 Overview
9.3.3.8 Spain: Noninvasive Fat Reduction Market – Revenue and Forecast to 2031 (US$ Million)
9.3.3.8.1 Spain: Noninvasive Fat Reduction Market Breakdown, by Technology
9.3.3.8.2 Spain: Noninvasive Fat Reduction Market Breakdown, by End Users
9.3.3.9 Italy: Noninvasive Fat Reduction Market – Revenue and Forecast to 2030 (US$ Million)
9.3.3.9.1 Overview
9.3.3.10 Italy: Noninvasive Fat Reduction Market – Revenue and Forecast to 2031 (US$ Million)
9.3.3.10.1 Italy: Noninvasive Fat Reduction Market Breakdown, by Technology
9.3.3.10.2 Italy: Noninvasive Fat Reduction Market Breakdown, by End Users
9.3.3.11 Rest of Europe: Noninvasive Fat Reduction Market – Revenue and Forecast to 2030 (US$ Million)
9.3.3.11.1 Overview
9.3.3.12 Rest of Europe: Noninvasive Fat Reduction Market – Revenue and Forecast to 2031 (US$ Million)
9.3.3.13 Rest of Europe: Noninvasive Fat Reduction Market – Revenue and Forecast to 2030 (US$ Million)
9.3.3.13.1 Overview
9.3.3.14 Rest of Europe: Noninvasive Fat Reduction Market – Revenue and Forecast to 2031 (US$ Million)
9.3.3.14.1 Rest of Europe: Noninvasive Fat Reduction Market Breakdown, by Technology
9.3.3.14.2 Rest of Europe: Noninvasive Fat Reduction Market Breakdown, by End Users
9.4 Asia Pacific
9.4.1 Asia Pacific Noninvasive Fat Reduction Market Overview
9.4.2 Asia Pacific: Noninvasive Fat Reduction Market
9.4.3 Asia Pacific: Noninvasive Fat Reduction Market Breakdown, by Technology
9.4.4 Asia Pacific: Noninvasive Fat Reduction Market Breakdown, by End Users
9.4.5 Asia Pacific: Noninvasive Fat Reduction Market – Revenue and Forecast Analysis – by Country
9.4.5.1 China: Noninvasive Fat Reduction Market – Revenue and Forecast to 2030 (US$ Million)
9.4.5.1.1 Overview
9.4.5.2 China: Noninvasive Fat Reduction Market – Revenue and Forecast to 2031 (US$ Million)
9.4.5.2.1 China: Noninvasive Fat Reduction Market Breakdown, by Technology
9.4.5.2.2 China: Noninvasive Fat Reduction Market Breakdown, by End Users
9.4.5.3 Japan: Noninvasive Fat Reduction Market – Revenue and Forecast to 2030 (US$ Million)
9.4.5.3.1 Overview
9.4.5.4 Japan: Noninvasive Fat Reduction Market – Revenue and Forecast to 2031 (US$ Million)
9.4.5.4.1 Japan: Noninvasive Fat Reduction Market Breakdown, by Technology
9.4.5.4.2 Japan: Noninvasive Fat Reduction Market Breakdown, by End Users
9.4.5.5 India: Noninvasive Fat Reduction Market – Revenue and Forecast to 2030 (US$ Million)
9.4.5.5.1 Overview
9.4.5.6 India: Noninvasive Fat Reduction Market – Revenue and Forecast to 2031 (US$ Million)
9.4.5.6.1 India: Noninvasive Fat Reduction Market Breakdown, by Technology
9.4.5.6.2 India: Noninvasive Fat Reduction Market Breakdown, by End Users
9.4.5.7 Australia: Noninvasive Fat Reduction Market – Revenue and Forecast to 2030 (US$ Million)
9.4.5.7.1 Overview
9.4.5.8 Australia: Noninvasive Fat Reduction Market – Revenue and Forecast to 2031 (US$ Million)
9.4.5.8.1 Australia: Noninvasive Fat Reduction Market Breakdown, by Technology
9.4.5.8.2 Australia: Noninvasive Fat Reduction Market Breakdown, by End Users
9.4.5.9 South Korea: Noninvasive Fat Reduction Market – Revenue and Forecast to 2030 (US$ Million)
9.4.5.9.1 Overview
9.4.5.10 South Korea: Noninvasive Fat Reduction Market – Revenue and Forecast to 2031 (US$ Million)
9.4.5.10.1 South Korea: Noninvasive Fat Reduction Market Breakdown, by Technology
9.4.5.10.2 South Korea: Noninvasive Fat Reduction Market Breakdown, by End Users
9.4.5.11 Rest of APAC: Noninvasive Fat Reduction Market – Revenue and Forecast to 2030 (US$ Million)
9.4.5.11.1 Overview
9.4.5.12 Rest of APAC: Noninvasive Fat Reduction Market – Revenue and Forecast to 2031 (US$ Million)
9.4.5.12.1 Rest of APAC: Noninvasive Fat Reduction Market Breakdown, by Technology
9.4.5.12.2 Rest of APAC: Noninvasive Fat Reduction Market Breakdown, by End Users
9.5 Middle East and Africa
9.5.1 Middle East and Africa Noninvasive Fat Reduction Market Overview
9.5.2 Middle East and Africa: Noninvasive Fat Reduction Market – Revenue and Forecast to 2031 (US$ Million)
9.5.3 Middle East and Africa: Noninvasive Fat Reduction Market Breakdown, by Technology
9.5.4 Middle East and Africa: Noninvasive Fat Reduction Market Breakdown, by End Users
9.5.5 Middle East and Africa: Noninvasive Fat Reduction Market – Revenue and Forecast Analysis – by Country
9.5.5.1 Saudi Arabia: Noninvasive Fat Reduction Market – Revenue and Forecast to 2030 (US$ Million)
9.5.5.1.1 Overview
9.5.5.2 Saudi Arabia: Noninvasive Fat Reduction Market – Revenue and Forecast to 2031 (US$ Million)
9.5.5.2.1 Saudi Arabia: Noninvasive Fat Reduction Market Breakdown, by Technology
9.5.5.2.2 Saudi Arabia: Noninvasive Fat Reduction Market Breakdown, by End Users
9.5.5.3 South Africa: Noninvasive Fat Reduction Market – Revenue and Forecast to 2030 (US$ Million)
9.5.5.3.1 Overview
9.5.5.4 South Africa: Noninvasive Fat Reduction Market – Revenue and Forecast to 2031 (US$ Million)
9.5.5.4.1 South Africa: Noninvasive Fat Reduction Market Breakdown, by Technology
9.5.5.4.2 South Africa: Noninvasive Fat Reduction Market Breakdown, by End Users
9.5.5.5 United Arab Emirates: Noninvasive Fat Reduction Market – Revenue and Forecast to 2030 (US$ Million)
9.5.5.5.1 Overview
9.5.5.6 United Arab Emirates: Noninvasive Fat Reduction Market – Revenue and Forecast to 2031 (US$ Million)
9.5.5.6.1 United Arab Emirates: Noninvasive Fat Reduction Market Breakdown, by Technology
9.5.5.6.2 United Arab Emirates: Noninvasive Fat Reduction Market Breakdown, by End Users
9.5.5.7 Rest of Middle East and Africa: Noninvasive Fat Reduction Market – Revenue and Forecast to 2030 (US$ Million)
9.5.5.7.1 Overview
9.5.5.8 Rest of Middle East and Africa: Noninvasive Fat Reduction Market – Revenue and Forecast to 2031 (US$ Million)
9.5.5.8.1 Rest of Middle East and Africa: Noninvasive Fat Reduction Market Breakdown, by Technology
9.5.5.8.2 Rest of Middle East and Africa: Noninvasive Fat Reduction Market Breakdown, by End Users
9.6 South and Central America
9.6.1 South and Central America Noninvasive Fat Reduction Market Overview
9.6.2 South and Central America: Noninvasive Fat Reduction Market – Revenue and Forecast to 2031 (US$ Million)
9.6.3 South and Central America: Noninvasive Fat Reduction Market Breakdown, by Technology
9.6.4 South and Central America: Noninvasive Fat Reduction Market Breakdown, by End Users
9.6.5 South and Central America: Noninvasive Fat Reduction Market – Revenue and Forecast Analysis – by Country
9.6.5.1 South and Central America: Noninvasive Fat Reduction Market – Revenue and Forecast Analysis – by Country
9.6.5.2 Brazil: Noninvasive Fat Reduction Market – Revenue and Forecast to 2030 (US$ Million)
9.6.5.2.1 Overview
9.6.5.3 Brazil: Noninvasive Fat Reduction Market – Revenue and Forecast to 2031 (US$ Million)
9.6.5.3.1 Brazil: Noninvasive Fat Reduction Market Breakdown, by Technology
9.6.5.3.2 Brazil: Noninvasive Fat Reduction Market Breakdown, by End Users
9.6.5.4 Argentina: Noninvasive Fat Reduction Market – Revenue and Forecast to 2030 (US$ Million)
9.6.5.4.1 Overview
9.6.5.5 Argentina: Noninvasive Fat Reduction Market – Revenue and Forecast to 2031 (US$ Million)
9.6.5.5.1 Argentina: Noninvasive Fat Reduction Market Breakdown, by Technology
9.6.5.5.2 Argentina: Noninvasive Fat Reduction Market Breakdown, by End Users
9.6.5.6 Rest of South and Central America: Noninvasive Fat Reduction Market – Revenue and Forecast to 2030 (US$ Million)
9.6.5.6.1 Overview
9.6.5.7 Rest of South and Central America: Noninvasive Fat Reduction Market – Revenue and Forecast to 2031 (US$ Million)
9.6.5.7.1 Rest of South and Central America: Noninvasive Fat Reduction Market Breakdown, by Technology
9.6.5.7.2 Rest of South and Central America: Noninvasive Fat Reduction Market Breakdown, by End Users
10. Industry Landscape
10.1 Overview
10.2 Growth Strategies in the Global Non-Invasive Fat Reduction Market
10.3 Organic Developments
10.3.1 Overview
10.4 Inorganic Developments
10.4.1 Overview
11. Company Profiles
11.1 Cynosure LLC
11.1.1 Key Facts
11.1.2 Business Description
11.1.3 Products and Services
11.1.4 Financial Overview
11.1.5 SWOT Analysis
11.1.6 Key Developments
11.2 Alma Lasers Ltd
11.2.1 Key Facts
11.2.2 Business Description
11.2.3 Products and Services
11.2.4 Financial Overview
11.2.5 SWOT Analysis
11.2.6 Key Developments
11.3 Cutera Inc
11.3.1 Key Facts
11.3.2 Business Description
11.3.3 Products and Services
11.3.4 Financial Overview
11.3.5 SWOT Analysis
11.3.6 Key Developments
11.4 Fotona
11.4.1 Key Facts
11.4.2 Business Description
11.4.3 Products and Services
11.4.4 Financial Overview
11.4.5 SWOT Analysis
11.4.6 Key Developments
11.5 Sciton, Inc.
11.5.1 Key Facts
11.5.2 Business Description
11.5.3 Products and Services
11.5.4 Financial Overview
11.5.5 SWOT Analysis
11.5.6 Key Developments
11.6 Lynton Lasers Ltd
11.6.1 Key Facts
11.6.2 Business Description
11.6.3 Products and Services
11.6.4 Financial Overview
11.6.5 SWOT Analysis
11.6.6 Key Developments
11.7 Solta Medical
11.7.1 Key Facts
11.7.2 Business Description
11.7.3 Products and Services
11.7.4 Financial Overview
11.7.5 SWOT Analysis
11.7.6 Key Developments
11.8 Lumenis
11.8.1 Key Facts
11.8.2 Business Description
11.8.3 Products and Services
11.8.4 Financial Overview
11.8.5 SWOT Analysis
11.8.6 Key Developments
11.9 Venus Concept Inc
11.9.1 Key Facts
11.9.2 Business Description
11.9.3 Products and Services
11.9.4 Financial Overview
11.9.5 SWOT Analysis
11.9.6 Key Developments
11.10 Candela Corporation
11.10.1 Key Facts
11.10.2 Business Description
11.10.3 Products and Services
11.10.4 Financial Overview
11.10.5 SWOT Analysis
11.10.6 Key Developments
12. Appendix
12.1 About The Insight Partners
12.2 Glossary of Terms
List of Tables
Table 1. Noninvasive Fat Reduction Market Segmentation
Table 2. Number of Non-Surgical Fat Reduction Procedures––Global and Country-Wise
Table 3. Number of Non-Surgical Fat Reduction Procedures Performed in 2021 by Age Group
Table 4. Non-Surgical Fat Reduction Procedures Performed in2021 by Gender
Table 5. Comparison Table of Surgical and Non-Surgical Fat Reduction Cost
Table 6. Treatment Time for Each Noninvasive Fat Reduction Procedure
Table 7. Price Range of Cryolipolysis
Table 8. Average CoolSculpting Cost by Country
Table 9. North America: Noninvasive Fat Reduction Market – Revenue and Forecast to 2031(US$ Million) – by Technology
Table 10. North America: Noninvasive Fat Reduction Market – Revenue and Forecast to 2031(US$ Million) – by End Users
Table 11. Number of Non-Surgical Fat Reduction Procedures and Non-Surgical Procedures Performed in US
Table 12. Average CoolSculpting Procedure Cost in US States
Table 13. United States: Noninvasive Fat Reduction Market – Revenue and Forecast to 2031(US$ Million) – by Technology
Table 14. United States: Noninvasive Fat Reduction Market – Revenue and Forecast to 2031(US$ Million) – by End Users
Table 15. Average CoolSculpting Procedure Cost in Canada
Table 16. Canada: Noninvasive Fat Reduction Market – Revenue and Forecast to 2031(US$ Million) – by Technology
Table 17. Canada: Noninvasive Fat Reduction Market – Revenue and Forecast to 2031(US$ Million) – by End Users
Table 18. Average CoolSculpting Procedure Cost in Mexico
Table 19. Number of Non-Surgical Fat Reduction Procedures and Total Non-Surgical Procedures Performed in Mexico
Table 20. Mexico: Noninvasive Fat Reduction Market – Revenue and Forecast to 2031(US$ Million) – by Technology
Table 21. Mexico: Noninvasive Fat Reduction Market – Revenue and Forecast to 2031(US$ Million) – by End Users
Table 22. Europe: Noninvasive Fat Reduction Market – Revenue and Forecast to 2031(US$ Million) – by Technology
Table 23. Europe: Noninvasive Fat Reduction Market – Revenue and Forecast to 2031(US$ Million) – by End Users
Table 24. United Kingdom: Noninvasive Fat Reduction Market – Revenue and Forecast to 2031(US$ Million) – by Technology
Table 25. United Kingdom: Noninvasive Fat Reduction Market – Revenue and Forecast to 2031(US$ Million) – by End Users
Table 26. Schön Skincare Center Providing Sculpsure Body Contouring and Fat Reduction Procedure Pricing.
Table 27. Germany: Noninvasive Fat Reduction Market – Revenue and Forecast to 2031(US$ Million) – by Technology
Table 28. Germany: Noninvasive Fat Reduction Market – Revenue and Forecast to 2031(US$ Million) – by End Users
Table 29. Biozen Aesthetic Center’s Cryolipolysis Procedure in Paris
Table 30. France: Noninvasive Fat Reduction Market – Revenue and Forecast to 2031(US$ Million) – by Technology
Table 31. France: Noninvasive Fat Reduction Market – Revenue and Forecast to 2031(US$ Million) – by End Users
Table 32. Spain: Noninvasive Fat Reduction Market – Revenue and Forecast to 2031(US$ Million) – by Technology
Table 33. Spain: Noninvasive Fat Reduction Market – Revenue and Forecast to 2031(US$ Million) – by End Users
Table 34. Italy: Noninvasive Fat Reduction Market – Revenue and Forecast to 2031(US$ Million) – by Technology
Table 35. Italy: Noninvasive Fat Reduction Market – Revenue and Forecast to 2031(US$ Million) – by End Users
Table 36. Dublin Centers Providing Non-Surgical Fat Reduction Procedures with Cost and Products
Table 37. Rest of Europe: Noninvasive Fat Reduction Market – Revenue and Forecast to 2031(US$ Million) – by Technology
Table 38. Rest of Europe: Noninvasive Fat Reduction Market – Revenue and Forecast to 2031(US$ Million) – by End Users
Table 39. Asia Pacific: Noninvasive Fat Reduction Market – Revenue and Forecast to 2031(US$ Million) – by Technology
Table 40. Asia Pacific: Noninvasive Fat Reduction Market – Revenue and Forecast to 2031(US$ Million) – by End Users
Table 41. China: Noninvasive Fat Reduction Market – Revenue and Forecast to 2031(US$ Million) – by Technology
Table 42. China: Noninvasive Fat Reduction Market – Revenue and Forecast to 2031(US$ Million) – by End Users
Table 43. Japan: Noninvasive Fat Reduction Market – Revenue and Forecast to 2031(US$ Million) – by Technology
Table 44. Japan: Noninvasive Fat Reduction Market – Revenue and Forecast to 2031(US$ Million) – by End Users
Table 45. Cost of Non-Surgical Fat Removal in India
Table 46. India: Noninvasive Fat Reduction Market – Revenue and Forecast to 2031(US$ Million) – by Technology
Table 47. India: Noninvasive Fat Reduction Market – Revenue and Forecast to 2031(US$ Million) – by End Users
Table 48. Australia: Noninvasive Fat Reduction Market – Revenue and Forecast to 2031(US$ Million) – by Technology
Table 49. Australia: Noninvasive Fat Reduction Market – Revenue and Forecast to 2031(US$ Million) – by End Users
Table 50. South Korea: Noninvasive Fat Reduction Market – Revenue and Forecast to 2031(US$ Million) – by Technology
Table 51. South Korea: Noninvasive Fat Reduction Market – Revenue and Forecast to 2031(US$ Million) – by End Users
Table 52. Cost Comparison Between Singapore and Thailand Non-Surgical Fat Reduction Procedure
Table 53. Rest of APAC: Noninvasive Fat Reduction Market – Revenue and Forecast to 2031(US$ Million) – by Technology
Table 54. Rest of APAC: Noninvasive Fat Reduction Market – Revenue and Forecast to 2031(US$ Million) – by End Users
Table 55. Middle East and Africa: Noninvasive Fat Reduction Market – Revenue and Forecast to 2031(US$ Million) – by Technology
Table 56. Middle East and Africa: Noninvasive Fat Reduction Market – Revenue and Forecast to 2031(US$ Million) – by End Users
Table 57. Saudi Arabia: Noninvasive Fat Reduction Market – Revenue and Forecast to 2031(US$ Million) – by Technology
Table 58. Saudi Arabia: Noninvasive Fat Reduction Market – Revenue and Forecast to 2031(US$ Million) – by End Users
Table 59. South Africa: Noninvasive Fat Reduction Market – Revenue and Forecast to 2031(US$ Million) – by Technology
Table 60. South Africa: Noninvasive Fat Reduction Market – Revenue and Forecast to 2031(US$ Million) – by End Users
Table 61. United Arab Emirates: Noninvasive Fat Reduction Market – Revenue and Forecast to 2031(US$ Million) – by Technology
Table 62. United Arab Emirates: Noninvasive Fat Reduction Market – Revenue and Forecast to 2031(US$ Million) – by End Users
Table 63. Rest of Middle East and Africa: Noninvasive Fat Reduction Market – Revenue and Forecast to 2031(US$ Million) – by Technology
Table 64. Rest of Middle East and Africa: Noninvasive Fat Reduction Market – Revenue and Forecast to 2031(US$ Million) – by End Users
Table 65. South and Central America: Noninvasive Fat Reduction Market – Revenue and Forecast to 2031(US$ Million) – by Technology
Table 66. South and Central America: Noninvasive Fat Reduction Market – Revenue and Forecast to 2031(US$ Million) – by End Users
Table 67. South and Central America: Noninvasive Fat Reduction Market – Revenue and Forecast to 2031(US$ Million) – by Country
Table 68. Brazil: Noninvasive Fat Reduction Market – Revenue and Forecast to 2031(US$ Million) – by Technology
Table 69. Brazil: Noninvasive Fat Reduction Market – Revenue and Forecast to 2031(US$ Million) – by End Users
Table 70. Evaluation of Non-Surgical Fat Reduction Procedures in Argentina
Table 71. Argentina: Noninvasive Fat Reduction Market – Revenue and Forecast to 2031(US$ Million) – by Technology
Table 72. Argentina: Noninvasive Fat Reduction Market – Revenue and Forecast to 2031(US$ Million) – by End Users
Table 73. Colombia Non-Invasive Fat Reduction Procedure Cost (US$)
Table 74. Rest of South and Central America: Noninvasive Fat Reduction Market – Revenue and Forecast to 2031 (US$ Million) – by Technology
Table 75. Rest of South and Central America: Noninvasive Fat Reduction Market – Revenue and Forecast to 2031 (US$ Million) – by End Users
Table 76. Organic Developments Done by Companies
Table 77. Inorganic Developments Done by Companies
Table 78. Glossary of Terms, Vaccine Adjuvants Market
List of Figures
Figure 1. Noninvasive Fat Reduction Market Segmentation, by Geography
Figure 2. PEST Analysis
Figure 3. Impact Analysis of Drivers and Restraints
Figure 4. Noninvasive Fat Reduction Market Revenue (US$ Million), 2023–2031
Figure 5. Noninvasive Fat Reduction Market, By Geography Forecast Analysis, 2023 & 2031
Figure 6. Noninvasive Fat Reduction Market Share (%) – by Technology (2023 and 2031)
Figure 7. Cryolipolysis: Noninvasive Fat Reduction Market – Revenue and Forecast to 2031 (US$ Million)
Figure 8. Laser Lipolysis: Noninvasive Fat Reduction Market – Revenue and Forecast to 2031 (US$ Million)
Figure 9. Ultrasound: Noninvasive Fat Reduction Market – Revenue and Forecast to 2031 (US$ Million)
Figure 10. Others: Noninvasive Fat Reduction Market – Revenue and Forecast to 2031 (US$ Million)
Figure 11. Noninvasive Fat Reduction Market Share (%) – by End Users (2023 and 2031)
Figure 12. Hospitals: Noninvasive Fat Reduction Market – Revenue and Forecast to 2031 (US$ Million)
Figure 13. Dermatology and Cosmetic Clinics: Noninvasive Fat Reduction Market – Revenue and Forecast to 2031 (US$ Million)
Figure 14. Other End Users: Noninvasive Fat Reduction Market – Revenue and Forecast to 2031 (US$ Million)
Figure 15. Noninvasive Fat Reduction Market Breakdown by Region, 2021 and 2031 (%)
Figure 16. North America: Noninvasive Fat Reduction Market by Key Countries – Revenue (2023) US$ Million
Figure 17. North America: Noninvasive Fat Reduction Market – Revenue and Forecast to 2031(US$ Million)
Figure 18. North America: Noninvasive Fat Reduction Market Breakdown, by Key Countries, 2023 and 2031 (%)
Figure 19. United States: Noninvasive Fat Reduction Market – Revenue and Forecast to 2031(US$ Million)
Figure 20. Canada: Noninvasive Fat Reduction Market – Revenue and Forecast to 2031(US$ Million)
Figure 21. Mexico: Noninvasive Fat Reduction Market – Revenue and Forecast to 2031(US$ Million)
Figure 22. Europe: Noninvasive Fat Reduction Market – Revenue by Key Countries Revenue 2023 (US$ Million)
Figure 23. Europe: Noninvasive Fat Reduction Market – Revenue and Forecast to 2031(US$ Million)
Figure 24. Europe: Noninvasive Fat Reduction Market Breakdown, by Key Countries, 2023 and 2031 (%)
Figure 25. United Kingdom: Noninvasive Fat Reduction Market – Revenue and Forecast to 2031(US$ Million)
Figure 26. Germany: Noninvasive Fat Reduction Market – Revenue and Forecast to 2031(US$ Million)
Figure 27. France: Noninvasive Fat Reduction Market – Revenue and Forecast to 2031(US$ Million)
Figure 28. Spain: Noninvasive Fat Reduction Market – Revenue and Forecast to 2031(US$ Million)
Figure 29. Italy: Noninvasive Fat Reduction Market – Revenue and Forecast to 2031(US$ Million)
Figure 30. Rest of Europe: Noninvasive Fat Reduction Market – Revenue and Forecast to 2031(US$ Million)
Figure 31. Asia Pacific: Noninvasive Fat Reduction Market – Revenue by Key Countries 2023 (US$ Million)
Figure 32. Asia Pacific: Noninvasive Fat Reduction Market – Revenue and Forecast to 2031(US$ Million)
Figure 33. Asia Pacific: Noninvasive Fat Reduction Market Breakdown, by Key Countries, 2023 and 2031 (%)
Figure 34. China: Noninvasive Fat Reduction Market – Revenue and Forecast to 2031(US$ Million)
Figure 35. Japan: Noninvasive Fat Reduction Market – Revenue and Forecast to 2031(US$ Million)
Figure 36. India: Noninvasive Fat Reduction Market – Revenue and Forecast to 2031(US$ Million)
Figure 37. Australia: Noninvasive Fat Reduction Market – Revenue and Forecast to 2031(US$ Million)
Figure 38. South Korea: Noninvasive Fat Reduction Market – Revenue and Forecast to 2031(US$ Million)
Figure 39. Rest of APAC: Noninvasive Fat Reduction Market – Revenue and Forecast to 2031(US$ Million)
Figure 40. Middle East and Africa: Noninvasive Fat Reduction Market by Key Countries – Revenue 2023 (US$ Million)
Figure 41. Middle East and Africa: Noninvasive Fat Reduction Market – Revenue and Forecast to 2031(US$ Million)
Figure 42. Middle East and Africa: Noninvasive Fat Reduction Market Breakdown, by Key Countries, 2023 and 2031 (%)
Figure 43. Saudi Arabia: Noninvasive Fat Reduction Market – Revenue and Forecast to 2031(US$ Million)
Figure 44. South Africa: Noninvasive Fat Reduction Market – Revenue and Forecast to 2031(US$ Million)
Figure 45. United Arab Emirates: Noninvasive Fat Reduction Market – Revenue and Forecast to 2031(US$ Million)
Figure 46. Rest of Middle East and Africa: Noninvasive Fat Reduction Market – Revenue and Forecast to 2031(US$ Million)
Figure 47. South and Central America: Noninvasive Fat Reduction Market by Key Countries – Revenue 2023 (US$ Million)
Figure 48. South and Central America: Noninvasive Fat Reduction Market – Revenue and Forecast to 2031(US$ Million)
Figure 49. South and Central America: Noninvasive Fat Reduction Market Breakdown, by Key Countries, 2023 and 2031 (%)
Figure 50. Brazil: Noninvasive Fat Reduction Market – Revenue and Forecast to 2031(US$ Million)
Figure 51. Argentina: Noninvasive Fat Reduction Market – Revenue and Forecast to 2031(US$ Million)
Figure 52. Rest of South and Central America: Noninvasive Fat Reduction Market – Revenue and Forecast to 2031(US$ Million)
Figure 53. Growth Strategies in the Global Non-Invasive Fat Reduction Market
Yes! We provide a free sample of the report, which includes Report Scope (Table of Contents), report structure, and selected insights to help you assess the value of the full report. Please click on the "Download Sample" button or contact us to receive your copy.
Absolutely - analyst assistance is part of the package. You can connect with our analyst post-purchase to clarify report insights, methodology or discuss how the findings apply to your business needs.
Once your order is successfully placed, you will receive a confirmation email along with your invoice.
• For published reports: You'll receive access to the report within 4-6 working hours via a secured email sent to your email.
• For upcoming reports: Your order will be recorded as a pre-booking. Our team will share the estimated release date and keep you informed of any updates. As soon as the report is published, it will be delivered to your registered email.
We offer customization options to align the report with your specific objectives. Whether you need deeper insights into a particular region, industry segment, competitor analysis, or data cut, our research team can tailor the report accordingly. Please share your requirements with us, and we'll be happy to provide a customized proposal or scope.
The report is available in either PDF format or as an Excel dataset, depending on the license you choose.
The PDF version provides the full analysis and visuals in a ready-to-read format. The Excel dataset includes all underlying data tables for easy manipulation and further analysis.
Please review the license options at checkout or contact us to confirm which formats are included with your purchase.
Our payment process is fully secure and PCI-DSS compliant.
We use trusted and encrypted payment gateways to ensure that all transactions are protected with industry-standard SSL encryption. Your payment details are never stored on our servers and are handled securely by certified third-party processors.
You can make your purchase with confidence, knowing your personal and financial information is safe with us.
Yes, we do offer special pricing for bulk purchases.
If you're interested in purchasing multiple reports, we're happy to provide a customized bundle offer or volume-based discount tailored to your needs. Please contact our sales team with the list of reports you're considering, and we'll share a personalized quote.
Yes, absolutely.
Our team is available to help you make an informed decision. Whether you have questions about the report's scope, methodology, customization options, or which license suits you best, we're here to assist. Please reach out to us at sales@theinsightpartners.com, and one of our representatives will get in touch promptly.
Yes, a billing invoice will be automatically generated and sent to your registered email upon successful completion of your purchase.
If you need the invoice in a specific format or require additional details (such as company name, GST, or VAT information), feel free to contact us, and we'll be happy to assist.
Yes, certainly.
If you encounter any difficulties accessing or receiving your report, our support team is ready to assist you. Simply reach out to us via email or live chat with your order information, and we'll ensure the issue is resolved quickly so you can access your report without interruption.
The Insight Partners performs research in 4 major stages: Data Collection & Secondary Research, Primary Research, Data Analysis and Data Triangulation & Final Review.
- Data Collection and Secondary Research:
As a market research and consulting firm operating from a decade, we have published many reports and advised several clients across the globe. First step for any study will start with an assessment of currently available data and insights from existing reports. Further, historical and current market information is collected from Investor Presentations, Annual Reports, SEC Filings, etc., and other information related to company’s performance and market positioning are gathered from Paid Databases (Factiva, Hoovers, and Reuters) and various other publications available in public domain.
Several associations trade associates, technical forums, institutes, societies and organizations are accessed to gain technical as well as market related insights through their publications such as research papers, blogs and press releases related to the studies are referred to get cues about the market. Further, white papers, journals, magazines, and other news articles published in the last 3 years are scrutinized and analyzed to understand the current market trends.
- Primary Research:
The primarily interview analysis comprise of data obtained from industry participants interview and answers to survey questions gathered by in-house primary team.
For primary research, interviews are conducted with industry experts/CEOs/Marketing Managers/Sales Managers/VPs/Subject Matter Experts from both demand and supply side to get a 360-degree view of the market. The primary team conducts several interviews based on the complexity of the markets to understand the various market trends and dynamics which makes research more credible and precise.
A typical research interview fulfils the following functions:
- Provides first-hand information on the market size, market trends, growth trends, competitive landscape, and outlook
- Validates and strengthens in-house secondary research findings
- Develops the analysis team’s expertise and market understanding
Primary research involves email interactions and telephone interviews for each market, category, segment, and sub-segment across geographies. The participants who typically take part in such a process include, but are not limited to:
- Industry participants: VPs, business development managers, market intelligence managers and national sales managers
- Outside experts: Valuation experts, research analysts and key opinion leaders specializing in the electronics and semiconductor industry.
Below is the breakup of our primary respondents by company, designation, and region:

Once we receive the confirmation from primary research sources or primary respondents, we finalize the base year market estimation and forecast the data as per the macroeconomic and microeconomic factors assessed during data collection.
- Data Analysis:
Once data is validated through both secondary as well as primary respondents, we finalize the market estimations by hypothesis formulation and factor analysis at regional and country level.
- 3.1 Macro-Economic Factor Analysis:
We analyse macroeconomic indicators such the gross domestic product (GDP), increase in the demand for goods and services across industries, technological advancement, regional economic growth, governmental policies, the influence of COVID-19, PEST analysis, and other aspects. This analysis aids in setting benchmarks for various nations/regions and approximating market splits. Additionally, the general trend of the aforementioned components aid in determining the market's development possibilities.
- 3.2 Country Level Data:
Various factors that are especially aligned to the country are taken into account to determine the market size for a certain area and country, including the presence of vendors, such as headquarters and offices, the country's GDP, demand patterns, and industry growth. To comprehend the market dynamics for the nation, a number of growth variables, inhibitors, application areas, and current market trends are researched. The aforementioned elements aid in determining the country's overall market's growth potential.
- 3.3 Company Profile:
The “Table of Contents” is formulated by listing and analyzing more than 25 - 30 companies operating in the market ecosystem across geographies. However, we profile only 10 companies as a standard practice in our syndicate reports. These 10 companies comprise leading, emerging, and regional players. Nonetheless, our analysis is not restricted to the 10 listed companies, we also analyze other companies present in the market to develop a holistic view and understand the prevailing trends. The “Company Profiles” section in the report covers key facts, business description, products & services, financial information, SWOT analysis, and key developments. The financial information presented is extracted from the annual reports and official documents of the publicly listed companies. Upon collecting the information for the sections of respective companies, we verify them via various primary sources and then compile the data in respective company profiles. The company level information helps us in deriving the base number as well as in forecasting the market size.
- 3.4 Developing Base Number:
Aggregation of sales statistics (2020-2022) and macro-economic factor, and other secondary and primary research insights are utilized to arrive at base number and related market shares for 2022. The data gaps are identified in this step and relevant market data is analyzed, collected from paid primary interviews or databases. On finalizing the base year market size, forecasts are developed on the basis of macro-economic, industry and market growth factors and company level analysis.
- Data Triangulation and Final Review:
The market findings and base year market size calculations are validated from supply as well as demand side. Demand side validations are based on macro-economic factor analysis and benchmarks for respective regions and countries. In case of supply side validations, revenues of major companies are estimated (in case not available) based on industry benchmark, approximate number of employees, product portfolio, and primary interviews revenues are gathered. Further revenue from target product/service segment is assessed to avoid overshooting of market statistics. In case of heavy deviations between supply and demand side values, all thes steps are repeated to achieve synchronization.
We follow an iterative model, wherein we share our research findings with Subject Matter Experts (SME’s) and Key Opinion Leaders (KOLs) until consensus view of the market is not formulated – this model negates any drastic deviation in the opinions of experts. Only validated and universally acceptable research findings are quoted in our reports.
We have important check points that we use to validate our research findings – which we call – data triangulation, where we validate the information, we generate from secondary sources with primary interviews and then we re-validate with our internal data bases and Subject matter experts. This comprehensive model enables us to deliver high quality, reliable data in shortest possible time.

Apr 2024
Anesthesia Machines Market
Size and Forecast (2021 - 2034), Global and Regional Share, Trend, and Growth Opportunity Analysis Report Coverage: By Product (Advanced Anesthesia Machines, Basic Anesthesia Machines, and Consumables), Customer (Small Hospitals & Nursing Home, Standalone Hospitals, Tertiary Care Hospitals, and Hospital Chain), End User (Anaesthesiologists, Critical Care Specialists, and Others), and Geography (North America, Europe, Asia Pacific, Middle East and Africa, and South and Central America)
Apr 2024
Hospital at Home Market
Size and Forecast (2021 - 2034), Global and Regional Share, Trend, and Growth Opportunity Analysis Report Coverage: By Component (Equipment & Devices and Software & Services), Service Type (Acute Care at Home, Chronic Disease Management at Home, Post Acute or Transitional Care, Palliative Care and Hospice Care, and Rehabilitation Services), Delivery Mode (Remote Monitoring and Telehealth, In-person Home Visits, and Hybrid Models), Patient Demographic ( Adult Patients and Pediatric Patients), Indication (Cardiovascular Conditions, Respiratory Diseases, Orthopedic and Post-Surgical Recovery, Infectious Diseases, Neurological Rehabilitation, and Others), Care Provider (Hospitals and Health Systems, Home Health Agencies, Primary Care or Physician Groups, and Private HaH Providers), and Geography (North America, Europe, Asia Pacific, Middle East and Africa, and South and Central America)
Apr 2024
MRI-guided Focused Ultrasound Therapy Market
Size and Forecast (2021 - 2034), Global and Regional Share, Trend, and Growth Opportunity Analysis Report Coverage: By Application (Breast Cancer, Prostate Cancer, Liver Cancer, Pancreatic Cancer, Breast Lifting and Aesthetic Application, Nipple and Areola Preservation, Post Surgical Applications, and Others), End User (Healthcare Facilities, Diagnostic Imaging Centers, and Research Centers), and Geography (North America, Europe, Asia Pacific, Middle East and Africa, and South and Central America)
Apr 2024
Drug Delivery Devices Contract Manufacturing Market
Size and Forecast (2021 - 2034), Global and Regional Share, Trend, and Growth Opportunity Analysis Report Coverage: By Device Type (Infusion Devices and Administration Set, Syringes, Inhalers, Autoinjectors, and Pen Injectors), Service Type (Full-device Manufacturing, Sub-assembly and Components, and Materials-specific Services), and Geography (North America, Europe, Asia Pacific, Middle East and Africa, and South and Central America)
Apr 2024
IVD Devices Contract Manufacturing Market
Size and Forecast (2021 - 2034), Global and Regional Share, Trend, and Growth Opportunity Analysis Report Coverage: By Service Type (Full-device Manufacturing, Sub-assembly and Components, and Materials-specific Services), Device Type (IVD consumables, IVD equipment), and Geography (North America, Europe, Asia Pacific, Middle East and Africa, and South and Central America)
Apr 2024
Gene Therapy CDMO Market
Size and Forecast (2021 - 2034), Global and Regional Share, Trend, and Growth Opportunity Analysis Report Coverage: By Service Type (Drug Development and Manufacturing, Testing and Regulatory Services, and Other Service Types), End User (Pharmaceutical Companies, Biopharmaceutical Companies, and Other End Users), and Geography (North America, Europe, Asia Pacific, Middle East and Africa, and South and Central America)
Apr 2024
RT-PCR Market
Size and Forecast (2021 - 2031), Global and Regional Share, Trend, and Growth Opportunity Analysis Report Coverage: By Product (Reagents & Consumables, Instruments, and Software & Services), Application (Research Application, Clinical Application, and Forensic Application), End user (Hospitals and Diagnostic Centers, Pharmaceutical and Biotechnology Companies, Research Laboratories and Academic Institutes, Forensic Laboratories, and Clinical Research Organizations)
Apr 2024
dPCR Market
Size and Forecast (2021 - 2031), Global and Regional Share, Trend, and Growth Opportunity Analysis Report Coverage: By Product (Reagents & Consumables, Instruments, and Software & Services), Application (Research Application, Clinical Application, and Forensic Application), End user (Hospitals and Diagnostic Centers, Pharmaceutical and Biotechnology Companies, Research Laboratories and Academic Institutes, Forensic Laboratories, and Clinical Research Organizations)
 Get Free Sample For