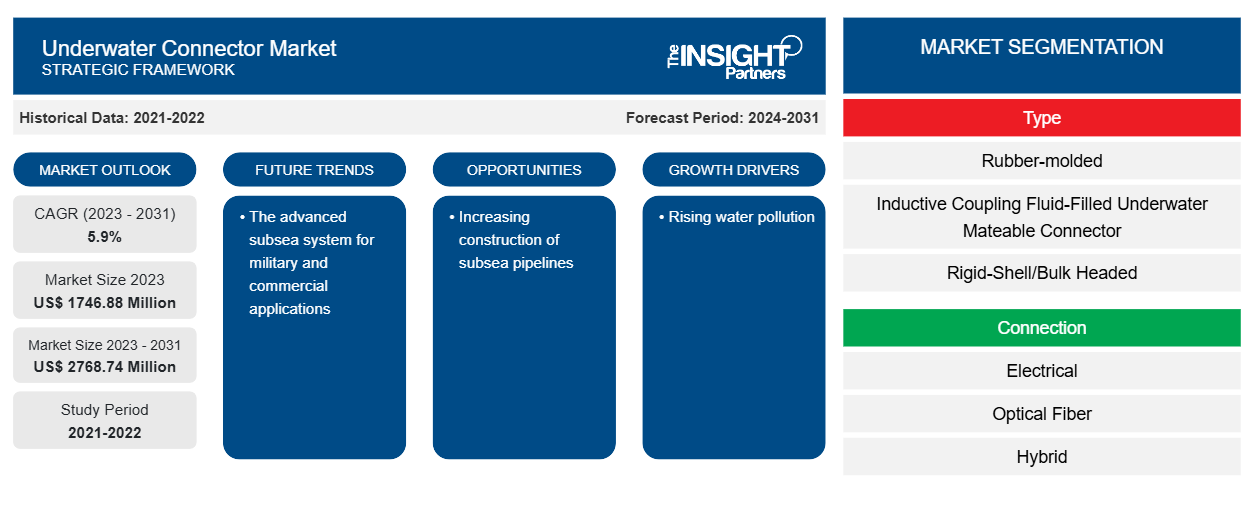
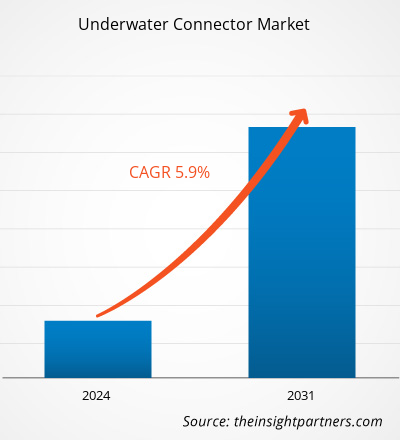
The underwater connector market size is projected to reach US$ 2768.74 million by 2031 from US$ 1746.88 million in 2023. The market is expected to register a CAGR of 5.9% during 2023–2031. The advanced subsea system for military and commercial applications is likely to remain a key trend in the market.
Underwater Connector Market Analysis
With growing government and private investment in R&D activities, underwater connectors are used in oceanographic, offshore, oil and gas, geophysical, defense, and marine applications operated by commercial, research, and defense organizations. To produce new underwater connectors, industries are integrating new technologies and using different raw materials with improved durability and performance under underwater conditions. Several network and carrier firms require high-speed data transmission systems, which demand the use of an advanced undersea cable connector. The demand for underwater cable connectors is increasing as undersea mining, and oil exploration become more common by integrating new technologies.
Underwater Connector Market Overview
Underwater connectors, also known as subsea (electrical) connectors, wet-mate connectors, or marine connectors, are designed to be mated or unmated in wet environments and are capable of withstanding the most extreme environments, from corrosive seawater and pressure to vibration and shock. These connectors find extensive use in underwater applications, such as robotics, subsea oil and gas operations, marine research, and renewable energy systems. They are also useful in moist areas where reliable connections are required. Many connectors are splashproof to an extent, but when the application requires submerging cables or subjecting connection points to significant impacts, this won’t be enough. A waterproof connector is needed to provide the highest possible level of protection.
Customize This Report To Suit Your Requirement
You will get customization on any report - free of charge - including parts of this report, or country-level analysis, Excel Data pack, as well as avail great offers and discounts for start-ups & universities
Underwater Connector Market: Strategic Insights
- Get Top Key Market Trends of this report.This FREE sample will include data analysis, ranging from market trends to estimates and forecasts.
Underwater Connector Market Drivers and Opportunities
Rising water pollution
With the rising water pollution, the demand for underwater connectors is increasing. According to the World Health Organization (WHO), around 2 billion individuals worldwide consume water that is contaminated. Three hundred sixty-eight million individuals use unsafe sources of water. Additionally, 80% of the waste in the water is from the land. Yearly, ocean waste kills almost a million seabirds and marine life. As the country grows and urbanizes, its water bodies are getting toxic. It is estimated that approximately 70% of surface water in India is not suitable for consumption. Daily, almost 40 million litres of wastewater enter rivers and other water bodies with only a small portion being properly treated. A recent World Bank report suggests that pollution upstream decreases the economic growth in downstream areas, reducing GDP growth in these areas by up to a third. Thus, with rising water pollution, the demand for underwater connectors is increasing.
Increasing construction of subsea pipelines
Subsea pipelines are a crucial component of an offshore oil and gas extraction project to transport hydrocarbons. The demand for subsea pipelines is increasing. For instance, in December 2022, STATS Group was commissioned by UAE-headquartered Oil & Gas EPC Contractor National Petroleum Construction Company (NPCC) to provide pipeline isolation, hot tapping and plugging services to the world’s largest diameter subsea pipeline intervention project. The underwater connectors are highly used in these pipelines. Thus, the increasing construction of subsea pipelines is creating more opportunities for the market.
Underwater Connector Market Report Segmentation Analysis
Key segments that contributed to the derivation of the underwater connector market analysis are type, connection, and application.
- Based on the type, the underwater connector market is divided into rubber-molded, inductive coupling fluid-filled underwater mateable connectors and rigid-shell/bulk headed. The rubber-molded segment held a larger market share in 2023.
- By connection, the market is segmented into electrical, optical fiber, and hybrid. The electrical segment held a larger market share in 2023.
- By application, the market is segmented into military & defense, oil & gas, telecommunications, oceanography, ROVs/AUVs, and others.
- By vertical, the market is segmented into government & defense, BFSI, Retail, IT & telecom, healthcare, energy & utilities, education, and others.
Underwater Connector Market Share Analysis by Geography
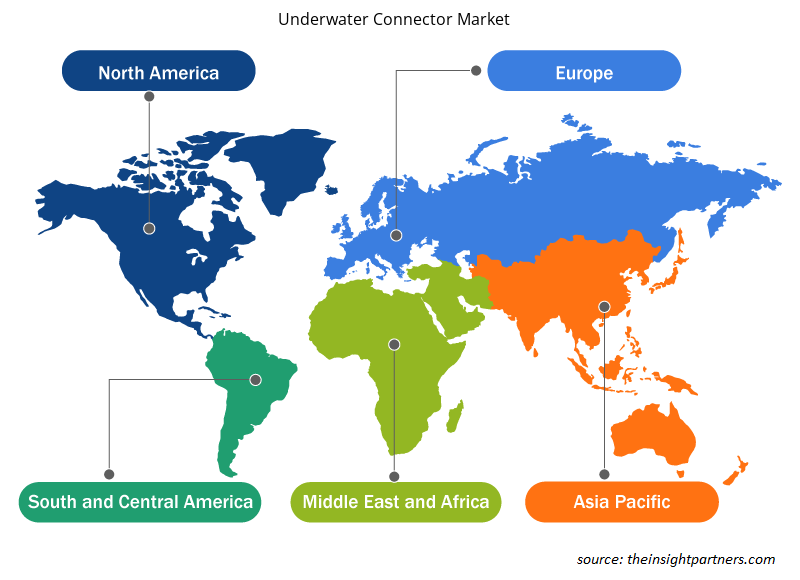
The geographic scope of the underwater connector market report is mainly divided into five regions: North America, Asia Pacific, Europe, Middle East & Africa, and South & Central America.
The increase in oil and gas production in some countries in Europe is contributing to the growth of the underwater connector market. Russia is the largest supplier of natural gas and petroleum to the European Union; however, the Russian and Ukrainian wars are negatively affecting the oil & gas industry, which may slow the growth of the underwater connector market. Furthermore, a shift in business models, such as working from home, is providing an opportunity for the underwater connector market participants.
Underwater Connector Market Regional Insights
The regional trends and factors influencing the Underwater Connector Market throughout the forecast period have been thoroughly explained by the analysts at Insight Partners. This section also discusses Underwater Connector Market segments and geography across North America, Europe, Asia Pacific, Middle East and Africa, and South and Central America.
- Get the Regional Specific Data for Underwater Connector Market
Underwater Connector Market Report Scope
| Report Attribute | Details |
|---|---|
| Market size in 2023 | US$ 1746.88 Million |
| Market Size by 2031 | US$ 2768.74 Million |
| Global CAGR (2023 - 2031) | 5.9% |
| Historical Data | 2021-2022 |
| Forecast period | 2024-2031 |
| Segments Covered |
By Type
|
| Regions and Countries Covered | North America
|
| Market leaders and key company profiles |
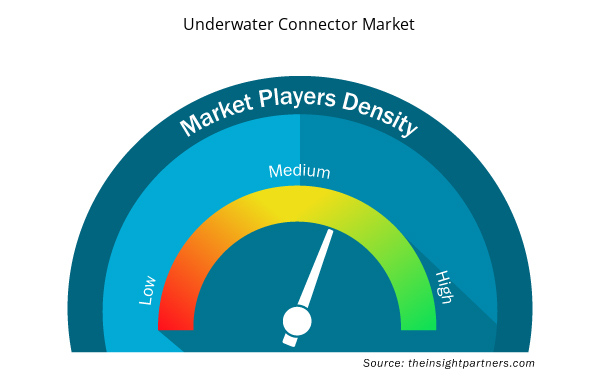
Underwater Connector Market Players Density: Understanding Its Impact on Business Dynamics
The Underwater Connector Market is growing rapidly, driven by increasing end-user demand due to factors such as evolving consumer preferences, technological advancements, and greater awareness of the product's benefits. As demand rises, businesses are expanding their offerings, innovating to meet consumer needs, and capitalizing on emerging trends, which further fuels market growth.
Market players density refers to the distribution of firms or companies operating within a particular market or industry. It indicates how many competitors (market players) are present in a given market space relative to its size or total market value.
Major Companies operating in the Underwater Connector Market are:
- Brins Automates LLC
- Brins Inc.
- Glenair
- AK Industries
- Fishcher Connectors SA
- Gisma Steckverbinder GmbH
Disclaimer: The companies listed above are not ranked in any particular order.
- Get the Underwater Connector Market top key players overview
Underwater Connector Market News and Recent Developments
The underwater connector market is evaluated by gathering qualitative and quantitative data post primary and secondary research, which includes important corporate publications, association data, and databases. A few of the developments in the underwater connector market are listed below:
- MacArtney introduced the space and weight-saving ø12.7 mm SubConn® Nano, which builds on the globally trusted SubConn® design. This new Nano connector offers a versatile and robust performance, making it suitable for multiple applications and the increasingly compact design of underwater instruments, equipment, and systems. (Source: MacArtney, Press Release, March 2024)
- Connector Subsea Solutions (CSS) announced the acquisition of Norvalves AS. The acquisition supplements CSS’ Subsea Distribution portfolio with Norvalves’ range of Topside and Subsea Valves, along with key operational capabilities, including in-house design, engineering, and manufacturing. (Source: PamTen Inc, Press Release, May 2022)
Underwater Connector Market Report Coverage and Deliverables
The “Underwater Connector Market Size and Forecast (2021–2031)” report provides a detailed analysis of the market covering below areas:
- Underwater connector market size and forecast at global, regional, and country levels for all the key market segments covered under the scope
- Underwater connector market trends as well as market dynamics such as drivers, restraints, and key opportunities
- Detailed PEST/Porter’s Five Forces and SWOT analysis
- underwater connector market analysis covering key market trends, global and regional framework, major players, regulations, and recent market developments
- Industry landscape and competition analysis covering market concentration, heat map analysis, prominent players, and recent developments for the filament LED bulb market
- Detailed company profiles
- Historical Analysis (2 Years), Base Year, Forecast (7 Years) with CAGR
- PEST and SWOT Analysis
- Market Size Value / Volume - Global, Regional, Country
- Industry and Competitive Landscape
- Excel Dataset


Report Coverage
Revenue forecast, Company Analysis, Industry landscape, Growth factors, and Trends

Segment Covered
Type, Connection, and Application

Regional Scope
North America, Europe, Asia Pacific, Middle East & Africa, South & Central America

Country Scope
Argentina, Australia, Brazil, Canada, China, France, Germany, India, Italy, Japan, Mexico, Russian Federation, Saudi Arabia, South Africa, South Korea, United Arab Emirates, United Kingdom, United States
Frequently Asked Questions
Which region dominated the underwater connector market in 2023?
APAC dominates the filament LED bulb market.
What are the driving factors impacting the filament LED bulb market?
Rising water pollution and Increasing construction of subsea pipelines are the major factors that propel the global filament LED bulb market.
What are the future trends of the filament LED bulb market?
The advanced subsea system for military and commercial applications is anticipated to play a significant role in the global underwater connector market in the coming years.
Which are the leading players operating in the filament LED bulb market?
The key players holding majority shares in the global underwater connector market are Brins Automates LLC, Brins Inc., Glenair, AK Industries, Fishcher Connectors SA, Gisma Steckverbinder GmbH, Hydro Group Plc., Marshall Underwater Industries, Inc., TE Connectivity, and Teledyne Marine.
What would be the estimated value of the underwater connector market by 2031?
The global underwater connector market is expected to reach US$ 2768.74 million by 2031.
What is the expected CAGR of the filament LED bulb market?
The expected CAGR of the global underwater connector market is 5.9%.
 Get Free Sample For