
航空航天和国防电源连接器市场增长、规模、份额、趋势、关键参与者分析及预测至 2027 年
2027 年航空航天与国防电源连接器市场预测 - COVID-19 影响和全球分析,按额定电流(5-40 安培、>40-80 安培、>80-150 安培、>150-300 安培、>300-600 安培、>600-900 安培);连接器形状(矩形和圆形);应用(航空航天、军用地面车辆、随身设备和海军舰艇)
- 状态 : 已发布
- 报告代码 : TIPRE00010500
- 类别 : 航空航天和国防
- 页数 : 206
- 可用报告格式 :


- 最后更新日期 : June 18, 2024

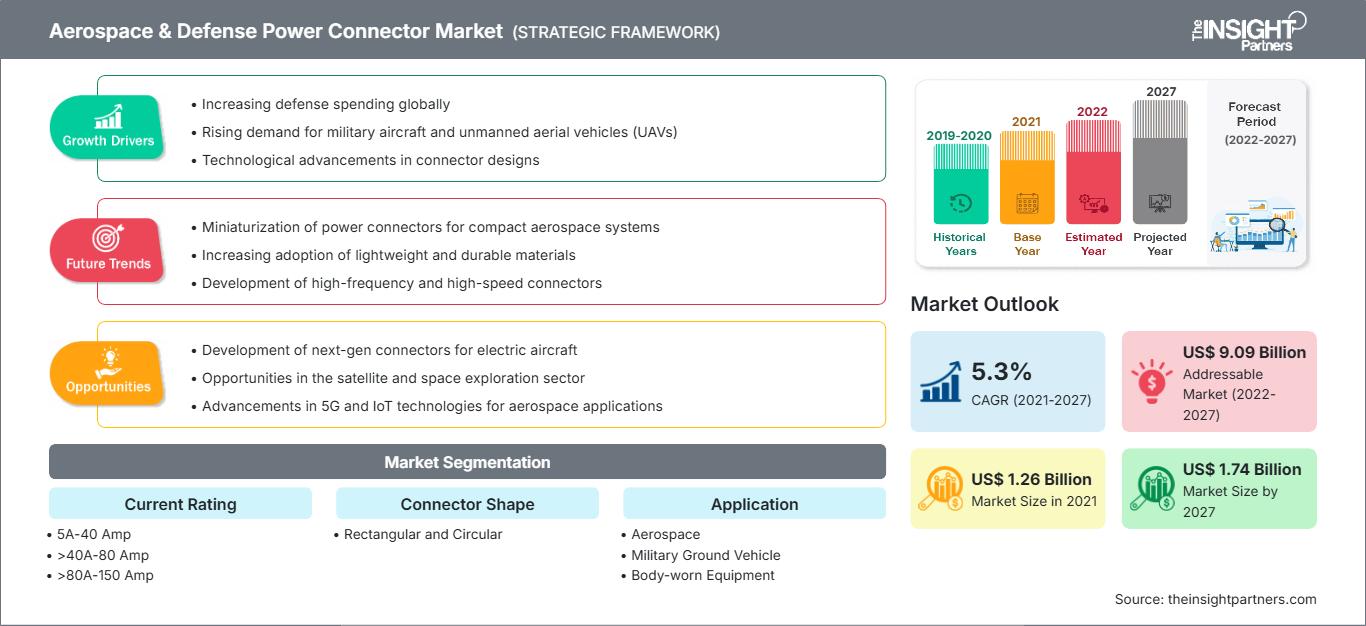
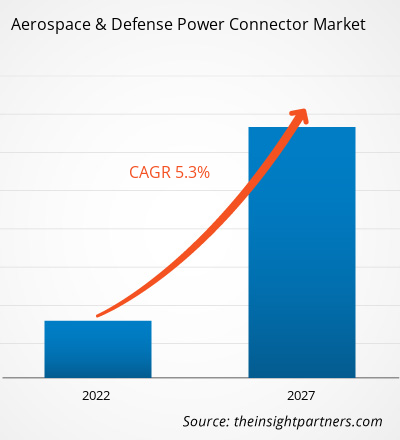
预计航空航天和国防电源连接器市场将从 2021 年的 12.6271 亿美元增长到 2027 年的 17.3778 亿美元。预计航空航天和国防电源连接器市场在 2021 年至 2027 年的预测期内的复合年增长率为 5.3%。
由于全球对商用和军用飞机的需求不断增长,全球飞机制造业正在经历大幅增长。发展中国家可支配收入的不断增长以及波音和空客等顶级企业的存在是推动这些飞机需求的一些因素。在全球范围内,尽管商业航空公司面临着燃油价格不确定和各国其他监管变化等诸多挑战,但预计商用飞机在未来几年仍将保持持续增长。此外,预计在2020年至2027年的预测期内,各国对国防设备的投资不断增加将推动军用飞机的需求。飞机产量的不断增长需要集成发动机控制、航空电子设备、客舱系统和机上娱乐系统等先进设备,而这些系统需要电源连接器来供电。电源连接器的设计符合航空航天和国防标准。预计所有这些因素将刺激不同地区对电源连接器的需求,并为在全球市场上运营的航空航天和国防电源连接器市场参与者提供未来的增长机会。
尽管机器人技术已经发展起来,但飞机生产行业仍然严重依赖体力劳动。在多个国家实施严格的封锁规定之后,飞机制造业在各自的飞机和零部件制造工厂中的劳动力数量显著减少。由于飞机制造业主要集中在北美和欧洲,这两个地区在疫情爆发后面临着保持生产速度的巨大挑战。欧洲国家生产各种飞机零部件、国防设备和车辆。然而,大多数欧洲国家都面临着疫情持续增长的挑战。全球飞机制造商的零部件采购量急剧下降。劳动力短缺是飞机零部件产量下降的原因。
航空航天和国防电源连接器市场已根据额定电流、连接器形状、应用和地域进行了细分。根据额定电流,市场细分为 5Amps 至 40Amps、>40Amps 至 80Amps、>80Amps 至 150Amps、>150Amps 至 300Amps、>300Amps 至 600Amps、>600 至 900Amps。在整个预测期内,5Amps 至 40Amps 细分市场占整体市场的最大份额。根据连接器形状,市场细分为矩形和圆形。根据应用领域,市场细分为航空航天、军用地面车辆、穿戴式设备和海军舰艇。航空航天领域进一步细分为发动机控制系统、航空电子设备、客舱设备和其他。从地理分布来看,市场分为五大区域——北美、欧洲、亚太地区 (APAC)、中东和非洲 (MEA) 以及南美 (SAM)。
自定义此报告以满足您的要求
您将免费获得任何报告的定制,包括本报告的部分内容,或国家级分析、Excel 数据包,以及为初创企业和大学提供超值优惠和折扣
航空航天和国防电源连接器市场: 战略洞察
-
获取本报告的主要市场趋势。这个免费样本将包括数据分析,从市场趋势到估计和预测。
航空航天与国防电源连接器市场洞察刺激士兵现代化需求
>不断升级的战场形势要求军队为士兵配备先进技术。全球各国的军队都高度重视通过高效的防弹衣和个人防护来优化士兵防护。中国和美国等技术先进的国家正在迅速实现武装部队现代化,同时也在先进国防技术的研发上投入巨资。他们还在研究广泛的国防相关技术,如人工智能 (AI)、机器人技术、量子信息科学和生物识别技术。政府非常倾向于在军事和国防装备上投资数十亿美元;例如,根据斯德哥尔摩国际和平研究所 (SIPRI) 的数据,2019 年全球军费开支增至 19170 亿美元,其中包括现有军事力量和活动、武器和装备采购、军事建设、研究和开发以及指挥和支援方面的支出。
基于电流额定值的市场洞察
航空航天和国防电源连接器市场的市场参与者提供不同电流额定值的产品,以满足客户的需求。电源连接器的应用范围更广,每种应用都需要具有不同安培数的不同连接器。航空航天和国防电源连接器市场是军方和国防工业不可或缺的一部分。国防电源连接器市场已根据各种额定电流进行了分析,包括 5 安培至 40 安培、40 安培至 80 安培、80 安培至 150 安培、150 安培至 300 安培、300 安培至 600 安培以及 600 安培至 900 安培。
基于连接器形状的市场洞察
对于电气设备而言,稳定可靠的电源至关重要。选择合适的电源连接器完全取决于应用的性质以及客户的具体要求。从高压版本和特定标准到多样化的设计,电源连接器产品组合提供了广泛实用的选择,可满足用户的个性化应用目标。有各种各样的矩形和圆柱形产品可用于高电流、高功率应用。
基于应用的市场洞察
电源连接器在航空航天和国防领域的各种应用中被广泛使用。电源连接器是飞机、军用地面车辆、海军舰艇和随身设备的重要组成部分。全球大量航空航天和国防承包商的存在使得电源连接器市场参与者能够感受到对其产品的巨大需求,从而催化了航空航天和国防电源连接器市场逐年增长。
航空航天和国防电源连接器市场的参与者专注于市场计划、收购和产品发布等战略,以保持其在航空航天和国防电源连接器市场中的地位。航空航天和国防市场主要参与者的一些发展国防电源连接器市场的主要增长点包括:
2020年2月,阿美特克 (AMETEK) 宣布完成一项重要的密封连接器生产扩张,从而将一年多来一直供不应求的产品的交付周期缩短了约35%。其俄亥俄州和加利福尼亚州工厂的设备、设施和人员均已增加。
2020年7月,雷迪埃 (Radiall) 扩展了其 EPX™ 系列,增加了新款 iEPX 连接器,这是一款重量优化的 EPXB2 断开外壳,具有集成应力消除功能和压入式 EMI 后壳,支持更快、更经济高效地集成到飞机系统中。
航空航天和国防电源连接器市场
The Insight Partners 的分析师已详尽阐述了预测期内影响航空航天与国防电源连接器市场的区域趋势和因素。本节还讨论了北美、欧洲、亚太地区、中东和非洲以及南美和中美洲的航空航天与国防电源连接器市场细分和地域分布。
航空航天与国防电源连接器市场报告范围
| 报告属性 | 细节 |
|---|---|
| 市场规模 2021 | US$ 1.26 Billion |
| 市场规模 2027 | US$ 1.74 Billion |
| 全球复合年增长率 (2021 - 2027) | 5.3% |
| 历史数据 | 2019-2020 |
| 预测期 | 2022-2027 |
| 涵盖的领域 |
By 额定电流
|
| 覆盖地区和国家 |
北美
|
| 市场领导者和主要公司简介 |
|
航空航天与国防电源连接器市场参与者密度:了解其对业务动态的影响
航空航天与国防电源连接器市场正在快速增长,这得益于终端用户需求的不断增长,而这些需求的驱动因素包括消费者偏好的不断变化、技术进步以及对产品优势的认知度不断提高。随着需求的增长,企业正在扩展其产品线,不断创新以满足消费者需求,并抓住新兴趋势,从而进一步推动市场增长。
- 获取 航空航天和国防电源连接器市场 主要参与者概述
- 5Amps 至 40Amps
- >40Amps 至 80Amps
- >80Amps 至 150Amps
- >150Amps 至 300Amps
- >300Amps 至 600Amps
- >600Amps 至 900Amps
航空航天和国防电源连接器市场 - 按连接器形状划分
- 矩形
- 圆形
航空航天和国防电源连接器市场 -
按应用- 航空航天
- 军用地面车辆
- 穿戴式设备
- 海军舰艇
航空航天与国防电源连接器市场 -按地理位置
- 北美
- 美国
- 加拿大
- 墨西哥
- 欧洲
- 法国
- 德国
- 俄罗斯
- 英国
- 意大利
- 欧洲其他地区
- 亚洲太平洋地区(亚太地区)
- 中国
- 印度
- 日本
- 澳大利亚
- 韩国
- 亚太地区其他地区
- 中东和非洲
- 沙特阿拉伯
- 阿联酋
- 南非
- 南非
- 其他地区MEA
- SAM
- 巴西
- SAM 的其余部分
航空航天与航空航天国防电源连接器市场 – 公司简介
- AMETEK. Inc.
- Amphenol Corporation
- Arrow Electronics, Inc.
- Collins Aerospace (Raytheon Technologies Corporation)
- Eaton Corporation plc
- Fischer Connectors SA
- ITT Corporation
- Molex, LLC
- Radiall
- TE Connectivity

Naveen 是一位经验丰富的市场研究和咨询专业人士,在定制项目、联合项目和咨询项目方面拥有超过 9 年的专业经验。他目前担任副总裁,成功管理了项目价值链中的利益相关者,撰写了 100 多份研究报告和 30 多项咨询项目。他的工作涵盖工业和政府项目,为客户的成功和数据驱动的决策做出了重要贡献。
Naveen 拥有卡纳塔克邦 VTU 的电子与通信工程学位,以及马尼帕尔大学的市场营销与运营 MBA 学位。他已担任 IEEE 会员 9 年,积极参与各种会议、技术研讨会,并在分部和地区层面担任志愿者。在此之前,他曾担任 IndustryARC 的助理战略顾问和惠普(惠普全球)的工业服务器顾问。
- 全面的市场规模与预测分析
- 详细的细分市场分析
- 深入的市场动态评估
- 区域及国家级洞察
- 竞争格局与企业对标分析
- 战略性商业情报
客户评价
Insight Partners 的 SCADA 系统市场报告内容全面,对当前趋势和未来预测提供了宝贵的见解。该团队始终高度专业、响应迅速且乐于助人。我们非常满意,强烈推荐他们的服务。
兰·凯德姆 伙伴, Reali Technologies LTD我请求一份关于特定软件市场的报告,团队在几天内就完成了。报告信息非常相关,而且呈现得非常出色。之后,我请求对报告进行一些修改和补充。团队再次迅速响应,不到一周我就收到了最终报告。
让-埃尔韦·詹恩 主席, 未来分析公司我们与 Insight Partners 合作进行了一项重要的市场研究和预测。他们清晰地洞察了机遇和风险,帮助我们制定了计划。他们的研究简单易用,数据可靠,帮助我们做出了明智而自信的决策。我们强烈推荐他们。
皮尤什·纳格帕尔 高级副总裁, 远光全球Insight Partners 凭借其深厚的行业专业知识,提供了富有洞察力、结构合理的市场研究。他们的团队始终专业且响应迅速。用户友好的网站让访问行业报告变得顺畅无阻。我们强烈推荐他们可靠、高质量的研究服务。
安达幸彦 首席执行官, 深蓝有限责任公司这是我第一次从The Insight Partners购买市场报告。起初我有些犹豫,但访问了他们的网站后,我更放心地冒险购买市场报告。我对报告的质量和客户服务非常满意。我对最初的报告有一些疑问和意见,但在与他们的分析师通过电子邮件沟通了几次后,我相信这份报告可以作为我们战略规划流程的参考。非常感谢您抽出宝贵的时间,让这次体验如此愉快。我一定会向其他人推荐你们的服务,当我们需要更多市场数据时,你们将是我的首选。
约翰·铃木 总裁兼首席执行官、董事会董事, BK科技感谢您在处理我关于尼日利亚传染病体外诊断市场信息请求的过程中所展现的支持和专业精神。感谢您的耐心、指导,以及您愿意提供的折扣,最终促成了这笔交易。我期待未来与 Insight Partners 继续合作,这一切都要归功于您与我初次接触后留下的良好印象。
奇吉奥克博士 ONYIA 董事总经理, PineCrest 医疗保健有限公司购买理由
- 明智的决策
- 了解市场动态
- 竞争分析
- 客户洞察
- 市场预测
- 风险规避
- 战略规划
- 投资论证
- 识别新兴市场
- 优化营销策略
- 提升运营效率
- 顺应监管趋势


