汽车制动摩擦产品市场规模、份额及预测(至2034年)
汽车制动摩擦产品市场规模及预测(2021-2034年),全球及区域份额、趋势和增长机会分析报告涵盖范围:按盘片材料(金属、陶瓷和复合材料)、产品类型(制动蹄、制动片、制动衬片、制动盘和鼓式制动器)、车辆类型(乘用车和商用车)以及地理位置划分
- 状态 : 数据发布
- 报告代码 : TIPRE00028378
- 类别 : 汽车和运输
- 页数 : 150
- 可用报告格式 :


- 最后更新日期 : April 09, 2026


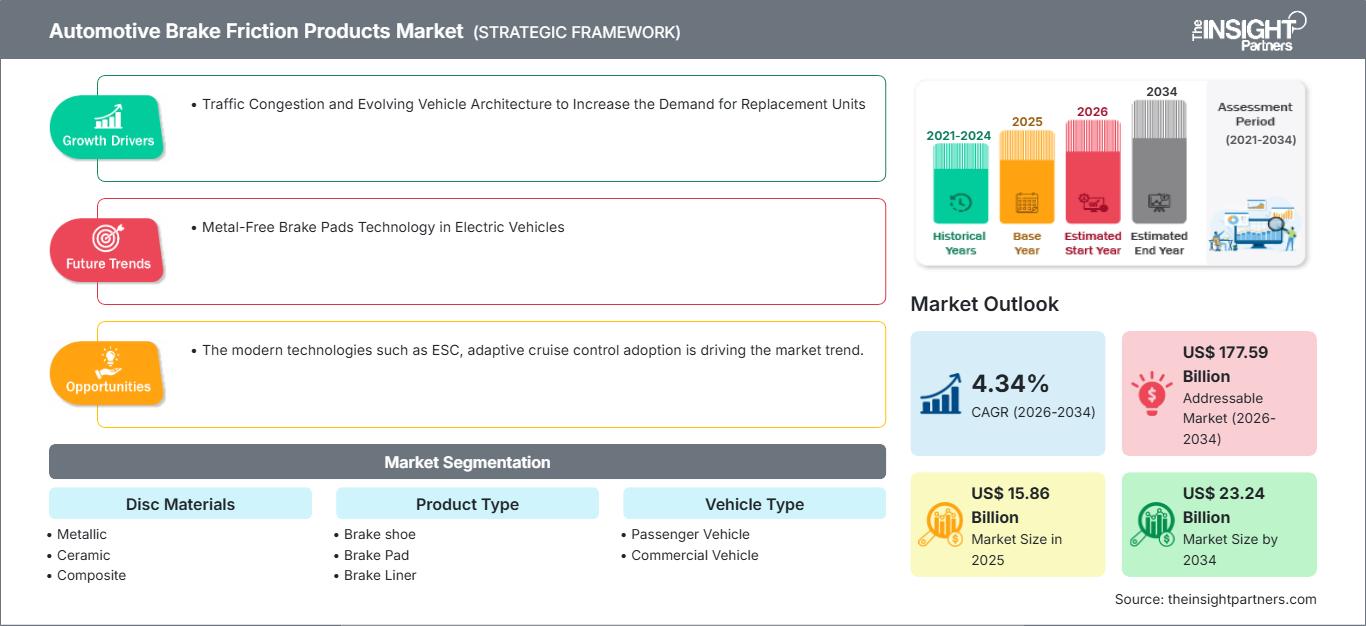
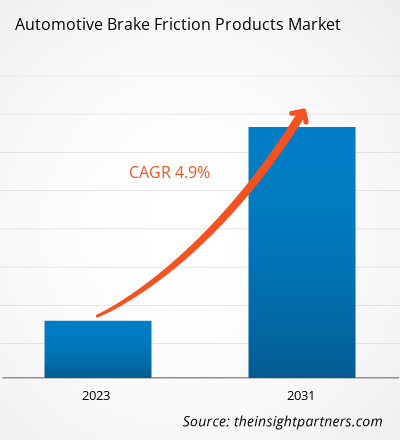
预计到 2034 年,汽车制动摩擦产品市场规模将从 2025 年的 158.6 亿美元增长至 232.4 亿美元。预计在 2026 年至 2034 年的预测期内,该市场将以 4.34% 的复合年增长率增长。
车辆中防抱死制动系统(ABS)技术的日益普及推动了市场增长。电子稳定控制系统(ESC)、自适应巡航控制系统等现代技术的应用也引领了市场趋势,并推动了自动驾驶功能的发展。此外,在印度销售的所有新车都必须配备ABS和电子制动力分配系统(EBD)。
汽车制动摩擦产品市场分析
随着汽车零部件寿命的延长,制动摩擦产品制造商面临着巨大的挑战。原始设备制造商 (OEM) 更倾向于选择持久耐用、摩擦衰减速度慢的制动摩擦产品,这些产品能够有效控制摩擦力,降低磨损、噪音和粗糙度。此外,OEM 和制造商在开发制动摩擦产品时,还会考虑其耐久性,例如抗水冲刷性、宽工作温度范围、制动卡钳组件的清洁装配、抗道路污染物和抗氧化性。近年来,再生制动技术已应用于电池驱动的电动汽车。电动汽车制造商正在采用先进的摩擦产品来确保车辆平稳运行。金属转子盘是电动汽车制造中常用的材料。随着电动汽车销量的增长,由于汽车制动摩擦产品重量更轻、效率更高,预计在预测期内,市场对这类产品的需求将快速增长。因此,随着人们对环保交通方式的需求不断增长,尤其是对电动汽车的需求,汽车制动摩擦产品市场预计将迎来巨大的增长机遇。
汽车制动摩擦产品市场概览
汽车制动摩擦产品市场的增长主要归功于亚太地区主要国家(如印度、中国、印度尼西亚、日本和泰国)汽车产量和销量的不断增长。日本、中国和印度电动汽车产量的增加以及政府日益严格的安全法规正在推动全球汽车制动摩擦产品市场的增长。由于中国汽车产量的增长和电动汽车的快速销售,预计中国将主导全球市场。中国是全球最大的汽车及汽车零部件生产国。因此,中国汽车制动摩擦产品市场正以惊人的速度增长。中国多家汽车制造商致力于开发用于制动摩擦产品的轻量化材料,例如复合材料、碳纤维等。此外,最新款车型中安全功能的日益普及也推动了市场增长。例如,上海汽车制动系统有限公司与华宇汽车系统有限公司和大陆集团成立了一家合资企业,旨在为中国市场供应制动摩擦产品。
根据您的需求定制此报告
获取免费定制服务汽车制动摩擦产品市场:战略洞察
-
获取本报告的主要市场趋势。这份免费样品将包含数据分析,内容涵盖市场趋势、估算和预测等。
汽车制动摩擦产品市场驱动因素和机遇
交通拥堵加剧,汽车零部件更换需求激增,推动市场增长
由于交通拥堵加剧,驾驶过程中刹车的使用频率迅速增加。在交通拥堵的情况下,车辆需要频繁刹车,这会导致刹车蹄片和刹车片磨损,最终降低制动力。制动力的降低进一步推高了刹车蹄片和刹车片的更换需求。交通拥堵导致摩擦式刹车的使用量增加,从而推动了全球汽车摩擦刹车产品市场在预测期内的增长。
电动汽车中的无金属刹车片技术
酚醛复合材料刹车片背板重量减轻75%,惰性,防腐蚀,隔热,并具有电动汽车制动工况所需的卓越阻尼性能。此外,Brakes India于2022年2月推出了高性能“Elite”摩擦刹车片。Brakes India推出了一系列高性能刹车片,旨在提升车辆在高速行驶和山区路况下的制动性能。
酚醛复合材料刹车片重量减轻75%,且防腐蚀。这些刹车片具有隔热性能,并具备电动汽车制动循环所需的卓越阻尼性能。此外,Brakes India于2022年2月推出了高性能“Elite”摩擦刹车片。Brakes India推出了一系列高性能刹车片,旨在提升车辆在高速行驶和山区路况下的制动性能。电动汽车比内燃机汽车更轻。包括梅赛德斯-奔驰EQV豪华客车在内的多款车型均采用汽车摩擦刹车片,以实现平稳舒适的驾驶体验。
汽车制动摩擦产品市场报告细分分析
构成汽车制动摩擦产品市场分析的关键细分市场包括:制动盘材料、产品类型、车辆类型和地理位置。
- 根据刹车盘材料的不同,全球汽车刹车摩擦材料市场可分为金属、陶瓷和复合材料三大类。其中,复合材料刹车盘预计在2023年将占据最大市场份额,这主要得益于先进复合材料技术的不断发展。
- 根据产品类型,全球市场可分为刹车蹄、刹车片、刹车衬片、刹车盘和鼓式刹车。其中,刹车衬片在2023年占据最大市场份额。
- 根据车辆类型,市场可分为乘用车和商用车。其中,乘用车在2023年将占据更大的市场份额,这主要归功于全球乘用车销量的增长。
汽车制动摩擦产品市场份额按地域划分分析
汽车制动摩擦产品市场报告的地理范围主要分为五个区域:北美、亚太、欧洲、中东和非洲以及南美和中美洲。
预计亚太地区将在2023年占据最大市场份额。这主要归功于中国、印度和日本汽车产量和销量的增长。亚太地区市场增长主要归因于印度、中国和日本汽车销量的增长。日本、中国和印度不断增长的汽车产量,以及政府对安全规范的严格监管,都将推动汽车制动摩擦产品市场在预测期内的增长。由于众多汽车零部件制造商的存在,中国在亚太地区汽车制动摩擦产品市场占据主导地位。此外,预计印度在预测期内将以最高的复合年增长率增长。
汽车制动摩擦产品市场报告范围
| 报告属性 | 细节 |
|---|---|
| 2025年市场规模 | 158.6亿美元 |
| 到2034年市场规模 | 232.4亿美元 |
| 全球复合年增长率(2026-2034 年) | 4.34% |
| 史料 | 2021-2024 |
| 预测期 | 2026-2034 |
| 涵盖部分 |
光盘材料
|
| 覆盖地区和国家 |
北美
|
| 市场领导者和主要公司简介 |
|
汽车制动摩擦产品市场参与者密度:了解其对业务动态的影响
汽车制动摩擦产品市场正快速增长,这主要得益于终端用户需求的不断增长,而终端用户需求的增长又源于消费者偏好的转变、技术的进步以及消费者对产品优势认知的提高。随着需求的增长,企业不断拓展产品线、创新以满足消费者需求并把握新兴趋势,这些都进一步推动了市场增长。
汽车制动摩擦产品市场新闻及最新动态
汽车制动摩擦产品市场评估是通过收集定性和定量数据,结合一手和二手研究成果进行的,这些研究包括重要的企业出版物、行业协会数据和数据库。以下列出了汽车制动摩擦产品市场的一些发展趋势:
- 全球领先的制动解决方案供应商TMD Friction正加速转型,致力于打造更安全、更可持续的未来出行方式。凭借110余年的高端原厂配套经验以及140年来作为行业领导者的辉煌成就,公司正开启新的篇章。在确立了其在提供值得信赖的制动产品和解决方案方面的领先地位后,公司正着手打造全新的现代化品牌战略,重点关注如何通过商业实践和解决方案最大限度地减少对环境的影响。(来源:公司网站,2024年2月)
- 天纳克旗下Ferodo原厂配套制动系统业务部门推出了一种先进的无铜混合摩擦材料复合材料,可同时满足内燃机汽车和电动汽车的制动性能和舒适性要求。(来源:新闻稿,2023年7月)
汽车制动摩擦产品市场报告涵盖范围及成果
《汽车制动摩擦产品市场规模及预测(2021-2031)》报告对市场进行了详细分析,涵盖以下领域:
- 本报告涵盖全球、区域和国家层面的汽车制动摩擦产品市场规模及预测,包括所有主要细分市场。
- 汽车制动摩擦产品市场趋势以及市场动态,例如驱动因素、制约因素和关键机遇。
- 详细的PEST和SWOT分析
- 汽车制动摩擦产品市场分析,涵盖关键市场趋势、全球和区域框架、主要参与者、法规以及近期市场发展动态。
- 汽车制动摩擦产品市场的行业格局和竞争分析,包括市场集中度、热力图分析、主要参与者和最新发展动态
- 公司详细概况

Naveen 是一位经验丰富的市场研究和咨询专业人士,在定制项目、联合项目和咨询项目方面拥有超过 9 年的专业经验。他目前担任副总裁,成功管理了项目价值链中的利益相关者,撰写了 100 多份研究报告和 30 多项咨询项目。他的工作涵盖工业和政府项目,为客户的成功和数据驱动的决策做出了重要贡献。
Naveen 拥有卡纳塔克邦 VTU 的电子与通信工程学位,以及马尼帕尔大学的市场营销与运营 MBA 学位。他已担任 IEEE 会员 9 年,积极参与各种会议、技术研讨会,并在分部和地区层面担任志愿者。在此之前,他曾担任 IndustryARC 的助理战略顾问和惠普(惠普全球)的工业服务器顾问。
- 全面的市场规模与预测分析
- 详细的细分市场分析
- 深入的市场动态评估
- 区域及国家级洞察
- 竞争格局与企业对标分析
- 战略性商业情报
客户评价
Insight Partners 的 SCADA 系统市场报告内容全面,对当前趋势和未来预测提供了宝贵的见解。该团队始终高度专业、响应迅速且乐于助人。我们非常满意,强烈推荐他们的服务。
兰·凯德姆 伙伴, Reali Technologies LTD我请求一份关于特定软件市场的报告,团队在几天内就完成了。报告信息非常相关,而且呈现得非常出色。之后,我请求对报告进行一些修改和补充。团队再次迅速响应,不到一周我就收到了最终报告。
让-埃尔韦·詹恩 主席, 未来分析公司我们与 Insight Partners 合作进行了一项重要的市场研究和预测。他们清晰地洞察了机遇和风险,帮助我们制定了计划。他们的研究简单易用,数据可靠,帮助我们做出了明智而自信的决策。我们强烈推荐他们。
皮尤什·纳格帕尔 高级副总裁, 远光全球Insight Partners 凭借其深厚的行业专业知识,提供了富有洞察力、结构合理的市场研究。他们的团队始终专业且响应迅速。用户友好的网站让访问行业报告变得顺畅无阻。我们强烈推荐他们可靠、高质量的研究服务。
安达幸彦 首席执行官, 深蓝有限责任公司这是我第一次从The Insight Partners购买市场报告。起初我有些犹豫,但访问了他们的网站后,我更放心地冒险购买市场报告。我对报告的质量和客户服务非常满意。我对最初的报告有一些疑问和意见,但在与他们的分析师通过电子邮件沟通了几次后,我相信这份报告可以作为我们战略规划流程的参考。非常感谢您抽出宝贵的时间,让这次体验如此愉快。我一定会向其他人推荐你们的服务,当我们需要更多市场数据时,你们将是我的首选。
约翰·铃木 总裁兼首席执行官、董事会董事, BK科技感谢您在处理我关于尼日利亚传染病体外诊断市场信息请求的过程中所展现的支持和专业精神。感谢您的耐心、指导,以及您愿意提供的折扣,最终促成了这笔交易。我期待未来与 Insight Partners 继续合作,这一切都要归功于您与我初次接触后留下的良好印象。
奇吉奥克博士 ONYIA 董事总经理, PineCrest 医疗保健有限公司购买理由
- 明智的决策
- 了解市场动态
- 竞争分析
- 客户洞察
- 市场预测
- 风险规避
- 战略规划
- 投资论证
- 识别新兴市场
- 优化营销策略
- 提升运营效率
- 顺应监管趋势


