建筑添加剂市场增长、规模、份额、趋势、关键参与者分析及 2030 年预测
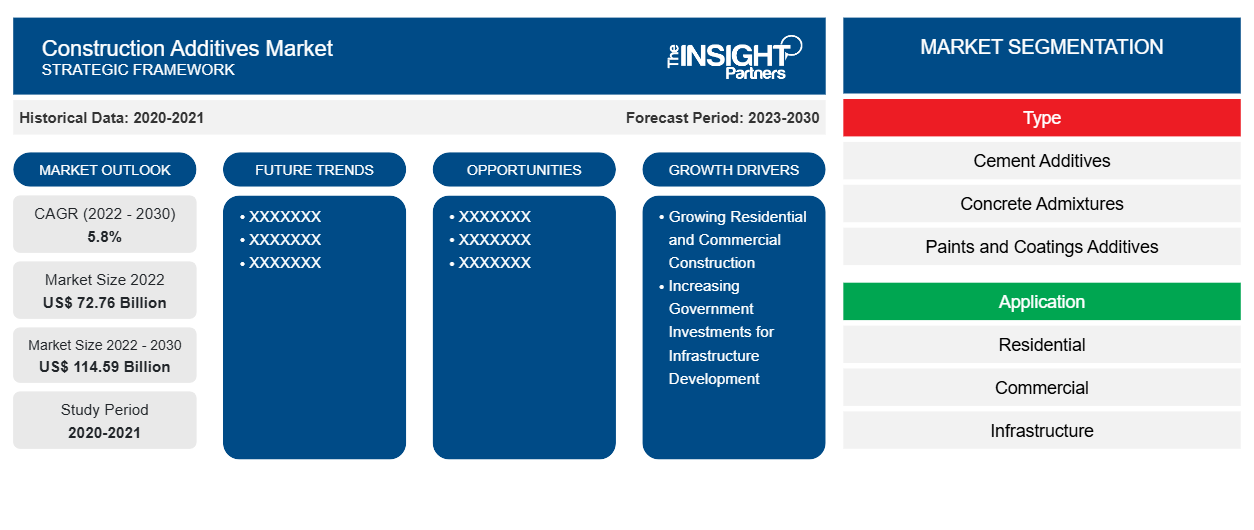
历史数据 : 2020-2021 | 基准年 : 2022 | 预测期 : 2023-2030建筑添加剂市场规模和预测(2020-2030 年)、全球和区域份额、趋势和增长机会分析报告范围:按类型 [水泥添加剂、混凝土外加剂(预制混凝土和预拌混凝土)、油漆和涂料添加剂、粘合剂和密封剂添加剂、塑料添加剂、沥青添加剂等] 和应用(住宅、商业、基础设施等)
- 状态 : 已发布
- 报告代码 : TIPRE00038944
- 类别 : 化学品和材料
- 页数 : 280
- 可用报告格式 :


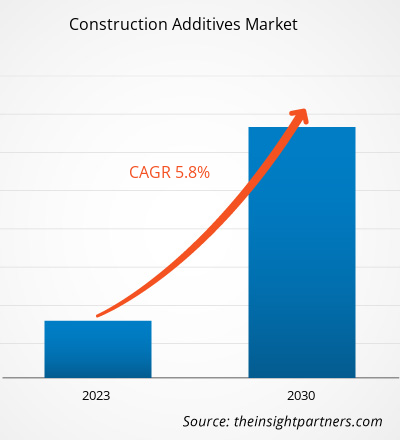
[研究报告] 2022年建筑添加剂市场规模价值为 727.6 亿美元,预计到 2030 年将达到 1145.9 亿美元;预计 2022 年至 2030 年的复合年增长率为 5.8%。
市场洞察和分析师观点:
建筑添加剂包括水泥添加剂、混凝土外加剂、塑料添加剂、沥青添加剂、油漆和涂料添加剂、粘合剂和密封剂添加剂、玻璃添加剂和陶瓷添加剂。这些材料用于提高建筑产品的质量和性能。它们还有助于实现某些理想的特性,例如提高强度、耐久性和可加工性。市场上有各种粉末和液体建筑添加剂产品可供选择,它们可以配制创新产品。推动市场增长的主要因素是住宅和商业建筑的增长以及政府对基础设施建设的投资增加。政府支持的基础设施项目包括道路、水坝、桥梁、隧道、港口、机场路面和高速公路。所有这些因素都促进了建筑添加剂市场的发展
增长动力和挑战:
住宅和商业建筑的增长以及政府对基础设施建设投资的增加是推动市场发展的关键因素之一。根据欧洲建筑业联合会的数据,2022 年法国非住宅建筑投资估计为 584.9 亿美元。2023 年,DEEM Enterprises LLC宣布计划斥资 27 亿美元在美国新泽西州一处前机场旧址上建造一条一级方程式赛车场、住宅和购物中心。政府机构不断增加的投资导致基础设施建设增加。
2021 年 11 月,美国政府批准了一项 1.2 万亿美元的基础设施法案,以协助联邦政府对各种基础设施项目的投资。此外,到 2023 年,建筑支出预计将增长 5.5%。这些举措产生了对建筑服务、化学品和材料的需求。世界各国政府在基础设施建设方面的投资和努力不断增加,推动了市场的发展。不断增长的建设和基础设施建设投资正在刺激对不同建筑化学品和材料的需求,从而推动建筑添加剂市场的发展。
原材料价格的波动可能会对市场产生阻碍作用。乳化剂、再生剂和抗剥落剂等建筑添加剂都是间接从原油中提取的。运输和供应链中断、原油需求上升、原材料价格上涨以及由于 COVID-19 疫情导致的原材料供应有限,导致石油产品价格上涨。由于全球经济状况波动导致原油价格上涨,进一步推高了石油衍生添加剂的价格。石油产品和其他原材料价格上涨可能会给产品的利润率带来压力,这对建筑添加剂市场的增长构成了挑战。
定制此报告以满足您的需求
您可以免费定制任何报告,包括本报告的部分内容、国家级分析、Excel 数据包,以及为初创企业和大学提供优惠和折扣
建筑添加剂市场:战略洞察
-
获取此报告的关键市场趋势。这个免费样品将包括数据分析,从市场趋势到估计和预测。
报告细分和范围:
“2030 年全球建筑添加剂市场分析与预测”是一项专业而深入的研究,重点关注全球市场趋势和增长机会。该报告旨在提供市场概述,并按类型和应用对市场进行详细细分。市场在最近经历了高增长,预计在预测期内将继续保持这一趋势。该报告提供了全球建筑添加剂消费的关键统计数据。此外,全球建筑添加剂市场报告对影响全球市场表现的各种因素进行了定性评估。该报告还包括对市场主要参与者及其关键战略发展的全面分析。还包括对市场动态的几项分析,以帮助确定关键驱动因素、建筑添加剂市场趋势和有利可图的机会,进而有助于确定主要收入来源。
建筑添加剂市场预测是根据各种二手和一手研究结果(如主要公司出版物、协会数据和数据库)估算的。此外,生态系统分析和波特五力分析提供了对市场的 360 度视角,有助于了解整个供应链和影响市场表现的各种因素。
节段分析:
全球建筑添加剂市场根据类型和应用进行细分。根据类型,市场细分为水泥添加剂、混凝土外加剂、油漆和涂料添加剂、粘合剂和密封剂添加剂、塑料添加剂、沥青添加剂等。水泥添加剂部分在 2022 年占据了建筑添加剂市场的很大份额。水泥添加剂包括研磨助剂、强度增强剂和性能增强剂。研磨助剂是具有几个关键优势的添加剂,例如提高生产率和提高细度。水泥中添加了各种强度增强剂,以提高其机械强度,通常是通过化学活化来保持水泥结构和表面的完整性。水泥添加剂在基础设施开发中的应用预计将推动市场发展。
根据应用,市场细分为住宅、商业、基础设施和其他。住宅部分在 2022 年占据了相当大的建筑添加剂市场份额。由于城市化进程加快,对住宅建筑的需求不断增加,住宅部门对不同类型的建筑添加剂的需求激增。在印度,2015 年启动的“全民住房计划”(也称为 Pradhan Mantri Awas Yojana(城市)计划)旨在到 2024 年为城市地区的所有人提供住房。住宅建筑行业投资和开发活动的增长归因于全球不同国家人口的增长和城市化。此外,许多国家的住房计划和政府的优惠政策导致了住宅建筑的建立,预计这将在预测期内推动对建筑添加剂的需求。
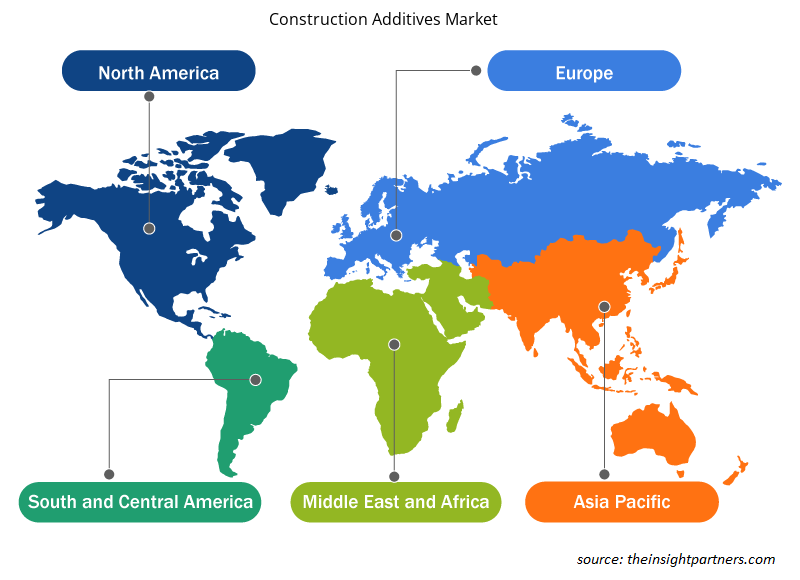
区域分析:
该报告详细概述了五大主要地区的市场——北美、欧洲、亚太地区 (APAC)、中东和非洲 (MEA) 以及南美和中美。在收入方面,亚太地区占据建筑添加剂市场的主导地位,2022 年的价值超过 350 亿美元。根据国际贸易管理局的数据,中国“十四五”期间 (2021-2025 年) 基础设施总投资预计将达到约 4.2 万亿美元。2022 年,国家发展和改革委员会 (NDRC) 和交通运输部 (中国) 公布了《国家公路网规划》文件,旨在到 2035 年建成功能齐全、高效、绿色、智能、安全的现代化公路网。该计划还包括修建 461,000 公里的高速公路,其中包括 162,000 公里的高速公路。预计在预测期内,印度和中国等几个亚洲经济体的基础设施建设和不断增长的住房项目将推动建筑添加剂市场的发展。
预计到 2030 年,欧洲建筑添加剂市场规模将达到约 240 亿美元。欧洲是最大的建筑材料生产国之一,由向当地和区域市场供应建筑材料的中小型企业 (SME) 经营。欧洲基础设施建设中可持续建筑添加剂的使用越来越多,预计将推动建筑添加剂市场的增长。预计从 2022 年到 2030 年,中东和非洲的复合年增长率将达到约 6%。由于中东和非洲的基础设施项目、可持续建筑和工业化激增,对建筑材料的需求增加,推动了对建筑和建筑材料的需求。由于旅游业的发展和移民人口的增加,该地区的商业基础设施建设也出现了激增。城市人口的增加导致对半城市和城市私人住宅建筑的需求激增,促使政府投资建筑业。
建筑添加剂市场区域洞察
Insight Partners 的分析师已详尽解释了预测期内影响建筑添加剂市场的区域趋势和因素。本节还讨论了北美、欧洲、亚太地区、中东和非洲以及南美和中美洲的建筑添加剂市场细分和地理位置。
- 获取建筑添加剂市场的区域特定数据
建筑添加剂市场报告范围
| 报告属性 | 细节 |
|---|---|
| 2022 年市场规模 | 727.6亿美元 |
| 2030 年的市场规模 | 1145.9亿美元 |
| 全球复合年增长率(2022 - 2030 年) | 5.8% |
| 史料 | 2020-2021 |
| 预测期 | 2023-2030 |
| 涵盖的领域 |
按类型
|
| 覆盖地区和国家 |
北美
|
| 市场领导者和主要公司简介 |
|
建筑添加剂市场参与者密度:了解其对业务动态的影响
建筑添加剂市场正在快速增长,这得益于最终用户需求的不断增长,这些需求源于消费者偏好的不断变化、技术进步以及对产品优势的认识不断提高等因素。随着需求的增加,企业正在扩大其产品范围,进行创新以满足消费者的需求,并利用新兴趋势,从而进一步推动市场增长。
市场参与者密度是指在特定市场或行业内运营的企业或公司的分布情况。它表明在给定市场空间中,相对于其规模或总市场价值,有多少竞争对手(市场参与者)存在。
在建筑添加剂市场运营的主要公司有:
- WR Grace & Co
- 克里索 公司
- 陶氏化学公司
- 巴斯夫 SE
- 西麦斯公司 SAB de CV
免责声明:上面列出的公司没有按照任何特定顺序排列。
- 了解建筑添加剂市场主要参与者概况
行业发展和未来机遇:
以下列出了建筑添加剂市场主要参与者采取的各种举措:
- 2021 年 4 月,陶氏建筑化学品扩大其业务范围,聘请 JNS SmithChem LLC作为东南地区授权经销商,业务范围覆盖缅因州、佛蒙特州、新罕布什尔州、马萨诸塞州、罗德岛州、康涅狄格州、纽约州和宾夕法尼亚州。
- 2023年7月,海德堡材料庆祝北美第二大水泥厂开业。
- 2023 年 7 月,西卡股份公司投资宏观纤维,以满足美国对可持续混凝土快速增长的需求。
竞争格局和重点公司:
住友精化株式会社、日本触媒株式会社、三洋化成株式会社、巴斯夫欧洲公司、赢创工业股份公司、LG 化学有限公司、卫星化学有限公司、花王公司、宜兴丹森科技和松原工业集团是建筑添加剂市场报告中介绍的主要参与者。全球市场参与者专注于提供高质量的产品以满足客户需求。

- 历史分析(2 年)、基准年、预测(7 年)及复合年增长率
- PEST和SWOT分析
- 市场规模、价值/数量 - 全球、区域、国家
- 行业和竞争格局
- Excel 数据集
客户评价
Insight Partners 的 SCADA 系统市场报告内容全面,对当前趋势和未来预测提供了宝贵的见解。该团队始终高度专业、响应迅速且乐于助人。我们非常满意,强烈推荐他们的服务。
兰·凯德姆 伙伴, Reali Technologies LTD我请求一份关于特定软件市场的报告,团队在几天内就完成了。报告信息非常相关,而且呈现得非常出色。之后,我请求对报告进行一些修改和补充。团队再次迅速响应,不到一周我就收到了最终报告。
让-埃尔韦·詹恩 主席, 未来分析公司我们与 Insight Partners 合作进行了一项重要的市场研究和预测。他们清晰地洞察了机遇和风险,帮助我们制定了计划。他们的研究简单易用,数据可靠,帮助我们做出了明智而自信的决策。我们强烈推荐他们。
皮尤什·纳格帕尔 高级副总裁, 远光全球Insight Partners 凭借其深厚的行业专业知识,提供了富有洞察力、结构合理的市场研究。他们的团队始终专业且响应迅速。用户友好的网站让访问行业报告变得顺畅无阻。我们强烈推荐他们可靠、高质量的研究服务。
安达幸彦 首席执行官, 深蓝有限责任公司这是我第一次从The Insight Partners购买市场报告。起初我有些犹豫,但访问了他们的网站后,我更放心地冒险购买市场报告。我对报告的质量和客户服务非常满意。我对最初的报告有一些疑问和意见,但在与他们的分析师通过电子邮件沟通了几次后,我相信这份报告可以作为我们战略规划流程的参考。非常感谢您抽出宝贵的时间,让这次体验如此愉快。我一定会向其他人推荐你们的服务,当我们需要更多市场数据时,你们将是我的首选。
约翰·铃木 总裁兼首席执行官、董事会董事, BK科技感谢您在处理我关于尼日利亚传染病体外诊断市场信息请求的过程中所展现的支持和专业精神。感谢您的耐心、指导,以及您愿意提供的折扣,最终促成了这笔交易。我期待未来与 Insight Partners 继续合作,这一切都要归功于您与我初次接触后留下的良好印象。
奇吉奥克博士 ONYIA 董事总经理, PineCrest 医疗保健有限公司购买理由
- 明智的决策
- 了解市场动态
- 竞争分析
- 客户洞察
- 市场预测
- 风险规避
- 战略规划
- 投资论证
- 识别新兴市场
- 优化营销策略
- 提升运营效率
- 顺应监管趋势


 获取免费样品 - 建筑添加剂市场