
螺旋CT扫描仪市场趋势及增长分析报告(至2031年)
螺旋CT扫描仪市场规模及预测(2021-2031年),全球及区域份额、趋势及增长机会分析报告涵盖范围:按类型(双层和多层)、切片类型(1-16层、17-64层、128-160层和>160层)、最终用户(医院、医疗中心和门诊手术中心)以及地理位置(北美、欧洲、亚太、中东和非洲以及南美和中美洲)划分。
- 状态 : 已发布
- 报告代码 : TIPRE00011094
- 类别 : 生命科学
- 页数 : 209
- 可用报告格式 :


- 最后更新日期 : November 05, 2025

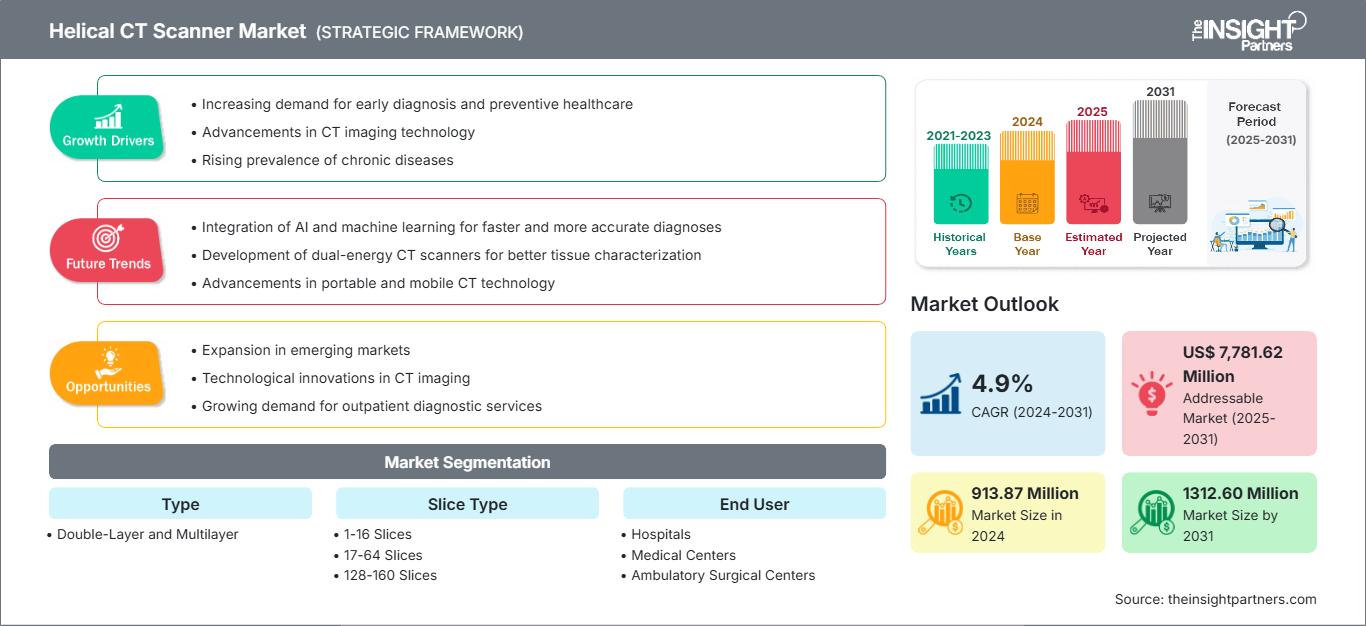
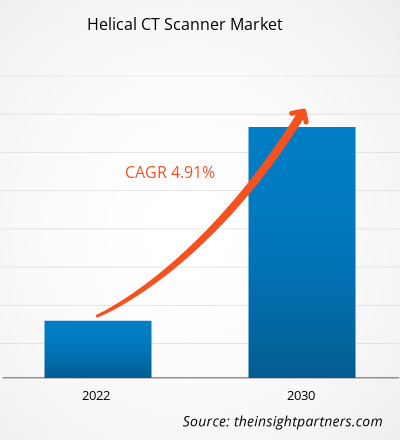
预计到2031年,螺旋CT扫描仪市场规模将从2024年的9.1387亿美元增长至13.0012亿美元。预计2025年至2031年期间,该市场将以5.28%的复合年增长率增长。
螺旋CT扫描仪市场分析
螺旋CT扫描仪市场的增长受到以下因素的推动:癌症和心血管疾病等慢性疾病发病率的增加、技术进步(例如多层成像、人工智能集成)、新兴市场医疗基础设施投资、人口老龄化以及对微创诊断和早期疾病检测的偏好。
螺旋CT扫描仪市场概览
螺旋CT在肿瘤学、心脏病学、神经病学、急诊和创伤等领域的应用,使其能够快速、高分辨率地进行横断面成像,因此医院的内外科、诊断中心和移动医疗单元成为这些系统的主要用户。人口老龄化、慢性病患病率上升、新兴经济体医疗基础设施的完善以及多层螺旋CT扫描仪的持续创新,是推动市场扩张的主要因素。尽管北美在技术应用方面处于领先地位,但亚太地区的增长速度最快。
您可以免费获得任何报告的定制服务,包括本报告的部分内容、国家/地区层面的分析、Excel 数据包,以及面向初创企业和高校的优惠折扣。
螺旋CT扫描仪市场:战略洞察
-
获取本报告的主要市场趋势。这份免费样品将包含数据分析,内容涵盖市场趋势、估算和预测等。
螺旋CT扫描仪市场驱动因素和机遇
市场驱动因素:
- 慢性病患病率上升:癌症和心血管疾病等慢性病的患病率上升,使得使用准确的诊断工具变得必要,从而推动了对螺旋 CT 扫描仪等仪器的需求。
- 成像技术进步:扫描时间缩短、图像分辨率提高、人工智能集成等新功能不断吸引着临床和实验室使用螺旋 CT 扫描仪。
- 老年人口不断增长:老年人更容易受到与衰老相关的健康问题的影响,因此,CT扫描等诊断成像方法在疾病管理的早期阶段变得不可或缺。
市场机遇:
- 便携式和移动式CT扫描仪的研发:便携式和移动式CT扫描仪使得医疗诊断能够在医疗现场直接进行,这在偏远地区和紧急情况下具有至关重要的优势。这项发明为该产品开辟了新的市场,并提高了其可及性。
- 关注低剂量辐射和患者安全:努力提高图像质量,同时减少辐射造成的伤害,这为发展创造了良好的空间,因为患者安全在医疗保健中至关重要。
- 新兴市场需求不断增长:发展中地区医疗基础设施的扩张和医疗技术支出的增加,促进了对螺旋CT扫描仪等诊断仪器的需求。
螺旋CT扫描仪市场报告细分分析
螺旋CT扫描仪市场被细分为不同的类别,以便更清晰地了解其运营、增长潜力和当前趋势。以下是行业报告中常用的标准细分方法:
按类型:
- 双层螺旋CT扫描仪因其能够同时采集两组数据,从而提高图像清晰度和诊断准确性,而日益普及。这种双层结构使设备能够更好地区分组织,并具有更高的对比度分辨率,有助于心脏和肿瘤的显像。医院和诊断中心对准确、快速且低辐射的诊断工具的需求,是双层CT技术在全球范围内普及的主要原因。
- 多层螺旋CT扫描仪每次旋转可获取多个切片,是缩短扫描时间和提高空间分辨率的理想选择。此类扫描仪可用于创伤病例或心脏检查等需要快速、清晰成像的场合。医疗机构致力于在减少患者辐射暴露的同时加快诊断速度,这推动了发达地区和新兴地区对多层螺旋CT扫描仪的需求。
按切片类型:
- 1-16 片
- 17-64 片
- 128-160 片
- >160 片
最终用户:
- 医院
- 医疗中心
- 门诊手术中心
按地理位置:
- 北美
- 欧洲
- 亚太地区
- 南美洲和中美洲
-
中东和非洲
螺旋CT扫描仪市场区域洞察
The Insight Partners 的分析师对预测期内影响螺旋 CT 扫描仪市场的区域趋势和因素进行了详尽的阐述。本节还探讨了北美、欧洲、亚太地区、中东和非洲以及南美和中美洲等地区的螺旋 CT 扫描仪市场细分和地域分布。
螺旋CT扫描仪市场报告范围
| 报告属性 | 细节 |
|---|---|
| 2024年市场规模 | 9.1387亿美元 |
| 到2031年市场规模 | 13.0012亿美元 |
| 全球复合年增长率(2025-2031年) | 5.28% |
| 史料 | 2021-2023 |
| 预测期 | 2025-2031 |
| 涵盖部分 |
按类型
|
| 覆盖地区和国家 |
北美
|
| 市场领导者和主要公司简介 |
|
螺旋CT扫描仪市场参与者密度:了解其对业务动态的影响
螺旋CT扫描仪市场正快速增长,主要受终端用户需求不断增长的推动,而这又源于消费者偏好的转变、技术的进步以及消费者对产品优势认知的提高。随着需求的增长,企业不断拓展产品和服务,持续创新以满足消费者需求,并把握新兴趋势,这些都进一步推动了市场增长。
- 获取螺旋CT扫描仪市场主要参与者概览
螺旋CT扫描仪市场份额按地域划分分析
预计亚太地区将在未来几年内增长最快。南美、中东和非洲等新兴市场为螺旋CT扫描仪供应商提供了巨大的发展机遇。
螺旋CT扫描仪市场的增长受多种因素影响,包括医疗保健投资增加、医疗旅游业发展、慢性病患病率上升以及技术进步等。以下是各地区市场份额和趋势概述:
1. 北美洲
- 市场份额:占据全球市场相当大的份额
- 主要驱动因素:先进的医疗设施、大量的慢性病以及完善的报销制度。
- 趋势:人工智能成像、超低剂量扫描、医院现代化以及旧式 CT 设备的逐步淘汰。
2. 欧洲
- 市场份额:相当大的市场份额
- 主要驱动因素:老年人口不断增长、公共医疗保健体系完善、以及支持使用诊断工具的政策。
- 趋势:欧盟监管要求的协调(例如,MDR)、无国界医疗保健服务以及影像与健康平台集成的数字化。
3. 亚太地区
- 市场份额:增长最快的地区,市场份额逐年上升
- 主要驱动因素:医疗保健支出不断增加,中国和印度的患者人数众多,以及医疗影像基础设施蓬勃发展。
- 趋势:医疗旅游的扩张、移动/影像推广计划、下一代 CT 技术的跨越式采用以及本地化生产。
4. 南美洲和中美洲
- 市场份额:市场稳步增长
- 主要驱动因素:医疗保健服务覆盖范围扩大、诊断成像需求增加以及更多诊所配备最新 CT 扫描仪。
- 趋势:通过公私合作实现诊断现代化,已安装基础转型,以及区域分销商向新兴市场扩张。
5. 中东和非洲
- 市场份额:虽然规模较小,但增长迅速。
- 关键驱动因素:随着对医疗保健基础设施的投资、诊断意识的提高以及政府对影像技术的支持,中东和非洲地区展现出新兴增长的潜力。
- 趋势:在难以到达的地区使用便携式/移动式螺旋 CT 设备,提高放射科中心的容量,以及租赁昂贵设备。
螺旋CT扫描仪市场参与者密度:了解其对业务动态的影响
市场密度高,竞争激烈
由于GE医疗科技公司和东软医疗系统等老牌企业的存在,市场竞争十分激烈。区域性和专业性供应商也加剧了各地区的竞争格局。
激烈的竞争促使企业通过提供以下服务来脱颖而出:
- 先进产品
- 产品认证
- 遵守监管准则
机遇与战略举措
- 受各医疗保健领域对疾病早期诊断和更高成像质量的需求不断增长的推动,全球螺旋CT扫描仪市场正在经历显著增长。
- 领先企业可以将资金投入人工智能集成、进军新兴市场以及开展合作,以提高自身的技术水平和市场地位。
研究过程中分析的其他公司:
- 日立医疗株式会社
- 岛津公司
- Carestream Health, Inc.
- 科宁公司
- Accuray公司
- Esaote SpA
- 模拟公司。
螺旋CT扫描仪市场新闻及最新进展
- 在 2025 年 ASTRO 大会上,飞利浦发布了其在放射治疗领域最新的 CT 和 MR 创新技术,致力于实现精准癌症治疗。全新的 Rembra RT 和 Areta RT CT 平台凭借先进的工作流程,显著提升了放射治疗的精准度和效率,并具有长期价值。飞利浦还推出了配备人工智能 SmartSpeed Precise 功能的无氦 BlueSeal RT 1.5T 70cm MR 系统,进一步巩固了其在放射肿瘤学领域 MR 可持续性方面的领先地位。
- 印度最大的消费电子品牌三星携手其子公司NeuroLogica,在印度推出了新一代移动CT产品系列。该系列新品包括CereTom Elite、OmniTom Elite、OmniTom Elite PCD和BodyTom 32/64,每款产品均旨在满足医院和专科中心的临床需求。
螺旋CT扫描仪市场报告涵盖范围和成果
《螺旋CT扫描仪市场规模及预测(2021-2031)》报告对市场进行了详细分析,涵盖以下领域:
- 螺旋CT扫描仪市场规模及预测,涵盖全球、区域和国家层面的所有关键市场细分领域。
- 螺旋CT扫描仪市场趋势,以及驱动因素、制约因素和关键机遇等市场动态
- 详细的PEST和SWOT分析
- 螺旋CT扫描仪市场分析,涵盖关键市场趋势、全球和区域框架、主要参与者、法规以及近期市场发展动态。
- 螺旋CT扫描仪市场行业格局及竞争分析,涵盖市场集中度、热力图分析、主要参与者及最新发展动态
- 公司详细概况

Mrinal 是一位经验丰富的研究分析师,在生命科学市场情报和咨询领域拥有超过 8 年的经验。凭借战略思维和对卓越的不懈追求,她在医药预测、市场机遇评估和行业基准制定方面积累了深厚的专业知识。她的工作致力于提供切实可行的洞察,帮助客户做出明智的战略决策。
Mrinal 的核心优势在于将复杂的定量数据集转化为有意义的商业智能。她敏锐的分析能力有助于制定市场进入 (GTM) 战略,并发掘制药和医疗器械行业的增长机会。作为一名值得信赖的顾问,她始终致力于简化工作流程并建立最佳实践,从而为客户推动创新并提高运营效率。
- 全面的市场规模与预测分析
- 详细的细分市场分析
- 深入的市场动态评估
- 区域及国家级洞察
- 竞争格局与企业对标分析
- 战略性商业情报
客户评价
Insight Partners 的 SCADA 系统市场报告内容全面,对当前趋势和未来预测提供了宝贵的见解。该团队始终高度专业、响应迅速且乐于助人。我们非常满意,强烈推荐他们的服务。
兰·凯德姆 伙伴, Reali Technologies LTD我请求一份关于特定软件市场的报告,团队在几天内就完成了。报告信息非常相关,而且呈现得非常出色。之后,我请求对报告进行一些修改和补充。团队再次迅速响应,不到一周我就收到了最终报告。
让-埃尔韦·詹恩 主席, 未来分析公司我们与 Insight Partners 合作进行了一项重要的市场研究和预测。他们清晰地洞察了机遇和风险,帮助我们制定了计划。他们的研究简单易用,数据可靠,帮助我们做出了明智而自信的决策。我们强烈推荐他们。
皮尤什·纳格帕尔 高级副总裁, 远光全球Insight Partners 凭借其深厚的行业专业知识,提供了富有洞察力、结构合理的市场研究。他们的团队始终专业且响应迅速。用户友好的网站让访问行业报告变得顺畅无阻。我们强烈推荐他们可靠、高质量的研究服务。
安达幸彦 首席执行官, 深蓝有限责任公司这是我第一次从The Insight Partners购买市场报告。起初我有些犹豫,但访问了他们的网站后,我更放心地冒险购买市场报告。我对报告的质量和客户服务非常满意。我对最初的报告有一些疑问和意见,但在与他们的分析师通过电子邮件沟通了几次后,我相信这份报告可以作为我们战略规划流程的参考。非常感谢您抽出宝贵的时间,让这次体验如此愉快。我一定会向其他人推荐你们的服务,当我们需要更多市场数据时,你们将是我的首选。
约翰·铃木 总裁兼首席执行官、董事会董事, BK科技感谢您在处理我关于尼日利亚传染病体外诊断市场信息请求的过程中所展现的支持和专业精神。感谢您的耐心、指导,以及您愿意提供的折扣,最终促成了这笔交易。我期待未来与 Insight Partners 继续合作,这一切都要归功于您与我初次接触后留下的良好印象。
奇吉奥克博士 ONYIA 董事总经理, PineCrest 医疗保健有限公司购买理由
- 明智的决策
- 了解市场动态
- 竞争分析
- 客户洞察
- 市场预测
- 风险规避
- 战略规划
- 投资论证
- 识别新兴市场
- 优化营销策略
- 提升运营效率
- 顺应监管趋势


