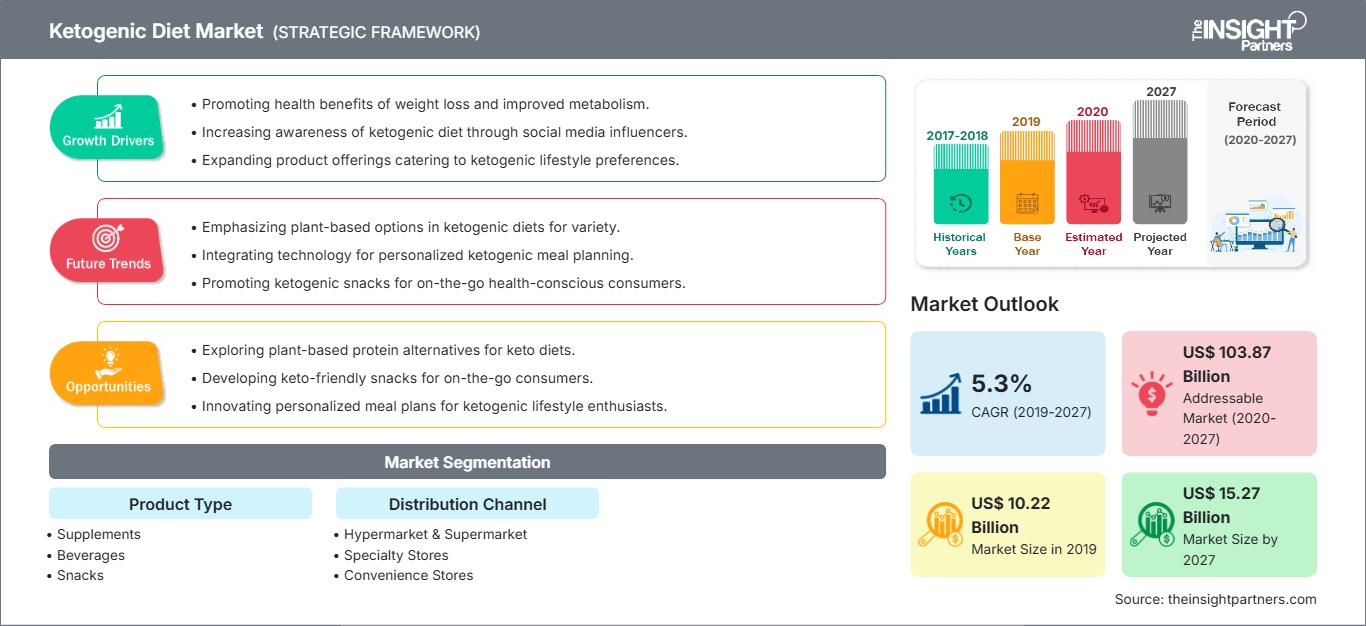
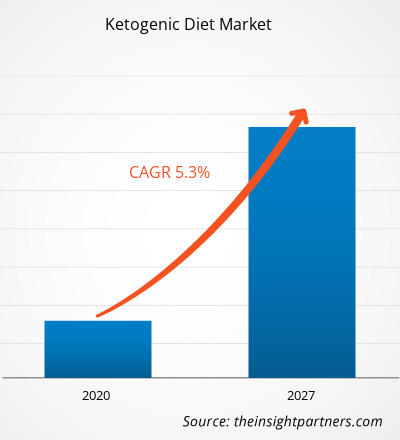
生酮饮食市场基于(关键地区、市场参与者、规模和份额)- 到 2031 年的预测

  • Report Code : TIPRE00006281
  • Category : Food and Beverages
  • Status : Published
  • No. of Pages : 160
Buy Now

【研究报告】2019年生酮饮食市场规模为102.214亿美元,预计到2027年将达到152.6636亿美元;预计在预测期内复合年增长率为 5.3%。

生酮饮料因其即时补充能量的特性而获得全球认可。事实证明,饮用生酮咖啡和其他生酮饮料在很多方面对身体都有帮助。例如,空腹喝生酮咖啡有助于促进减肥。众所周知,咖啡中的咖啡因含量可以刺激大脑和身体,最终有助于增强身体的能量。有机生酮咖啡中存在的 omega-3 脂肪酸具有抗炎特性。生酮咖啡中存在的椰子油起到天然泻药的作用。直接食用,它有助于促进肠道健康并增强消化系统。生酮咖啡在多种情况下都有帮助,例如消费者在几年后没有癫痫发作并成功戒掉饮食。生酮咖啡对于新诊断出的癫痫患者试图避免使用抗癫痫药物以及对药物难以治疗的慢性癫痫患者有帮助。葡萄糖稳定、酮体和脂肪酸的作用以及线粒体功能的改变等因素已被证明是生酮咖啡的可能机制。酮体是饥饿时大脑的能量来源,很容易穿过血脑屏障。

北美预计将占据最大份额由于该地区人口对健康的关注日益增加,全球生酮饮食市场在预测期内出现了增长。北美生酮饮食产品制造公司正在不断增强其产品组合以满足客户的需求。慢性病患病率的上升导致对生酮饮食的需求增加。尽管北美大多数人口都开始进行体育锻炼,但肥胖症仍然是一个普遍存在的问题,它会导致慢性心血管疾病 (CVD)、高血压和胆固醇。根据 2015 年至 2016 年 NHANES(全国健康与营养检查调查)的数据,美国 39.6% 的成年人和 18.5% 的青少年患有肥胖症;而7.7%的成年人和5.6%的青少年有严重的肥胖问题。各种研究证明,针对癫痫儿童的生酮饮食有助于使儿童多年来免于手术并减少药物治疗。因此,美国和加拿大对肥胖问题的日益关注正在推动市场增长。食物&北美的饮料行业参与者正专注于推出针对生酮节食者的新产品。多个市场的企业对生酮饮食趋势反应良好。例如,与生酮饮食相关的移动应用程序(例如 KetoApp 和 Carb Manager)在北美流行的健康和保健应用程序列表中排名靠前。此外,YouTube 有许多专门介绍生酮饮食的频道。

COVID-19 疫情于 2019 年 12 月在中国武汉爆发,并迅速蔓延到全球。截至 2020 年 11 月,就确诊病例和宣布死亡人数而言,美国、印度、巴西、俄罗斯、法国、西班牙、英国、意大利和阿根廷是受影响最严重的国家。根据世界卫生组织的数据,全球约有 58,712,326 例确诊病例和 1,388,528 例死亡病例。由于封锁、旅行禁令和企业关闭,COVID-19 已经影响了经济和企业。全球食品与饮料饮料行业是因封锁和办公室关闭而遭受供应链断裂和制造中断的主要行业之一。尽管中国是全球制造业中心和各行业最大的原材料供应国,但中国以及亚太和欧洲等主要地区的各种工厂和工厂的封锁正在影响全球供应链,并对制造、交付产生负面影响时间表和各种商品的销售。所有这些因素都极大地影响了全球生酮饮食市场的增长。

全球生酮饮食市场


市场洞察

亚太地区需求不断增长

食品和饮料饮料行业倾向于推出针对生酮节食者的新产品。人们对生酮饮食营养益处的认识不断提高,是生酮饮食市场全球增长的一个主要因素。随着亚太地区人口健康意识的不断提高,亚太地区的主要市场参与者正致力于在市场上推出生酮饮食产品。各种名人和社交媒体都热衷于生酮饮食的使用并导致其流行。亚太地区的主要参与者也受到过去几年市场急剧增长的生酮饮食推出的影响。根据谷歌搜索,生酮饮食是 2019 年搜索次数最多的饮食计划之一。市场上一些著名的生酮产品包括中链甘油三酯油、带有酮类特定包装和声明的骨汤、杏仁黄油和营养饮料。由于生酮饮食主要有利于引入草饲动物。肉类,主要参与者现在瞄准草饲黄油等产品。

产品类型洞察

根据产品类型,生酮饮食市场分为补充剂、饮料、零食、乳制品等。 2019年,零食细分市场占据主导地位。生酮零食蛋白质含量高,碳水化合物和糖含量低。作为生酮零食,有多种选择,不仅健康而且美味。有多种即食零食对酮类友好且易于获取。鳄梨是最好的酮类零食之一,含有大量的脂肪和蛋白质。牛油果与蛋黄酱搭配,撒上少许盐和胡椒,味道最佳。此外,橄榄是纤维和脂肪的良好来源,且蛋白质和碳水化合物含量极低。澳洲坚果也是一种很好的即食生酮零食,其中含有极少量的 omega-6 含量和大量的单不饱和脂肪。添加麦芽糊精、葡萄糖和不健康防腐剂的无激素有机意大利辣香肠也是很好的酮类零食。有几种牛肉干零食的碳水化合物含量较低或不含碳水化合物,但添加了一些成分。骨头汤是最健康的生酮零食之一,热量含量极低。低热量、营养丰富的羽衣甘蓝片的出现扩大了生酮零食的选择范围。这些对酮类友好、易于准备且即食的零食的出现影响了全世界的生酮饮食。

全球生酮饮食市场,按产品类型划分 – 2019年和2027年


分销渠道洞察

根据分销渠道,生酮饮食市场细分为大型超市和超市、专卖店、便利店等。 2019年,便利店细分市场占据主导地位。与大卖场和大型超市相比,便利店的面积有限且规模较小。超级市场。便利店较长的营业时间对于工作到很晚、急于取货的消费者来说是有利的。专卖店旨在并专注于销售与生酮饮食相关的特定类型的产品。如果通过大卖场销售超市中,制造商将其产品出售给分销商,然后分销商将这些产品提供给大卖场和零售商。超市按要求。

战略洞察

全球生酮饮食市场的一些主要参与者包括 Ample Foods、Ancient Nutrition、Danone SA、Keto & ; Co.、Know Brainer Foods、Love Good Fats、雀巢 SA、Perfect Keto、Pruvit Ventures Inc. 和 Zenwise Health。这些公司正在实施新产品开发和并购战略,以扩大客户群并在全球范围内获得显着的市场份额,从而使参与者能够在全球范围内维持其品牌名称。

  ;

报告聚焦

  • 全球生酮饮食市场的进步行业趋势,帮助参与者制定有效的长期战略
  • 企业采用的业务增长战略发达和发展中市场
  • 2017年至2027年全球生酮饮食市场的定量分析
  • 对全球各行业生酮饮食需求的估算
  • PEST分析来说明该行业买家和供应商的效率
  • 了解竞争市场情况和全球生酮饮食需求的最新发展
  • 市场趋势和前景,以及驱动和限制增长的因素全球生酮饮食市场
  • 了解支持市场增长商业利益的策略
  • 全球生酮饮食市场各个市场节点的规模
  • 详细市场概况、细分以及行业动态
  • 全球生酮饮食各地区市场规模以及各地区的广阔增长机会

 < /p>

生酮饮食市场,按产品类型

  • 补充剂
  • 饮料
  • 零食
  • 乳制品
  • li>
  • 其他


生酮饮食市场(按分销渠道)

  • 大型超市和超市超市
  • 专卖店
  • 便利店
  • 其他


公司简介

  • Ample Foods
  • Ancient Nutrition
  • Danone SA
  • Keto&amp; Co.
  • 了解 Brainer Foods
  • 热爱优质脂肪
  • 雀巢 SA
  • Perfect Keto
  • Pruvit Ventures Inc .
  • Zenwise 健康
Report Coverage
Report Coverage

Revenue forecast, Company Analysis, Industry landscape, Growth factors, and Trends

Segment Covered
Segment Covered

This text is related
to segments covered.

Regional Scope
Regional Scope

North America, Europe, Asia Pacific, Middle East & Africa, South & Central America

Country Scope
Country Scope

This text is related
to country scope.

Frequently Asked Questions


Can you list some of the major players operating in the global ketogenic diet market?

The major players operating in the global ketogenic diet market are Ample Foods, Ancient Nutrition, Danone SA, Keto & Co., Know Brainer Foods, Love Good Fats, Nestle SA, Perfect Keto, Pruvit ventures Inc., and Zenwise Health.

In 2019, which region held the largest share of the global ketogenic market?

In 2019, North America region possesses the largest share in the global ketogenic diet market. The largest market share of the North American region is primarily attributed to the rising awareness among the consumers related to the health advantages associated with the consumption of keto products which in turn propel the demand for ketogenic diet in this region. The food and beverages industries are targeting on the manufacturing and introduction of keto-friendly products in the market that has led to an increased attraction towards the ketogenic diet. Obesity is one of the significant health issues in North America and the long-term effect of the ketogenic diet on the obese patients has been a contributing factor that has fueled the consumption of ketogenic diet in North America. The North American market is characterized by the strong presence of players such as Ancient Nutrition, Ample Foods, and Danone SA, among others.

Based on product type, why is beverage segment expected to grow at the highest rate during 2020–2027?

The growth of beverage segment is primarily attributed to the fact that, in the early days after taking up a ketogenic diet, the body sheds minerals and eater at an accelerated rate and as the level of ketones increases after a few days, this shedding is increased and might cause dehydration. To counteract this dehydration, it is very important to consume water as the best beverage in a ketogenic diet. If not plain water, it may be consumed with frozen fruits, with mint ice cubes or opt to use some citrus like lemon, grapefruit and oranges. There are some water enhancers available when one opts to follow a ketogenic diet. Stur is one of the most natural water enhancers available in the market that uses natural juices and stevia flavors to plain water. Apart from natural sweetener like stevia, it also uses a negligible amount of cane sugar. Other known water enhancers that could be best suited for a ketogenic diet are crystal light liquid, MiO liquid water enhancer, and Dasani Drops among others. The next type of beverages is the sparkling water that has a naturally occurring carbonation. Beverages like seltzers can also be consumed on a ketogenic diet as they are calorie-free beverages. The introduction of keto-friendly club soda is also a choice of option as they do not contain any added sugars or flavorings in them. Keto coffee drinks like plain black coffee are sure to boost the action of ketosis in the body. Addition of coconut oil or MCT oil may be a good source of fat for the body while opting for a ketogenic diet. Black teas, green teas and herbal teas are also a good option of ketogenic beverages. Most of the energy drinks are loaded with sugar, but the introduction of sugar-free, low carb or zero versions of energy drinks have also been advised to be consumed when on a ketogenic diet. Leading energy drink manufacturers like Red Bull, Zevia, Monster Energy, GURU and Rockstar have launched their sugar-free and low on carb energy drinks in the market. The consumption of beverages in a ketogenic diet varies on the sugar and carb content in them.

The List of Companies - Ketogenic Diet Market

  1. Ample Foods
  2. Ancient Nutrition
  3. Danone S.A.
  4. Keto And Company
  5. Know Brainer Foods
  6. Love Good Fats
  7. Nestle S.A.
  8. Perfect Keto
  9. Pruvit Ventures, Inc.
  10. Zenwise Health.

The Insight Partners performs research in 4 major stages: Data Collection & Secondary Research, Primary Research, Data Analysis and Data Triangulation & Final Review.

  1. Data Collection and Secondary Research:

As a market research and consulting firm operating from a decade, we have published and advised several client across the globe. First step for any study will start with an assessment of currently available data and insights from existing reports. Further, historical and current market information is collected from Investor Presentations, Annual Reports, SEC Filings, etc., and other information related to company’s performance and market positioning are gathered from Paid Databases (Factiva, Hoovers, and Reuters) and various other publications available in public domain.

Several associations trade associates, technical forums, institutes, societies and organization are accessed to gain technical as well as market related insights through their publications such as research papers, blogs and press releases related to the studies are referred to get cues about the market. Further, white papers, journals, magazines, and other news articles published in last 3 years are scrutinized and analyzed to understand the current market trends.

  1. Primary Research:

The primarily interview analysis comprise of data obtained from industry participants interview and answers to survey questions gathered by in-house primary team.

For primary research, interviews are conducted with industry experts/CEOs/Marketing Managers/VPs/Subject Matter Experts from both demand and supply side to get a 360-degree view of the market. The primary team conducts several interviews based on the complexity of the markets to understand the various market trends and dynamics which makes research more credible and precise.

A typical research interview fulfils the following functions:

  • Provides first-hand information on the market size, market trends, growth trends, competitive landscape, and outlook
  • Validates and strengthens in-house secondary research findings
  • Develops the analysis team’s expertise and market understanding

Primary research involves email interactions and telephone interviews for each market, category, segment, and sub-segment across geographies. The participants who typically take part in such a process include, but are not limited to:

  • Industry participants: VPs, business development managers, market intelligence managers and national sales managers
  • Outside experts: Valuation experts, research analysts and key opinion leaders specializing in the electronics and semiconductor industry.

Below is the breakup of our primary respondents by company, designation, and region:

Research Methodology

Once we receive the confirmation from primary research sources or primary respondents, we finalize the base year market estimation and forecast the data as per the macroeconomic and microeconomic factors assessed during data collection.

  1. Data Analysis:

Once data is validated through both secondary as well as primary respondents, we finalize the market estimations by hypothesis formulation and factor analysis at regional and country level.

  • Macro-Economic Factor Analysis:

We analyse macroeconomic indicators such the gross domestic product (GDP), increase in the demand for goods and services across industries, technological advancement, regional economic growth, governmental policies, the influence of COVID-19, PEST analysis, and other aspects. This analysis aids in setting benchmarks for various nations/regions and approximating market splits. Additionally, the general trend of the aforementioned components aid in determining the market's development possibilities.

  • Country Level Data:

Various factors that are especially aligned to the country are taken into account to determine the market size for a certain area and country, including the presence of vendors, such as headquarters and offices, the country's GDP, demand patterns, and industry growth. To comprehend the market dynamics for the nation, a number of growth variables, inhibitors, application areas, and current market trends are researched. The aforementioned elements aid in determining the country's overall market's growth potential.

  • Company Profile:

The “Table of Contents” is formulated by listing and analyzing more than 25 - 30 companies operating in the market ecosystem across geographies. However, we profile only 10 companies as a standard practice in our syndicate reports. These 10 companies comprise leading, emerging, and regional players. Nonetheless, our analysis is not restricted to the 10 listed companies, we also analyze other companies present in the market to develop a holistic view and understand the prevailing trends. The “Company Profiles” section in the report covers key facts, business description, products & services, financial information, SWOT analysis, and key developments. The financial information presented is extracted from the annual reports and official documents of the publicly listed companies. Upon collecting the information for the sections of respective companies, we verify them via various primary sources and then compile the data in respective company profiles. The company level information helps us in deriving the base number as well as in forecasting the market size.

  • Developing Base Number:

Aggregation of sales statistics (2020-2022) and macro-economic factor, and other secondary and primary research insights are utilized to arrive at base number and related market shares for 2022. The data gaps are identified in this step and relevant market data is analyzed, collected from paid primary interviews or databases. On finalizing the base year market size, forecasts are developed on the basis of macro-economic, industry and market growth factors and company level analysis.

  1. Data Triangulation and Final Review:

The market findings and base year market size calculations are validated from supply as well as demand side. Demand side validations are based on macro-economic factor analysis and benchmarks for respective regions and countries. In case of supply side validations, revenues of major companies are estimated (in case not available) based on industry benchmark, approximate number of employees, product portfolio, and primary interviews revenues are gathered. Further revenue from target product/service segment is assessed to avoid overshooting of market statistics. In case of heavy deviations between supply and demand side values, all thes steps are repeated to achieve synchronization.

We follow an iterative model, wherein we share our research findings with Subject Matter Experts (SME’s) and Key Opinion Leaders (KOLs) until consensus view of the market is not formulated – this model negates any drastic deviation in the opinions of experts. Only validated and universally acceptable research findings are quoted in our reports.

We have important check points that we use to validate our research findings – which we call – data triangulation, where we validate the information, we generate from secondary sources with primary interviews and then we re-validate with our internal data bases and Subject matter experts. This comprehensive model enables us to deliver high quality, reliable data in shortest possible time.

Your data will never be shared with third parties, however, we may send you information from time to time about our products that may be of interest to you. By submitting your details, you agree to be contacted by us. You may contact us at any time to opt-out.

Related Reports