
加固型服务器市场趋势、需求及2034年增长情况
加固型服务器市场规模及预测(2021-2034 年)、全球及区域份额、趋势和增长机会分析报告涵盖范围:按类型(加固型机架式服务器、加固型刀片服务器、加固型边缘服务器及其他)、内存容量(小于 256 GB、256 GB 至 512 GB、512 GB 至 1 TB 和大于 1 TB)、应用(标准型和专用型)、最终用户(国防和军事、石油和天然气、能源和公用事业、电信、航空航天、运输和物流及其他)以及地理位置(北美、欧洲、亚太地区、中东和非洲以及南美和中美洲)划分。
- 状态 : 已发布
- 报告代码 : TIPRE00011143
- 类别 : 电子和半导体
- 页数 : 310
- 可用报告格式 :


- 最后更新日期 : April 30, 2026

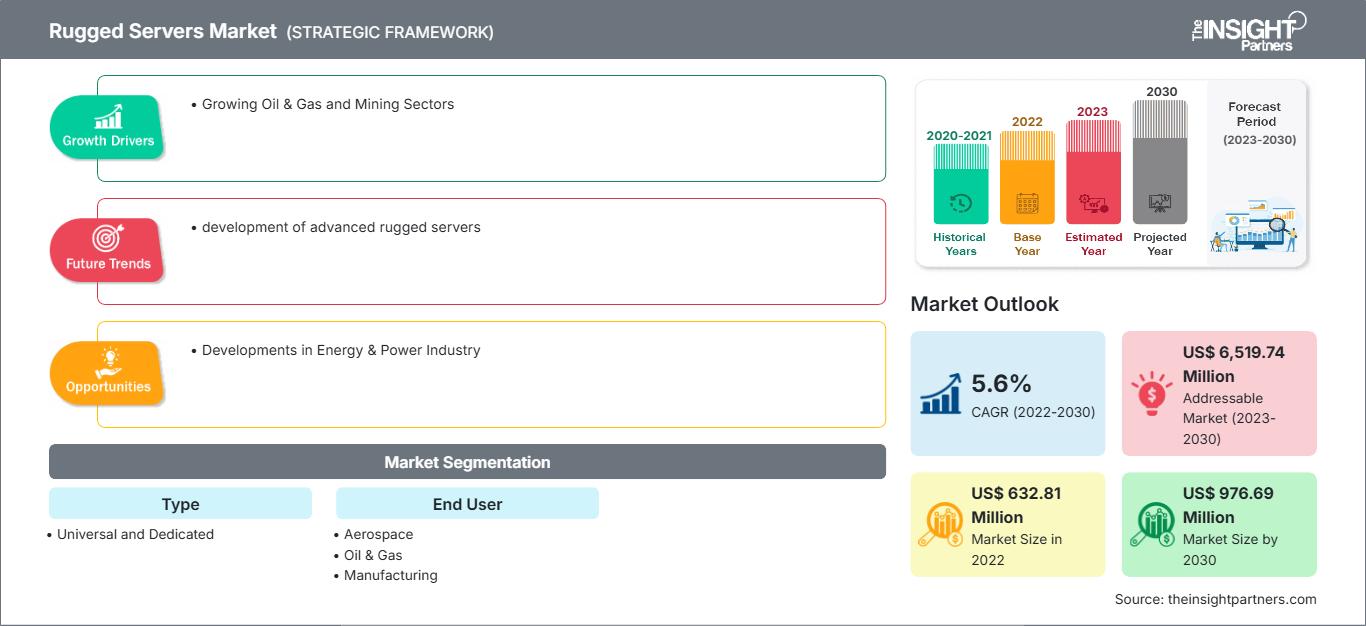
预计加固型服务器市场规模将从2025年的7.1611亿美元增长至2034年的13.7646亿美元。该市场预计在2026年至2034年间将以7.5%的复合年增长率增长。
加固型服务器市场分析
加固型服务器市场专注于专为军事、工业和远程操作等严苛环境设计的耐用、高性能计算系统。国防、石油天然气和边缘计算领域的需求是推动市场增长的主要动力。关键趋势包括紧凑型设计、增强的连接性以及在极端条件下物联网和人工智能应用的日益普及。
加固型服务器市场概览
加固型服务器是专为在高温、振动、灰尘和高湿度等极端条件下可靠运行而设计的专用计算系统。这些服务器广泛应用于航空航天、交通运输、能源和现场作业等领域。远程位置对实时数据处理日益增长的需求推动了市场增长。边缘计算、5G集成以及模块化、节能设计的进步正在塑造未来的需求。
市场调研亮点
- 2022年,北美市场占据主导地位,市场份额为42.4%。
- 亚太地区预计在预测期内将以 6.4% 的复合年增长率增长。
- 预计美国市场在预测期内将以 5.9% 的复合年增长率增长。
- 按类型划分,专用设备细分市场在 2022 年占据了最大的市场份额,达到 66.3%。
- 按最终用户划分,预计航空航天领域将实现最快增长,在预测期内复合年增长率将达到 7.1%。
- 该报告重点介绍了戴尔科技公司、Core Systems公司、Crystal Group公司、Mercury Systems公司、Systel公司、Trenton Systems公司、CP Technologies LLC、Emet OEM Solutions公司、Sparton公司、NCS Technologies公司等主要行业参与者,同时分析了可能重塑未来市场的新理念、颠覆性产品和创新服务方面的关键发展,并揭示了整个行业的新兴主题。
根据您的需求定制此报告
获取免费定制服务加固型服务器市场:战略洞察
-
获取本报告的主要市场趋势。这份免费样品将包含数据分析,内容涵盖市场趋势、估算和预测等。
加固型服务器市场驱动因素和机遇
市场驱动因素:
- 国防和军事需求增加:国防和战场行动中部署的增加推动了对能够应对极端条件、安全数据处理并满足关键任务可靠性要求的坚固型服务器的需求。
- 边缘计算应用的增长:边缘计算在偏远和恶劣环境中的扩展促进了坚固型服务器的采用,以实现实时数据处理、低延迟和提高运营效率。
- 工业自动化扩张:制造业、石油天然气和采矿业的快速工业自动化增加了对耐用服务器的需求,以确保在恶劣的工作环境中不间断运行。
市场机遇:
- 与 5G 网络集成:5G 技术的出现为坚固耐用的服务器提供了支持高速连接的机会,从而实现了更快的数据传输和增强远程应用的性能。
- 智能交通领域的应用日益广泛:包括铁路和自动驾驶汽车在内的智能交通系统不断发展,为坚固耐用的服务器提供了可靠地管理数据处理、通信和安全操作的机会。
- 对紧凑型和模块化设计的需求:对紧凑、轻便、模块化的坚固型服务器的偏好日益增长,这为制造商开发适合空间受限环境的灵活、可扩展的解决方案提供了机会。
加固型服务器市场报告细分分析
为了解加固型服务器市场的结构、增长前景和新兴趋势,该市场被划分为不同的细分市场。以下是行业报告中常用的标准细分方法:
按类型:
- 坚固型机架式服务器:坚固型机架式服务器采用标准化的机架配置,提供高性能计算能力,能够承受极端环境条件。这些服务器广泛应用于国防、航空航天、工业自动化、石油天然气和交通运输等行业,在这些行业中,可靠性、可扩展性和耐用性至关重要。
- 坚固型刀片服务器:坚固型刀片服务器凭借其紧凑、高密度的架构以及在较小的物理空间内提供强大的计算能力,正在市场上获得越来越多的关注。
- 坚固型边缘服务器:由于对在数据生成源附近进行实时数据处理的需求不断增长,坚固型边缘服务器正在成为一个关键的增长市场领域。
- 其他:在坚固型服务器市场中,塔式服务器作为基础计算平台,专为严苛且任务关键型的环境而设计,在这些环境中,耐用性、可扩展性和可维护性至关重要。
按内存大小:
- 小于 256 GB:小于 256 GB 的内存段主要面向计算和存储需求适中的应用。
- 256 GB 至 512 GB:256 GB 至 512 GB 内存级别在全球加固型服务器市场中占据中端位置,在性能、可扩展性和成本效益方面实现了平衡。
- 512 GB 至 1 TB:512 GB 至 1 TB 内存级别代表了全球加固型服务器市场中的高性能类别,旨在支持数据密集型和任务关键型应用。
- 大于 1 TB: “大于 1 TB” 内存细分市场代表了全球加固型服务器市场的高端级别,满足了数据密集型和计算要求高的应用的需求。
按申请方式:
- 标准
- 投入的
由最终用户提供:
- 国防和军事
- 国防和军事
- 石油和天然气
- 能源与公用事业
- 电信
- 航空航天
- 运输与物流
- 其他的
按地理位置:
- 北美
- 欧洲
- 亚太地区
- 南美洲和中美洲
- 中东和非洲
加固型服务器市场报告范围
| 报告属性 | 细节 |
|---|---|
| 2025年市场规模 | 7.1亿美元 |
| 到2034年市场规模 | 13.7亿美元 |
| 全球复合年增长率(2026-2034 年) | 7.5% |
| 史料 | 2021-2024 |
| 预测期 | 2026-2034 |
| 涵盖部分 |
按类型
|
| 覆盖地区和国家 |
北美
|
| 市场领导者和主要公司简介 |
|
加固型服务器市场参与者密度:了解其对业务动态的影响
加固型服务器市场正快速增长,这主要得益于终端用户需求的不断增长,而终端用户需求的增长又源于消费者偏好的转变、技术的进步以及对产品优势认知的提高。随着需求的增长,企业不断拓展产品和服务,持续创新以满足消费者需求,并把握新兴趋势,这些都进一步推动了市场增长。
按地域划分的加固型服务器市场份额分析
亚太地区加固型服务器市场正经历快速增长,这主要得益于国防投资的增加、工业自动化程度的提高、边缘计算的日益普及、基础设施项目的不断增长,以及对恶劣和偏远环境下可靠计算解决方案的需求。此外,5G 连接的进步、物联网的日益普及、政府现代化举措以及对实时数据处理需求的不断增长也进一步推动了市场增长。
由于工业发展水平、国防开支、基础设施成熟度、环境条件和技术普及率的差异,加固型服务器市场在不同地区的增长情况各不相同。以下是各地区市场份额和趋势的概述:
1. 北美洲
- 市场份额:占据全球市场相当大的份额
-
关键驱动因素:
- 强大的国防和军事现代化计划:美国对国防的大力投资推动了对坚固耐用服务器的需求,因为军事行动需要高度耐用、安全可靠的计算系统,能够在极端的战场条件下运行。
- 边缘计算技术高度普及
- 先进的工业自动化和工业物联网集成
- 趋势:本地化边缘数据中心的日益部署支持低延迟处理,并增强了远程和关键任务环境中加固型服务器的性能。
2. 欧洲
- 市场份额:由于欧盟早期出台的严格法规,占据了相当大的份额。
-
关键驱动因素:
- 日益关注智能制造:欧洲在工业 4.0 框架下大力推进智能工厂,推动了对坚固耐用型服务器的需求,从而能够在恶劣的制造环境中实现实时监控、自动化和数据处理。
- 增加对交通基础设施的投资
- 严格的工业安全性和可靠性标准。
- 趋势:日益严格的环境法规。
3. 亚太地区
- 市场份额:增长最快的地区,占据主导市场份额
-
关键驱动因素:
- 快速的工业化和城市化:中国和印度等国家的快速工业增长增加了对坚固耐用的服务器的需求,以支持可靠的运行、自动化和实时数据处理。
- 新兴经济体国防预算不断增长
- 电信和5G基础设施的扩展
- 趋势:电信网络不断扩张和 5G 部署。
4. 中东和非洲
- 市场份额:市场份额较小,但增长迅速
-
关键驱动因素:
- 石油和天然气行业的扩张:石油和天然气业务的增长增加了对坚固耐用型服务器的需求,从而能够在极端温度和偏远沙漠环境中,在基础设施支持最少的情况下,实现可靠的数据处理、监控和控制。
- 智慧城市计划不断推进
- 国防和安全领域的投资不断增长
- 趋势:智慧城市项目推动坚固型服务器部署。
5. 南美洲和中美洲
- 市场份额:市场份额稳步增长
-
关键驱动因素:
- 采矿和石油行业的增长;采矿和石油勘探活动的扩张推动了对坚固耐用型服务器的需求,因为这些行业需要强大的计算系统才能在偏远、恶劣和环境挑战性强的地区高效运行。
- 增加基础设施开发项目
- 远程监控系统日益普及
- 趋势:采矿和石油行业对加固型服务器的需求增加。
市场密度高,竞争激烈
市场竞争非常激烈,主要全球参与者包括 Core Systems、CP North America、Crystal Group Inc.、Dell Inc.、Mercury Systems Inc.、Systel Inc.、Trenton Systems Inc.、Kontron AG、Advantech Co., Ltd.、Hiper Global、Rugged Science、H3 Platform, Inc.、General Micro Systems, Inc.、Parry Labs、Curtiss-Wright Corporation、RAVE Computers 和 Zmicro, Inc.。
激烈的竞争促使企业通过提供以下服务来脱颖而出:
- 创新且高性能的加固型服务器解决方案
- 先进的连接性,包括 5G 和物联网集成
- 定制和模块化配置能力
- 可靠、安全且实时的数据处理功能
- 扩展的产品组合
机遇与战略举措
- 拓展边缘计算市场——企业可以通过提供专为远程环境中的低延迟、实时处理而设计的坚固型服务器,利用不断增长的边缘部署市场。
- 与 5G 和物联网生态系统集成——利用 5G 和物联网可增强连接性和性能,从而在各行各业开辟新的应用领域。
免责声明:以上列出的公司不分先后顺序。
研究过程中还分析了其他公司。
- Captec集团有限公司
- Sritech
- Unitronix AU
- Acme便携式机械公司
- 五角大楼坚固系统私人有限公司
- NCS Technologies Inc.
- 艾尔玛电子
- Beltronic IPC AG
- 欧泰克股份公司
加固型服务器市场新闻及最新动态
- Crystal Group变电站服务器获得IEC 61850-3认证——2026年1月,领先的高性能加固型计算解决方案提供商Crystal Group, Inc.宣布,其ES3604L24变电站服务器已获得IEC 61850-3认证。这一里程碑式的成就进一步巩固了公司对互操作性、可靠性和基于标准的电网现代化建设的承诺。
- 晶晶集团将新一代处理组件集成到产品组合中——2026年2月,晶晶集团宣布将新一代处理组件集成到其服务器和嵌入式计算机产品组合中。通过与行业领先的合作伙伴紧密合作,该公司持续积极主动地将最新技术融入其坚固耐用的解决方案中。
加固型服务器市场报告涵盖范围及成果
《加固型服务器市场规模及预测(2021-2034)》报告对市场进行了详细分析,涵盖以下领域:
- 本报告涵盖全球、区域和国家层面的加固型服务器市场规模及预测,包括所有关键细分市场。
- 加固型服务器市场趋势,以及驱动因素、制约因素和关键机遇等市场动态
- 详细的PEST和SWOT分析
- 加固型服务器市场分析,涵盖关键市场趋势、全球和区域框架、主要参与者、法规以及近期市场发展动态。
- 加固型服务器市场行业格局及竞争分析,涵盖市场集中度、热力图分析、主要参与者及最新发展动态
- 公司详细概况

Naveen 是一位经验丰富的市场研究和咨询专业人士,在定制项目、联合项目和咨询项目方面拥有超过 9 年的专业经验。他目前担任副总裁,成功管理了项目价值链中的利益相关者,撰写了 100 多份研究报告和 30 多项咨询项目。他的工作涵盖工业和政府项目,为客户的成功和数据驱动的决策做出了重要贡献。
Naveen 拥有卡纳塔克邦 VTU 的电子与通信工程学位,以及马尼帕尔大学的市场营销与运营 MBA 学位。他已担任 IEEE 会员 9 年,积极参与各种会议、技术研讨会,并在分部和地区层面担任志愿者。在此之前,他曾担任 IndustryARC 的助理战略顾问和惠普(惠普全球)的工业服务器顾问。
- 全面的市场规模与预测分析
- 详细的细分市场分析
- 深入的市场动态评估
- 区域及国家级洞察
- 竞争格局与企业对标分析
- 战略性商业情报
客户评价
Insight Partners 的 SCADA 系统市场报告内容全面,对当前趋势和未来预测提供了宝贵的见解。该团队始终高度专业、响应迅速且乐于助人。我们非常满意,强烈推荐他们的服务。
兰·凯德姆 伙伴, Reali Technologies LTD我请求一份关于特定软件市场的报告,团队在几天内就完成了。报告信息非常相关,而且呈现得非常出色。之后,我请求对报告进行一些修改和补充。团队再次迅速响应,不到一周我就收到了最终报告。
让-埃尔韦·詹恩 主席, 未来分析公司我们与 Insight Partners 合作进行了一项重要的市场研究和预测。他们清晰地洞察了机遇和风险,帮助我们制定了计划。他们的研究简单易用,数据可靠,帮助我们做出了明智而自信的决策。我们强烈推荐他们。
皮尤什·纳格帕尔 高级副总裁, 远光全球Insight Partners 凭借其深厚的行业专业知识,提供了富有洞察力、结构合理的市场研究。他们的团队始终专业且响应迅速。用户友好的网站让访问行业报告变得顺畅无阻。我们强烈推荐他们可靠、高质量的研究服务。
安达幸彦 首席执行官, 深蓝有限责任公司这是我第一次从The Insight Partners购买市场报告。起初我有些犹豫,但访问了他们的网站后,我更放心地冒险购买市场报告。我对报告的质量和客户服务非常满意。我对最初的报告有一些疑问和意见,但在与他们的分析师通过电子邮件沟通了几次后,我相信这份报告可以作为我们战略规划流程的参考。非常感谢您抽出宝贵的时间,让这次体验如此愉快。我一定会向其他人推荐你们的服务,当我们需要更多市场数据时,你们将是我的首选。
约翰·铃木 总裁兼首席执行官、董事会董事, BK科技感谢您在处理我关于尼日利亚传染病体外诊断市场信息请求的过程中所展现的支持和专业精神。感谢您的耐心、指导,以及您愿意提供的折扣,最终促成了这笔交易。我期待未来与 Insight Partners 继续合作,这一切都要归功于您与我初次接触后留下的良好印象。
奇吉奥克博士 ONYIA 董事总经理, PineCrest 医疗保健有限公司购买理由
- 明智的决策
- 了解市场动态
- 竞争分析
- 客户洞察
- 市场预测
- 风险规避
- 战略规划
- 投资论证
- 识别新兴市场
- 优化营销策略
- 提升运营效率
- 顺应监管趋势


