نظرة عامة على السوق لرسم الخرائط والنمذجة ثلاثية الأبعاد والنمو والاتجاهات والتحليل وتقرير البحث (2021-2031)
البيانات التاريخية : 2021-2022 | سنة الأساس : 2023 | فترة التنبؤ : 2023-2031حجم سوق رسم الخرائط والنمذجة ثلاثية الأبعاد وتوقعاته (2021-2031)، والحصة العالمية والإقليمية، والاتجاهات، وتحليل فرص النمو. يغطي التقرير: حسب وضع النشر (السحابي والمحلي)، وحجم المؤسسة (الشركات الصغيرة والمتوسطة والكبيرة)، والمكون (أدوات وخدمات البرمجيات)، وتطبيق رسم الخرائط ثلاثية الأبعاد (الفحص والقياس، وإعادة بناء الكائنات، والإسقاط والملاحة، وإعداد التقارير والافتراض، وتطبيقات رسم الخرائط ثلاثية الأبعاد الأخرى)، وتطبيق النمذجة ثلاثية الأبعاد (تسويق المنتجات، والرسوم المتحركة والأفلام، والألعاب والتصميم، والرسم المعماري، وتطبيقات النمذجة ثلاثية الأبعاد الأخرى)، والقطاعات الرأسية (التجزئة والسلع الاستهلاكية، والهندسة والبناء، والرعاية الصحية وعلوم الحياة، والنقل والخدمات اللوجستية، والحكومة والدفاع، والطاقة والمرافق، والإعلام والترفيه، والتصنيع، والقطاعات الرأسية الأخرى)، وحسب الموقع الجغرافي.
- تاريخ التقرير : Feb 2026
- رمز التقرير : TIPTE100000786
- الفئة : التكنولوجيا والإعلام والاتصالات
- الحالة : البيانات الصادرة
- تنسيقات التقارير المتاحة :


- عدد الصفحات : 150
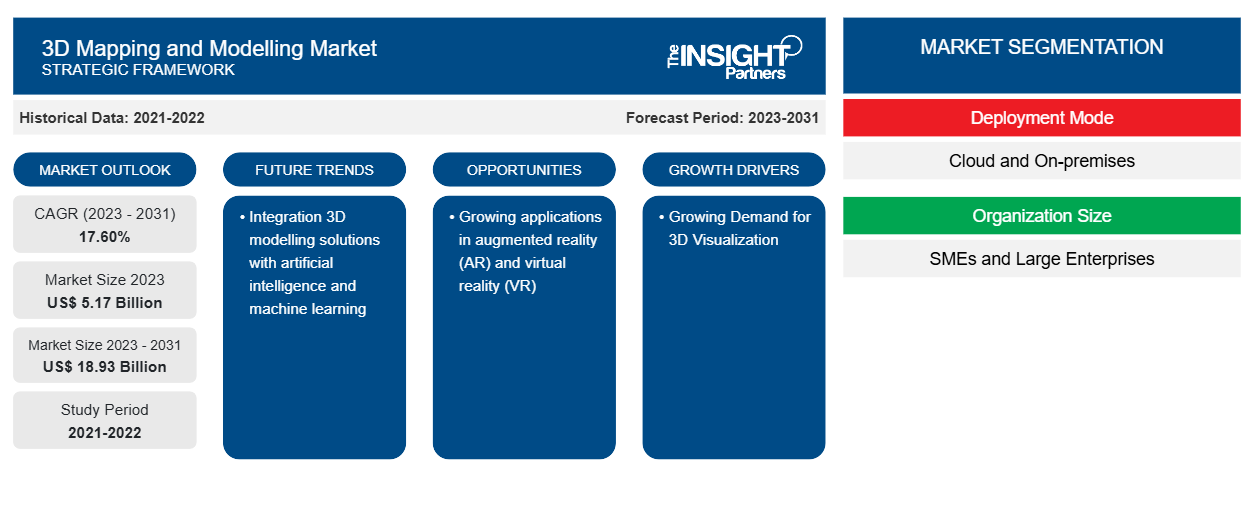
من المتوقع أن يصل حجم سوق رسم الخرائط والنمذجة ثلاثية الأبعاد إلى 18.93 مليار دولار أمريكي بحلول عام 2031 من 5.17 مليار دولار أمريكي في عام 2023. ومن المتوقع أن يسجل السوق معدل نمو سنوي مركب بنسبة 17.60٪ خلال الفترة 2023-2031. ومن المرجح أن يظل دمج حلول النمذجة ثلاثية الأبعاد مع الذكاء الاصطناعي والتعلم الآلي من الاتجاهات الرئيسية في السوق.
تحليل سوق رسم الخرائط والنمذجة ثلاثية الأبعاد
إن الحاجة المتزايدة إلى الرسوم المتحركة ثلاثية الأبعاد، والتطورات التقنية في معدات المسح ثلاثي الأبعاد، والطلب المتزايد على المحتوى ثلاثي الأبعاد، وزيادة أجهزة العرض ثلاثية الأبعاد هي بعض العوامل الرئيسية التي تدفع سوق رسم الخرائط والنمذجة ثلاثية الأبعاد في جميع أنحاء العالم. وعلاوة على ذلك، فإن الاستخدام المتزايد والتكامل لتقنيات مثل الذكاء الاصطناعي والتعلم الآلي في برامج رسم الخرائط والنمذجة ثلاثية الأبعاد لتحسين دقة المحتوى ثلاثي الأبعاد يغذي توسع السوق. ومن المتوقع أن توفر كل هذه الأسباب إمكانيات تطوير كافية للمشاركين في السوق طوال فترة التنبؤ.
نظرة عامة على سوق رسم الخرائط والنمذجة ثلاثية الأبعاد
تتيح منصات رسم الخرائط والنمذجة ثلاثية الأبعاد للمستخدمين إنشاء نماذج وخرائط أساسية ثلاثية الأبعاد للعناصر والمواقع. تساعد هذه التقنيات أيضًا في تصور البيانات الجغرافية/الموقعية وطرح الأسئلة وتحليلها وتفسيرها، مما يسمح للمستخدمين بفهم الروابط والأنماط والاتجاهات بين العوامل المختلفة من أجل حل تحديات الأعمال في العالم الحقيقي. تستخدم الشركات والأفراد في جميع أنحاء العالم تقنيات رسم الخرائط والنمذجة ثلاثية الأبعاد لتحسين العمليات وزيادة الكفاءة وتعظيم استخدام الموارد من خلال تحديد مناطق المشاكل والعناصر التي تتطلب التغيير. تُستخدم هذه الأدوات بشكل شائع في الشركات التي تركز على الأرض مثل الهندسة والبناء والتصنيع والنقل والخدمات اللوجستية والعديد من التطبيقات الأخرى لإدارة الخدمات الميدانية وإدارة الأرضيات وإدارة الأصول وإدارة المخزون. تُستخدم الأدوات ثلاثية الأبعاد أيضًا لتطبيقات تصميم البناء/الهندسة المعمارية والهندسة المدنية. تعد الليدار والسونار والرادار والتصوير الفوتوغرامتري من أكثر تقنيات رسم الخرائط ثلاثية الأبعاد شيوعًا، ويمكن أن تتضمن النمذجة ثلاثية الأبعاد نمذجة الإطار السلكي والسطح والصلب.
قم بتخصيص هذا التقرير ليناسب متطلباتك
ستحصل على تخصيص لأي تقرير - مجانًا - بما في ذلك أجزاء من هذا التقرير، أو تحليل على مستوى الدولة، وحزمة بيانات Excel، بالإضافة إلى الاستفادة من العروض والخصومات الرائعة للشركات الناشئة والجامعات
سوق رسم الخرائط والنمذجة ثلاثية الأبعاد: رؤى استراتيجية
-
احصل على أهم اتجاهات السوق الرئيسية لهذا التقرير.ستتضمن هذه العينة المجانية تحليلاً للبيانات، بدءًا من اتجاهات السوق وحتى التقديرات والتوقعات.
محركات وفرص سوق رسم الخرائط والنمذجة ثلاثية الأبعاد
Growing Demand for 3D Visualization to Favor Market
There is a growing need for 3D visualization in several industries. The use of visual effects technology (VFX) in films, the usage of 3D mobile apps and gaming, and the rising trend of digital marketing are all contributing to the growth of the 3D mapping and modelling market. For instance, the gaming business uses 3D visualization to create immersive experiences using 3D game materials, characters, and locations. The marketing and retail industries employ 3D visualization for prototyping, developing visuals for campaigns, and improving consumer experiences. Moreover, 3D visualization is essential in healthcare for applications including medical imaging, surgical planning, and patient education.
Growing applications in augmented reality (AR) and virtual reality (VR)
Augmented Reality (AR) and Virtual Reality (VR) technologies are rapidly expanding and being implemented in a variety of sectors. These technologies use 3D models to create immersive digital experiences that change the way users interact with the world around them. AR facilitates the actual world by incorporating digital components such as photos, videos, and text into physical surroundings. It enables the overlay of digital information on real-world things, improving our perception and knowledge of the environment. VR, on the other hand, creates completely virtual experiences by transferring users to digitally created surroundings. It develops immersive simulations that may be utilized for teaching, entertainment, and other purposes.
3D Mapping and Modelling Market Report Segmentation Analysis
Key segments that contributed to the derivation of the 3D mapping and modelling market analysis are deployment mode, organization size, component, 3D mapping application, 3D modelling application, and vertical.
- Based on deployment mode, the market is segmented by cloud and on-premises. The on-premises segment dominated the market share in 2023.
- Based on organization size, the market is segmented into SMEs and large enterprises. The large enterprises segment held the largest share of the market in 2023.
- Based on component, the market is segmented into software tools and services. The software tools segment held the largest share of the market in 2023.
- Based on 3D mapping application, the market is segmented into inspection and measurement, object reconstruction, projection and navigation, reporting and virtualization, and other 3d mapping applications. The inspection and measurement segment held the largest share of the market in 2023.
- Based on 3D modelling application, the market is segmented into product marketing, animation and movies, gaming and designing, architectural rendering, and other 3d modelling applications. The product marketing segment held the largest share of the market in 2023.
- Based on vertical, the market is segmented into retail and consumer goods, engineering and construction, healthcare and life sciences, transportation and logistics, government and defense, energy and utilities, media and entertainment, manufacturing, and other verticals. The engineering and construction segment held the largest share of the market in 2023.
3D Mapping and Modelling Market Share Analysis by Geography
The geographic scope of the 3D mapping and modelling market report is mainly divided into five regions: North America, Asia Pacific, Europe, Middle East & Africa, and South & Central America.
North America dominated the 3D Mapping and Modelling market in 2023. This dominance can be attributed to the region's developing ecosystem of tech-driven companies. Construction, urban planning, and driverless cars all benefit from the usage of 3D mapping and modelling technology. Moreover, North America is home to key companies in 3D mapping and modelling, including Autodesk, Trimble, Inc., and Bentley Systems, among others. The existence of these firms, together with their experience and resources, adds to the region's market supremacy.
3D Mapping and Modelling Market Regional Insights
The regional trends and factors influencing the 3D Mapping and Modelling Market throughout the forecast period have been thoroughly explained by the analysts at Insight Partners. This section also discusses 3D Mapping and Modelling Market segments and geography across North America, Europe, Asia Pacific, Middle East and Africa, and South and Central America.

- Get the Regional Specific Data for 3D Mapping and Modelling Market
3D Mapping and Modelling Market Report Scope
| Report Attribute | Details |
|---|---|
| Market size in 2023 | US$ 5.17 Billion |
| Market Size by 2031 | US$ 18.93 Billion |
| Global CAGR (2023 - 2031) | 17.60% |
| Historical Data | 2021-2022 |
| Forecast period | 2023-2031 |
| Segments Covered |
By Deployment Mode
|
| Regions and Countries Covered |
North America
|
| Market leaders and key company profiles |
|
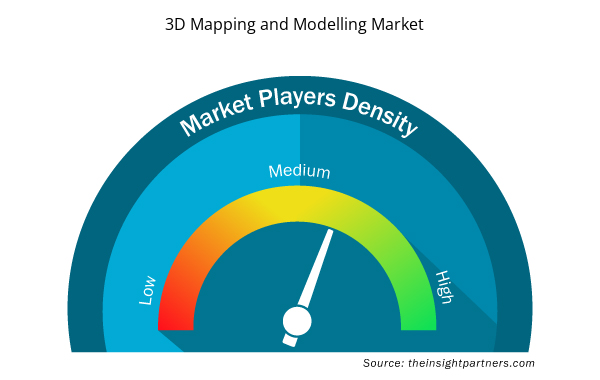
Market Players Density: Understanding Its Impact on Business Dynamics
The 3D Mapping and Modelling Market market is growing rapidly, driven by increasing end-user demand due to factors such as evolving consumer preferences, technological advancements, and greater awareness of the product's benefits. As demand rises, businesses are expanding their offerings, innovating to meet consumer needs, and capitalizing on emerging trends, which further fuels market growth.
Market players density refers to the distribution of firms or companies operating within a particular market or industry. It indicates how many competitors (market players) are present in a given market space relative to its size or total market value.
Major Companies operating in the 3D Mapping and Modelling Market are:
- Autodesk
- Saab AB
- Golden Software
- Trimble
- Bentley Systems
- Alphabet
Disclaimer: The companies listed above are not ranked in any particular order.
- Get the 3D Mapping and Modelling Market top key players overview
3D Mapping and Modelling Market News and Recent Developments
The 3D mapping and modelling market is evaluated by gathering qualitative and quantitative data post primary and secondary research, which includes important corporate publications, association data, and databases. A few of the developments in the 3D Mapping and Modelling market are listed below:
- Autodesk announced Project Bernini. This new research effort offers the first experimental generative AI model that quickly generates superior 3D shapes from a variety of inputs, including a single 2D image, multiple images showing different views of an object, point clouds, voxels, and text. Project Bernini is intended to create generative models that could be used in different fields like architecture, product design, entertainment, and more to generate functional 3D structures that can be used in real-world applications and align with the designer’s vision. (Source: Autodesk, Press Release, May 2024)
- Trimble announced the Trimble X9 3D laser scanning system, a new versatile reality capture solution for surveying, construction and engineering professionals. The X9 is built on Trimble’s proven laser scanning technologies, engineered to enhance performance in more environments while leveraging innovations such as Trimble X-Drive technology for automatic instrument calibration, survey-grade self-leveling and laser pointer for georeferencing. (Source: Trimble, Press Release, June 2023)
3D Mapping and Modelling Market Report Coverage and Deliverables
The “3D Mapping and Modelling Market Size and Forecast (2021–2031)” report provides a detailed analysis of the market covering below areas:
- 3D Mapping and Modelling market size and forecast at global, regional, and country levels for all the key market segments covered under the scope
- 3D Mapping and Modelling market trends as well as market dynamics such as drivers, restraints, and key opportunities
- Detailed PEST/Porter’s Five Forces and SWOT analysis
- تحليل سوق رسم الخرائط والنمذجة ثلاثية الأبعاد يغطي اتجاهات السوق الرئيسية والإطار العالمي والإقليمي والجهات الفاعلة الرئيسية واللوائح والتطورات الأخيرة في السوق
- تحليل المشهد الصناعي والمنافسة الذي يغطي تركيز السوق، وتحليل خريطة الحرارة، واللاعبين البارزين، والتطورات الأخيرة لسوق رسم الخرائط والنمذجة ثلاثية الأبعاد
- ملفات تعريف الشركة التفصيلية

أنكيتا خبيرة ديناميكية في أبحاث السوق والاستشارات، تتمتع بخبرة تزيد عن 8 سنوات في قطاعات التكنولوجيا والإعلام وتكنولوجيا المعلومات والاتصالات والإلكترونيات وأشباه الموصلات. وقد قادت ونفذت بنجاح أكثر من 100 مهمة استشارية وبحثية لعملاء عالميين مثل مايكروسوفت وأوراكل وشركة NEC وSAP وKPMG وExpeditors International. تشمل كفاءاتها الأساسية تقييم السوق، وتحليل البيانات، والتنبؤ، وصياغة الاستراتيجيات، والاستخبارات التنافسية، وكتابة التقارير.
أنكيتا بارعة في إدارة دورات المشاريع الكاملة، بدءًا من تصميم عروض ما قبل البيع ومناقشات العملاء، وصولًا إلى تقديم رؤى عملية بعد البيع. كما أنها ماهرة في إدارة فرق متعددة الوظائف، وهيكلة وحدات بحثية معقدة، ومواءمة الحلول مع أهداف العمل الخاصة بالعملاء. وقد مكنتها مهاراتها الممتازة في التواصل والقيادة والعرض التقديمي من تحقيق نتائج قيّمة باستمرار في بيئات سوقية سريعة التطور.
- التحليل التاريخي (سنتان)، سنة الأساس، التوقعات (7 سنوات) مع معدل النمو السنوي المركب
- تحليل PEST و SWOT
- حجم السوق والقيمة / الحجم - عالمي، إقليمي، بلد
- الصناعة والمنافسة
- مجموعة بيانات إكسل
التقارير الحديثة
تقارير ذات صلة
شهادات العملاء
تقرير سوق أنظمة SCADA من Insight Partners شامل، ويقدم رؤى قيّمة حول الاتجاهات الحالية والتوقعات المستقبلية. تميّز الفريق باحترافية عالية وسرعة في الاستجابة ودعم مستمر طوال الوقت. نحن راضون جدًا ونوصي بشدة بخدماتهم.
ران كيديم شريك, شركة ريالي تكنولوجيز المحدودةطلبتُ تقريرًا عن سوق برمجيات محدد، وأعدّه الفريق في غضون أيام قليلة. كانت المعلومات ذات صلة وثيقة وعرضها جيد. ثم طلبتُ بعض التعديلات والإضافات على التقرير. وكان الفريق متجاوبًا للغاية، وحصلتُ على التقرير النهائي في أقل من أسبوع.
جان هيرفيه جين رئيس مجلس الإدارة, فيوتشر أناليتيكاعملنا مع شركة "إنسايت بارتنرز" لإجراء دراسة سوقية وتوقعات مهمة. زودونا برؤى واضحة حول الفرص والمخاطر، مما ساعدنا في صياغة خططنا. كانت أبحاثهم سهلة الاستخدام ومبنية على بيانات دقيقة، مما ساعدنا على اتخاذ قرارات ذكية وواثقة. نوصي بهم بشدة.
بيوش ناجبال نائب الرئيس الأول, شعاع عالي عالميقدّمت شركة Insight Partners أبحاثًا سوقية ثاقبة ومنظمة جيدًا بخبرة واسعة في هذا المجال. تميّز فريقهم بالاحترافية وسرعة الاستجابة طوال الوقت. وسهّل موقعهم الإلكتروني سهل الاستخدام الوصول إلى تقارير القطاع. نوصي بهم بشدة لخدمات بحثية موثوقة وعالية الجودة.
يوكيهيكو أداتشي المدير التنفيذي, ديب بلو، ذ.م.م.هذه أول مرة أشتري فيها تقرير سوق من The Insight Partners. رغم أنني كنت مترددًا في البداية، إلا أنني زرت موقعهم الإلكتروني وشعرت براحة أكبر للمخاطرة وشراء تقرير السوق. أنا راضٍ تمامًا عن جودة التقرير وخدمة العملاء. كانت لديّ عدة أسئلة وتعليقات حول التقرير الأولي، ولكن بعد بضع محادثات عبر البريد الإلكتروني مع محللهم، أعتقد أن لديّ تقريرًا يمكنني استخدامه كمدخل لعملية التخطيط الاستراتيجي لدينا. شكرًا جزيلاً لكم على تخصيص وقتكم الإضافي وجعل هذه التجربة إيجابية. سأوصي بخدماتكم للآخرين بالتأكيد، وستكونون أول من ألجأ إليه عندما نحتاج إلى المزيد من بيانات السوق.
جون سوزوكي الرئيس والرئيس التنفيذي وعضو مجلس الإدارة, بي كيه تكنولوجيزأود أن أقدّر دعمكم واحترافيتكم في الاستجابة لطلبي للحصول على معلومات بشأن سوق التشخيص المخبري للأمراض المعدية في نيجيريا. كما أُقدّر صبركم وتوجيهكم، واستعدادكم لتقديم خصم، مما مكّننا في النهاية من إتمام الصفقة. أتطلع إلى التعامل مع "ذا إنسايت بارتنرز" مستقبلًا، كل ذلك بفضل الانطباع الذي تركتموه لديّ نتيجةً لهذا اللقاء الأول.
الدكتور تشيجيوك أونيا المدير الإداري, شركة باينكريست للرعاية الصحية المحدودةسبب الشراء
- اتخاذ قرارات مدروسة
- فهم ديناميكيات السوق
- تحليل المنافسة
- رؤى العملاء
- توقعات السوق
- تخفيف المخاطر
- التخطيط الاستراتيجي
- مبررات الاستثمار
- تحديد الأسواق الناشئة
- تحسين استراتيجيات التسويق
- تعزيز الكفاءة التشغيلية
- مواكبة التوجهات التنظيمية


 احصل على عينة مجانية ل - سوق رسم الخرائط والنمذجة ثلاثية الأبعاد