تقرير سوق مكبرات الصوت والمقارنة لعام 2030 حسب القطاعات والجغرافيا والديناميكيات والتطورات الأخيرة والرؤى الإستراتيجية
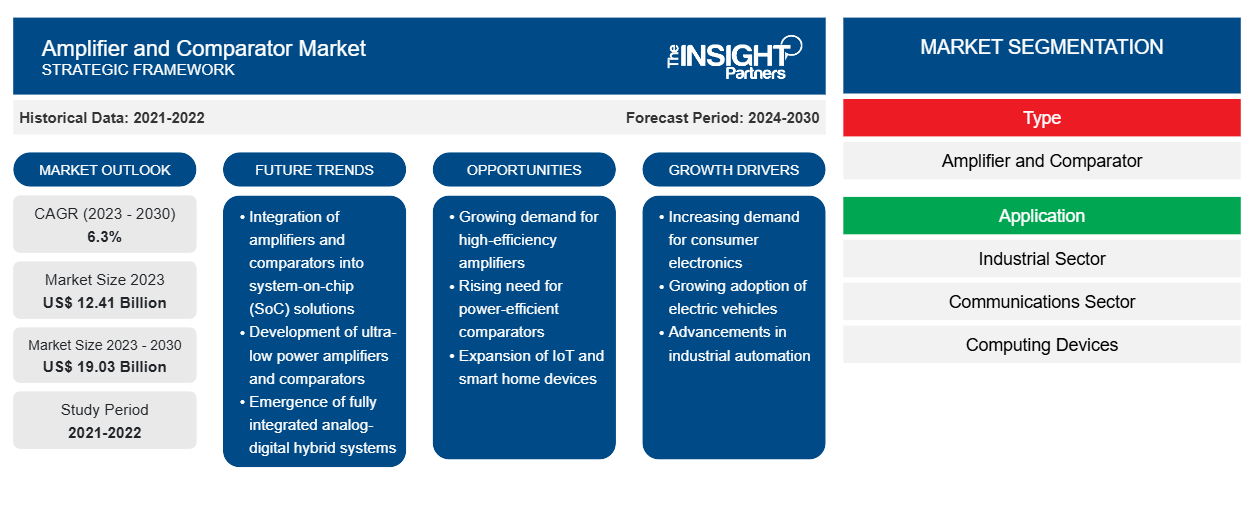
البيانات التاريخية : 2021-2022 | سنة الأساس : 2023 | فترة التنبؤ : 2024-2030توقعات سوق مكبرات الصوت وأجهزة المقارنة حتى عام ٢٠٣٠ - تحليل عالمي حسب النوع (مكبرات الصوت وأجهزة المقارنة)، والتطبيق (القطاع الصناعي، قطاع الاتصالات، أجهزة الحوسبة، الأجهزة الإلكترونية الاستهلاكية، السيارات، الصناعات العسكرية والفضائية، وغيرها)
- تاريخ التقرير : Jul 2023
- رمز التقرير : TIPRE00016955
- الفئة : الإلكترونيات وأشباه الموصلات
- الحالة : نُشرت
- تنسيقات التقارير المتاحة :


- عدد الصفحات : 167
[تقرير بحثي] من المتوقع أن ينمو سوق مكبرات الصوت والمقارنات من 12.41 مليار دولار أمريكي في عام 2023 إلى 19.03 مليار دولار أمريكي بحلول عام 2030؛ ومن المتوقع أن يسجل معدل نمو سنوي مركب بنسبة 6.3٪ من عام 2023 إلى عام 2030.
وجهة نظر المحلل:
إن الحاجة إلى أجهزة الحوسبة وزيادة إنتاج أجهزة الحوسبة هي بعض العوامل الرئيسية التي تدفع سوق مكبرات الصوت والمقارنات . مع الحاجة المتزايدة إلى أجهزة الحوسبة والإلكترونيات الاستهلاكية، تتخذ الحكومات المختلفة خطوات لزيادة إنتاج الإلكترونيات الاستهلاكية. أسست الحكومة الهندية الهند كمركز عالمي لتصميم وتصنيع أنظمة الإلكترونيات (ESDM) من خلال تعزيز وتطوير المهارات الوطنية لتصميم المكونات الرئيسية، مثل الشرائح، وتعزيز المناخ الذي يسمح للقطاع بالمنافسة دوليًا. وفقًا لمكتب المعلومات الصحفية (PIB)، فإن مخطط الحوافز المرتبطة بالإنتاج (PLI) لتصنيع الإلكترونيات على نطاق واسع والذي تم إطلاقه في عام 2020 بموجب السياسة الوطنية للإلكترونيات 2019 يقدم حوافز تتراوح من 4٪ إلى 6٪ على المبيعات الإضافية (على مدار سنة أساسية) للشركات المؤهلة. الشركات المصنعة للهواتف المحمولة والمكونات الإلكترونية المحددة، بما في ذلك وحدات التجميع والاختبار والوسم والتعبئة والتغليف (ATMP)، هي المستفيدون المؤهلون من المخطط.
نظرة عامة على سوق منطقة آسيا والمحيط الهادئ:
تنقسم سوق مكبرات الصوت والمقارنات في منطقة آسيا والمحيط الهادئ إلى كوريا الجنوبية والهند والصين واليابان وأستراليا وبقية منطقة آسيا والمحيط الهادئ. وتضم المنطقة العديد من الاقتصادات النامية - الهند والصين وإندونيسيا والفلبين. وتشهد هذه البلدان ارتفاعًا تدريجيًا في تبني التقنيات المتقدمة. علاوة على ذلك، فإن توافر تكاليف العمالة المنخفضة والضرائب والرسوم المنخفضة والنظام البيئي القوي للأعمال يجذب اللاعبين العالميين في صناعة التصنيع الإلكتروني لتوسيع مرافق التصنيع الخاصة بهم في هذه المنطقة. في سبتمبر 2021، أعلنت شركة Molex، إحدى الشركات المصنعة الرائدة عالميًا لأنظمة الاتصال الإلكترونية والكهربائية والألياف الضوئية ، أنها توسع عمليات التصنيع الحالية في هانوي، فيتنام. ومن المتوقع أن تدعم الشركة من خلال هذا التطور الاستراتيجي الطلب المتزايد على منتجاتها عبر تطبيقات مختلفة، بما في ذلك الهواتف الذكية وأجهزة التلفزيون والأجهزة المنزلية. وبالتالي، من المتوقع أن تقدم صناعة التصنيع المتنامية في منطقة آسيا والمحيط الهادئ فرصًا مربحة لسوق مكبرات الصوت والمقارنات في السنوات القادمة.
قم بتخصيص هذا التقرير ليناسب متطلباتك
ستحصل على تخصيص لأي تقرير - مجانًا - بما في ذلك أجزاء من هذا التقرير، أو تحليل على مستوى الدولة، وحزمة بيانات Excel، بالإضافة إلى الاستفادة من العروض والخصومات الرائعة للشركات الناشئة والجامعات
سوق مكبرات الصوت وأجهزة المقارنة: رؤى استراتيجية
-
احصل على أهم اتجاهات السوق الرئيسية لهذا التقرير.ستتضمن هذه العينة المجانية تحليلاً للبيانات، بدءًا من اتجاهات السوق وحتى التقديرات والتوقعات.
محرك السوق:
الاعتماد المتزايد على النقل الإلكتروني من شأنه أن يعزز نمو سوق وسائل منع الحمل
يُنظر إلى وسيلة النقل الإلكترونية على أنها مفيدة للبيئة وتقلل من استهلاك الوقود. تبنت العديد من الحكومات في جميع أنحاء العالم مبادرة المركبات الكهربائية (EVI)، وهي منتدى سياسي متعدد الحكومات يتم تنسيقه من قبل وكالة الطاقة الدولية (IEA) لتسريع إدخال وتبني المركبات الكهربائية في جميع أنحاء العالم. وفقًا لوكالة الطاقة الدولية، هناك 16 دولة تشارك حاليًا في هذا البرنامج: كندا وتشيلي والصين وفنلندا وفرنسا وألمانيا والهند واليابان وهولندا ونيوزيلندا والنرويج وبولندا والبرتغال والسويد والمملكة المتحدة والولايات المتحدة. البطارية الكهربائية هي مكون أساسي في وسيلة النقل الكهربائية. في هذه البطاريات، يتم استخدام خرج المقارن لتنبيه متحكم دقيق بشأن حالة التفريغ أو انخفاض الطاقة. أيضًا، يتم استخدام مكبر الصوت في إدارة بطارية المركبات الكهربائية، ويحدد إزاحة مكبر الصوت المعزول الدقة الأولية لاستشعار التيار. وبالتالي، فإن التطبيق واسع النطاق للمكبرات في البطاريات المطلوبة للنقل الإلكتروني من شأنه أن يعزز استهلاك مكبر الصوت والمقارن في المستقبل.
التحليل القطاعي:
بناءً على النوع، يتم تقسيم سوق مكبرات الصوت والمقارنات إلى مكبرات صوت ومقارنات. احتل قطاع مكبرات الصوت أكبر حصة في سوق مكبرات الصوت والمقارنات في عام 2022. كما من المرجح أن يكون قطاع مكبرات الصوت هو أسرع قطاع نموًا في سوق مكبرات الصوت والمقارنات خلال فترة التنبؤ. ويرجع هذا إلى الطلب المستمر على مكبرات الصوت القائمة على PCB (لوحة الدوائر المطبوعة) للمنتجات الإلكترونية المختلفة المستخدمة بين مختلف الصناعات في جميع أنحاء العالم. على سبيل المثال، الصناعات مثل الإلكترونيات الاستهلاكية والإلكترونيات العسكرية وإلكترونيات الطيران والفضاء والإلكترونيات للسيارات وغيرها من المنتجات الإلكترونية الصناعية التي تتضمن PCBs داخل المنتجات. هذا هو أحد العوامل الرئيسية التي تساعد في نمو سوق مكبرات الصوت والمقارنات لقطاع مكبرات الصوت.
تعتبر مكبرات الصوت من مكونات البناء الأساسية في أنظمة الاستشعار والاتصالات والتحكم، حيث تعمل على تكبير الإشارات الضعيفة. يعد الطلب المتزايد على الأجهزة المدمجة ومنخفضة الطاقة، والحاجة إلى اتصالات البيانات عالية السرعة، والزيادة المفاجئة في تطبيقات إنترنت الأشياء (IoT) من بين العوامل التي تدفع إلى استخدام مكبرات الصوت. في ديسمبر 2021، أعفت وزارة الاتصالات في الهند استخدام أجهزة أو معدات التردد اللاسلكي منخفضة الطاقة للغاية للتطبيقات الاستقرائية من متطلبات الترخيص. وفقًا لجمعيات الهواتف الخلوية والإلكترونيات الهندية (ICEA)، فإن إعفاء الأجهزة منخفضة الطاقة للغاية من الترخيص من شأنه أن يفيد قطاعات الاتصالات والإلكترونيات والقطاعات ذات الصلة في الأمد المتوسط إلى الطويل من خلال تشجيع استخدام هذه الأجهزة. تعمل مثل هذه المبادرات من قبل الحكومات على تعزيز الطلب على مكبرات الصوت ودفع نمو سوق مكبرات الصوت والمقارنات.
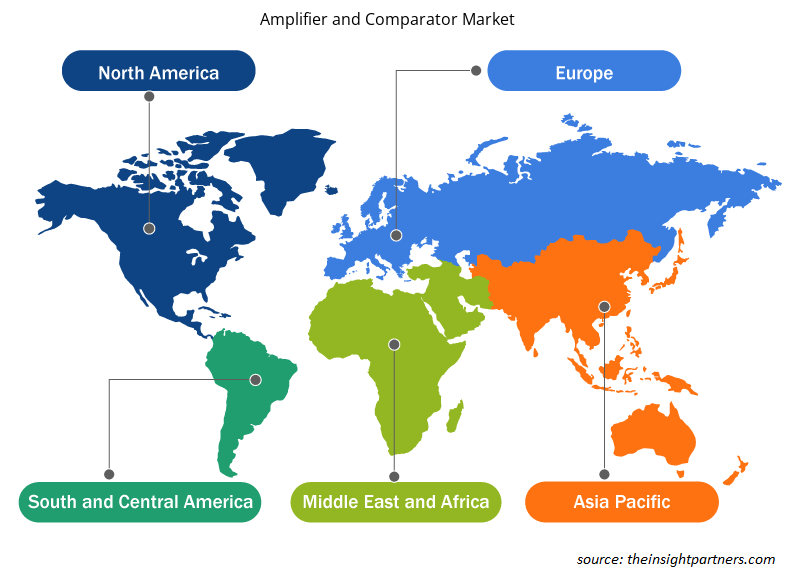
التحليل الإقليمي:
تم تقسيم سوق مكبرات الصوت والمقارنات إلى خمس مناطق رئيسية - أمريكا الشمالية وأوروبا وآسيا والمحيط الهادئ (APAC) والشرق الأوسط وأفريقيا (MEA) وأمريكا الجنوبية. في عام 2022، قادت أمريكا الشمالية سوق مكبرات الصوت والمقارنات بحصة كبيرة من الإيرادات، تليها أوروبا. علاوة على ذلك، من المتوقع أن تسجل منطقة آسيا والمحيط الهادئ أعلى معدل نمو سنوي مركب في سوق مكبرات الصوت والمقارنات من عام 2023 إلى عام 2030.
استحوذت منطقة آسيا والمحيط الهادئ على أكبر حصة في سوق مكبرات الصوت والمقارنات العالمية. أحد الأسباب الرئيسية وراء ارتفاع حصة سوق مكبرات الصوت والمقارنات في المنطقة هو وجود أكبر عدد من مصانع تصنيع أشباه الموصلات. علاوة على ذلك، فإن وجود دول مثل تايوان والصين واليابان وكوريا الجنوبية التي تعد واحدة من أكبر القواعد لتصنيع المنتجات الإلكترونية والمكونات هو عامل رئيسي آخر يدفع نمو سوق مكبرات الصوت والمقارنات في جميع أنحاء المنطقة.
علاوة على ذلك، من المرجح أن تكون المنطقة الأوروبية أسرع المناطق نموًا في تصنيع وبيع سوق مكبرات الصوت والمقارنات. ويرجع هذا بشكل أساسي إلى زيادة الطلب على إنشاء مصانع MEMS في جميع أنحاء المنطقة حيث تعمل العديد من الشركات جنبًا إلى جنب مع حكومات بلدان مختلفة بشكل تعاوني لإنشاء مجموعة قوية من تصنيع الإلكترونيات وأشباه الموصلات في جميع أنحاء المنطقة. علاوة على ذلك، فإن وجود قطاع صناعي وسيارات قوي هو عامل رئيسي آخر يدفع نمو سوق مكبرات الصوت والمقارنات. ويرجع هذا أيضًا إلى النمو في نشر المكونات الإلكترونية في التصنيع الصناعي ومنتجات السيارات.
تحليل اللاعب الرئيسي:
يتكون تحليل سوق مكبر الصوت والمقارن من لاعبين مثل Analog Devices Inc و Broadcom Inc و STMicroelectronics و Microchip Technology Inc و NXP Semiconductors و On Semiconductor و Renesas Electronics Corporation و Skyworks Solutions Inc و Texas Instruments Inc و ABLIC Inc. ومن بين اللاعبين في سوق مكبر الصوت والمقارن، تعد Analog Devices Inc و Texas Instruments Inc من أكبر لاعبين نظرًا لمجموعة المنتجات المتنوعة المقدمة.
رؤى إقليمية حول سوق مكبرات الصوت وأجهزة المقارنة
لقد قام المحللون في Insight Partners بشرح الاتجاهات والعوامل الإقليمية المؤثرة على سوق مكبرات الصوت والمقارنات طوال فترة التوقعات بشكل شامل. يناقش هذا القسم أيضًا قطاعات سوق مكبرات الصوت والمقارنات والجغرافيا في جميع أنحاء أمريكا الشمالية وأوروبا ومنطقة آسيا والمحيط الهادئ والشرق الأوسط وأفريقيا وأمريكا الجنوبية والوسطى.
- احصل على البيانات الإقليمية المحددة لسوق مكبرات الصوت والمقارنات
نطاق تقرير سوق مكبرات الصوت والمقارنات
| سمة التقرير | تفاصيل |
|---|---|
| حجم السوق في عام 2023 | 12.41 مليار دولار أمريكي |
| حجم السوق بحلول عام 2030 | 19.03 مليار دولار أمريكي |
| معدل النمو السنوي المركب العالمي (2023 - 2030) | 6.3% |
| البيانات التاريخية | 2021-2022 |
| فترة التنبؤ | 2024-2030 |
| القطاعات المغطاة |
حسب النوع
|
| المناطق والدول المغطاة |
أمريكا الشمالية
|
| قادة السوق وملفات تعريف الشركات الرئيسية |
|
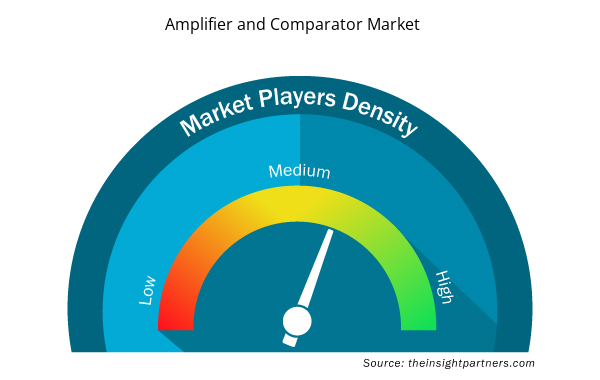
كثافة اللاعبين في السوق: فهم تأثيرها على ديناميكيات الأعمال
يشهد سوق مكبرات الصوت وأجهزة المقارنة نموًا سريعًا، مدفوعًا بالطلب المتزايد من المستخدم النهائي بسبب عوامل مثل تفضيلات المستهلكين المتطورة والتقدم التكنولوجي والوعي المتزايد بفوائد المنتج. ومع ارتفاع الطلب، تعمل الشركات على توسيع عروضها والابتكار لتلبية احتياجات المستهلكين والاستفادة من الاتجاهات الناشئة، مما يؤدي إلى زيادة نمو السوق.
تشير كثافة اللاعبين في السوق إلى توزيع الشركات أو المؤسسات العاملة في سوق أو صناعة معينة. وهي تشير إلى عدد المنافسين (اللاعبين في السوق) الموجودين في مساحة سوق معينة نسبة إلى حجمها أو قيمتها السوقية الإجمالية.
الشركات الرئيسية العاملة في سوق مكبرات الصوت والمقارنات هي:
- شركة انالوج ديفايسز
- شركة برودكوم
- شركة إس تي ميكروإلكترونيكس
- شركة مايكرو شيب للتكنولوجيا
- شركة NXP لأشباه الموصلات
إخلاء المسؤولية : الشركات المذكورة أعلاه ليست مرتبة بأي ترتيب معين.
- احصل على نظرة عامة على أهم اللاعبين الرئيسيين في سوق مكبرات الصوت والمقارنات
التطورات الأخيرة:
تتبنى الشركات العاملة في سوق مكبرات الصوت وأجهزة المقارنة بشكل كبير الاستراتيجيات العضوية وغير العضوية مثل عمليات الدمج والاستحواذ وإطلاق منتجات جديدة وما إلى ذلك. وفيما يلي بعض التطورات الرئيسية الأخيرة في سوق مكبرات الصوت وأجهزة المقارنة:
- في عام 2023، دخلت شركة Tata Consultancy Services وشركة Renesas في شراكة تخططان للعمل معًا من خلال افتتاح مركز ابتكار مشترك في بنغالورو وحيدر أباد لتطوير البرمجيات وتصميم الترددات الراديوية والتصميم الرقمي والإشارات المختلطة من أجل حلول أشباه الموصلات المتطورة من الجيل التالي والتي ستخدم احتياجات العديد من الصناعات.
- في عام 2023، كشفت شركة رينيساس عن ثلاث مجموعات جديدة من وحدات التحكم الدقيقة المصممة للتطبيقات التي تتضمن التحكم في المحركات. وتعد الأجهزة من عائلات RX وRA من بين أكثر من 35 منتجًا جديدًا أطلقتها رينيساس. وبفضل العديد من عائلات وحدات التحكم الدقيقة ووحدات المعالجة الدقيقة، والحلول التناظرية وحلول الطاقة، وأجهزة الاستشعار، ومعدات الاتصالات، ومكيفات الإشارة، وغيرها من الأجهزة، وسعت وحدات التحكم الدقيقة الجديدة نطاق التحكم في المحركات الرائد في السوق.
- في عام 2022، كشفت شركة Hypex Electronics عن NCx500 OEM، وهو الأول من عائلة NCOREx الجديدة من الوحدات النمطية، وأعلنت عن إصدار محدث من تقنية مكبر الصوت NCORE Class-D المعروفة.

نافين خبيرٌ متمرسٌ في أبحاث السوق والاستشارات، يتمتع بخبرةٍ تزيد عن 9 سنوات في مشاريع مُخصصة ومُشتركة واستشارية. يشغل حاليًا منصب نائب الرئيس المساعد، وقد نجح في إدارة أصحاب المصلحة عبر سلسلة قيمة المشاريع، وألّف أكثر من 100 تقرير بحثي وأكثر من 30 مهمة استشارية. يمتد نطاق عمله ليشمل مشاريع صناعية وحكومية، مساهمًا بشكل كبير في نجاح العملاء واتخاذ القرارات القائمة على البيانات.
نافين حاصلٌ على شهادة في هندسة الإلكترونيات والاتصالات من جامعة فرجينيا التقنية، كارناتاكا، وشهادة ماجستير في إدارة الأعمال في التسويق والعمليات من جامعة مانيبال. وهو عضوٌ نشطٌ في معهد مهندسي الكهرباء والإلكترونيات (IEEE) لمدة 9 سنوات، حيث شارك في مؤتمراتٍ وندواتٍ تقنية، وتطوّع على مستوى الأقسام والمناطق. قبل منصبه الحالي، عمل مستشارًا استراتيجيًا مساعدًا في IndustryARC، ومستشارًا للخوادم الصناعية في شركة هيوليت باكارد (HP Global).
- التحليل التاريخي (سنتان)، سنة الأساس، التوقعات (7 سنوات) مع معدل النمو السنوي المركب
- تحليل PEST و SWOT
- حجم السوق والقيمة / الحجم - عالمي، إقليمي، بلد
- الصناعة والمنافسة
- مجموعة بيانات إكسل
التقارير الحديثة
شهادات العملاء
تقرير سوق أنظمة SCADA من Insight Partners شامل، ويقدم رؤى قيّمة حول الاتجاهات الحالية والتوقعات المستقبلية. تميّز الفريق باحترافية عالية وسرعة في الاستجابة ودعم مستمر طوال الوقت. نحن راضون جدًا ونوصي بشدة بخدماتهم.
ران كيديم شريك, شركة ريالي تكنولوجيز المحدودةطلبتُ تقريرًا عن سوق برمجيات محدد، وأعدّه الفريق في غضون أيام قليلة. كانت المعلومات ذات صلة وثيقة وعرضها جيد. ثم طلبتُ بعض التعديلات والإضافات على التقرير. وكان الفريق متجاوبًا للغاية، وحصلتُ على التقرير النهائي في أقل من أسبوع.
جان هيرفيه جين رئيس مجلس الإدارة, فيوتشر أناليتيكاعملنا مع شركة "إنسايت بارتنرز" لإجراء دراسة سوقية وتوقعات مهمة. زودونا برؤى واضحة حول الفرص والمخاطر، مما ساعدنا في صياغة خططنا. كانت أبحاثهم سهلة الاستخدام ومبنية على بيانات دقيقة، مما ساعدنا على اتخاذ قرارات ذكية وواثقة. نوصي بهم بشدة.
بيوش ناجبال نائب الرئيس الأول, شعاع عالي عالميقدّمت شركة Insight Partners أبحاثًا سوقية ثاقبة ومنظمة جيدًا بخبرة واسعة في هذا المجال. تميّز فريقهم بالاحترافية وسرعة الاستجابة طوال الوقت. وسهّل موقعهم الإلكتروني سهل الاستخدام الوصول إلى تقارير القطاع. نوصي بهم بشدة لخدمات بحثية موثوقة وعالية الجودة.
يوكيهيكو أداتشي المدير التنفيذي, ديب بلو، ذ.م.م.هذه أول مرة أشتري فيها تقرير سوق من The Insight Partners. رغم أنني كنت مترددًا في البداية، إلا أنني زرت موقعهم الإلكتروني وشعرت براحة أكبر للمخاطرة وشراء تقرير السوق. أنا راضٍ تمامًا عن جودة التقرير وخدمة العملاء. كانت لديّ عدة أسئلة وتعليقات حول التقرير الأولي، ولكن بعد بضع محادثات عبر البريد الإلكتروني مع محللهم، أعتقد أن لديّ تقريرًا يمكنني استخدامه كمدخل لعملية التخطيط الاستراتيجي لدينا. شكرًا جزيلاً لكم على تخصيص وقتكم الإضافي وجعل هذه التجربة إيجابية. سأوصي بخدماتكم للآخرين بالتأكيد، وستكونون أول من ألجأ إليه عندما نحتاج إلى المزيد من بيانات السوق.
جون سوزوكي الرئيس والرئيس التنفيذي وعضو مجلس الإدارة, بي كيه تكنولوجيزأود أن أقدّر دعمكم واحترافيتكم في الاستجابة لطلبي للحصول على معلومات بشأن سوق التشخيص المخبري للأمراض المعدية في نيجيريا. كما أُقدّر صبركم وتوجيهكم، واستعدادكم لتقديم خصم، مما مكّننا في النهاية من إتمام الصفقة. أتطلع إلى التعامل مع "ذا إنسايت بارتنرز" مستقبلًا، كل ذلك بفضل الانطباع الذي تركتموه لديّ نتيجةً لهذا اللقاء الأول.
الدكتور تشيجيوك أونيا المدير الإداري, شركة باينكريست للرعاية الصحية المحدودةسبب الشراء
- اتخاذ قرارات مدروسة
- فهم ديناميكيات السوق
- تحليل المنافسة
- رؤى العملاء
- توقعات السوق
- تخفيف المخاطر
- التخطيط الاستراتيجي
- مبررات الاستثمار
- تحديد الأسواق الناشئة
- تحسين استراتيجيات التسويق
- تعزيز الكفاءة التشغيلية
- مواكبة التوجهات التنظيمية


 احصل على عينة مجانية ل - سوق مكبرات الصوت والمقارنات