نظرة عامة على سوق الأدوية ذات العلامات التجارية والنمو والاتجاهات والتحليل وتقرير البحث (2021-2031)
البيانات التاريخية : 2021-2022 | سنة الأساس : 2023 | فترة التنبؤ : 2024-2031حجم سوق الأدوية الجنيسة ذات العلامات التجارية وتوقعاته (2021-2031)، والحصة العالمية والإقليمية، والاتجاهات، وفرص النمو. يغطي التقرير: حسب التطبيق العلاجي (الأورام، أمراض القلب والأوعية الدموية، السكري، أمراض الأعصاب، أمراض الجهاز الهضمي، الأمراض الجلدية، المسكنات ومضادات الالتهاب، وغيرها)، وفئة الدواء (عوامل الألكلة، مضادات الأيض، الهرمونات، خافضات ضغط الدم، أدوية خفض الدهون، مضادات الاكتئاب، مضادات الذهان، مضادات الصرع، وغيرها)، ونوع التركيبة (فموية، حقنية، موضعية، وغيرها)، وقنوات التوزيع (المستشفيات، الصيدليات، الصيدليات الإلكترونية، ومتاجر الأدوية)، والموقع الجغرافي.
- تاريخ التقرير : Jan 2026
- رمز التقرير : TIPRE00005554
- الفئة : علوم الحياة
- الحالة : البيانات الصادرة
- تنسيقات التقارير المتاحة :


- عدد الصفحات : 150
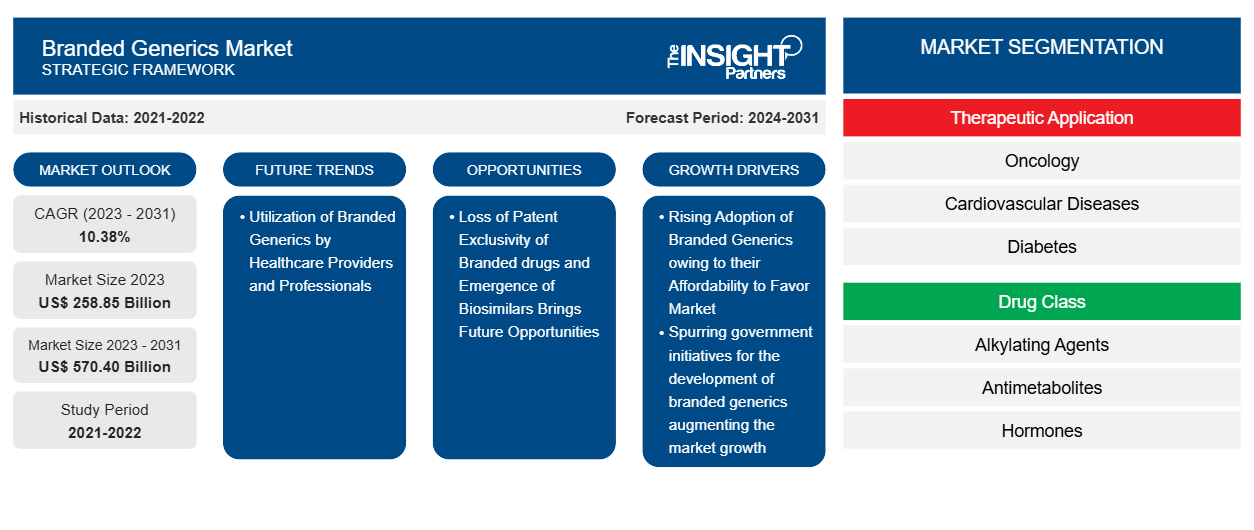
من المتوقع أن يصل حجم سوق الأدوية الجنيسة ذات العلامات التجارية إلى 570.40 مليار دولار أمريكي بحلول عام 2031 من 258.85 مليار دولار أمريكي في عام 2023. ومن المتوقع أن يسجل السوق معدل نمو سنوي مركب بنسبة 10.38٪ خلال الفترة 2023-2031. ومن المرجح أن يظل الاستخدام المتزايد للأدوية الجنيسة ذات العلامات التجارية من قبل مقدمي الرعاية الصحية والمهنيين اتجاهًا رئيسيًا في السوق.
تحليل سوق الأدوية الجنيسة ذات العلامات التجارية
تُباع الأدوية الجنيسة ذات العلامات التجارية تحت اسم تجاري دون براءة اختراع. ويمكن تطويرها من قبل شركة أدوية جنيسة أو الشركة المصنعة الأصلية وتسويقها بعد انتهاء صلاحية براءة اختراع الدواء الأصلي. يتم تقديم طلب مختصر للدواء الجديد (ANDA) للحصول على موافقة الجهات التنظيمية، ويجب أن يكون معادلاً علاجيًا للدواء الأصلي. ويفيد إطلاقها شركات العلامات التجارية حيث يمكن إنتاجها بخبرة موجودة، ولا تتطلب موافقة منفصلة من إدارة الغذاء والدواء ويمكن إطلاقها قبل انتهاء صلاحية براءة الاختراع دون عقبات قانونية. ومن المتوقع أن يؤدي انتشار الأدوية الجنيسة ذات العلامات التجارية المتزايد في السوق وتحفيز المبادرات الحكومية لتطوير الأدوية الجنيسة ذات العلامات التجارية إلى تعزيز نمو السوق.
نظرة عامة على سوق الأدوية الجنيسة ذات العلامات التجارية
لقد نفذت الشركات الكبرى استراتيجيات عضوية وغير عضوية مختلفة عززت نموها في السوق. على سبيل المثال، في أبريل 2021، أعلنت شركة WEX Pharmaceuticals Inc. أنه تم نشر تجربتين سريريتين على التيترودوتوكسين (TTX) في إصدار خاص من Toxins Journal. تم تضمين دراسة السلامة للتطبيقات القلبية الوعائية، "السلامة والتحمل والدوائية وتحليل تركيز التيترودوتوكسين- QTc: دراسة عشوائية لتصعيد الجرعة لدى البالغين الأصحاء"، في الإصدار الخاص من Toxins Journal. يتم دفع سوق آسيا والمحيط الهادئ من خلال الاستثمارات المتزايدة من اللاعبين الدوليين في الصين والهند، وتحسين الدعم الحكومي لتطوير الأدوية الجنيسة ذات العلامات التجارية في دول مثل الصين، والاستخدام المتزايد للأدوية الجنيسة ذات العلامات التجارية، وتطوير البنية التحتية للرعاية الصحية في المنطقة. لذلك، تتمتع المنطقة بإمكانات هائلة لنمو اللاعبين في سوق الأدوية الجنيسة ذات العلامات التجارية خلال فترة التنبؤ.
قم بتخصيص هذا التقرير ليناسب متطلباتك
ستحصل على تخصيص لأي تقرير - مجانًا - بما في ذلك أجزاء من هذا التقرير، أو تحليل على مستوى الدولة، وحزمة بيانات Excel، بالإضافة إلى الاستفادة من العروض والخصومات الرائعة للشركات الناشئة والجامعات
سوق الأدوية الجنيسة ذات العلامات التجارية: رؤى استراتيجية
- احصل على أهم اتجاهات السوق الرئيسية لهذا التقرير.ستتضمن هذه العينة المجانية تحليلاً للبيانات، بدءًا من اتجاهات السوق وحتى التقديرات والتوقعات.
محركات وفرص سوق الأدوية الجنيسة ذات العلامات التجارية
انتشار متزايد للأدوية الجنيسة ذات العلامات التجارية لصالح السوق
وفقًا للتقرير الصادر عن VOXEU، فإن الأدوية الجنيسة ذات العلامات التجارية هي بدائل أرخص من الأدوية الأخرى. زاد استخدام الأدوية الجنيسة ذات العلامات التجارية بين السكان بسبب وفورات التكلفة التي يوفرها نظام الرعاية الصحية والقدرة على الاستثمار في أدوية الغد الجديدة. وفقًا لتقرير نشرته الجمعية الدولية للأدوية الجنيسة والبيولوجية المماثلة (IGBA) في مايو 2021، تمثل الأدوية الجنيسة 60-80٪ من إجمالي مبيعات الأدوية في الأسواق العالمية الكبرى، مع مستويات أعلى في بعض البلدان (على سبيل المثال، أكثر من 90٪ في الولايات المتحدة، وأكثر من 80٪ في أستراليا، وأكثر من 90٪ في الهند، وحوالي 85٪ في الأردن). سمحت قدرة الصناعة على الحفاظ على أسعار فعالة من حيث التكلفة، جنبًا إلى جنب مع الحجم، للصناعة بتوسيع نطاق الوصول إلى العلاجات المختلفة في جميع أنحاء العالم بشكل كبير. على سبيل المثال، في غضون عام من إطلاق الأدوية المضادة للفيروسات الجنيسة لالتهاب الكبد الوبائي سي، زاد عدد الأشخاص الذين بدأوا العلاج بنسبة 50٪. ومن ثم، فإن توسيع نطاق انتشار الأدوية الجنيسة هو المحرك الرئيسي لحصة سوق الأدوية الجنيسة ذات العلامات التجارية العالمية.
الميل نحو الطب الشخصي يجلب فرصًا مستقبلية
الطب الدقيق يعمل على تعزيز الرعاية الصحية من خلال تخصيص العلاج للتركيبة الجينية الفريدة لكل شخص. يستخدم هذا النهج، المعروف أيضًا باسم الطب الفردي أو الطب الجينومي، علم الوراثة وعلم الجينوم لتوفير وقاية أفضل من الأمراض وتشخيصات أكثر دقة ووصفات أدوية أكثر أمانًا وعلاجات أكثر فعالية لمختلف الحالات الصحية. تقدم الأدوية الجنيسة ذات العلامات التجارية نفس التأثيرات الدوائية وهي فعالة من حيث التكلفة. هذه المزايا للأدوية الجنيسة ذات العلامات التجارية تجعلها خيارًا أفضل للعلاجات الشخصية. على سبيل المثال، وفقًا لمقال نُشر في الجمعية الأمريكية لعلم الأدوية السريرية والعلاج (ASCPT) في عام 2023، وجدت دراسة قارنت فعالية كلوبيدوجريل الجنيس ونظيره ذي العلامة التجارية لعلاج المرضى الذين يعانون من احتشاء عضلة القلب الحاد (AMI) أن الإصدار الجنيس كان بنفس فعالية الدواء ذي العلامة التجارية من حيث النتائج القلبية الوعائية والنزيف. وهذا يعني أن استخدام الأدوية العامة في العلاج الشخصي له تأثير إيجابي، ومن المرجح أن يجلب نهج الطب الشخصي فرصاً مربحة لسوق الأدوية العامة ذات العلامات التجارية.
تقرير تحليل تجزئة سوق الأدوية الجنيسة ذات العلامات التجارية
إن القطاعات الرئيسية التي ساهمت في اشتقاق تحليل سوق الأدوية الجنيسة ذات العلامات التجارية هي التطبيق العلاجي، وفئة الدواء، ونوع التركيبة، وقناة التوزيع.
- بناءً على التطبيق العلاجي، يتم تقسيم سوق الأدوية الجنيسة ذات العلامات التجارية إلى الأورام وأمراض القلب والأوعية الدموية وأمراض الجهاز الهضمي والسكري وأمراض الأعصاب وأمراض الجلد والمسكنات ومضادات الالتهابات وغيرها. احتلت شريحة الأدوية الأخرى أكبر حصة في السوق في عام 2023.
- بحسب فئة الدواء، يتم تقسيم السوق إلى مضادات الأيض، والهرمونات، ومضادات ارتفاع ضغط الدم، والعوامل المؤلكلة، وأدوية خفض الدهون، ومضادات الاكتئاب ، ومضادات الذهان، ومضادات الصرع، وغيرها. احتلت الفئة الأخرى الحصة الأكبر من السوق في عام 2023.
- بناءً على نوع التركيبة، يتم تقسيم سوق الأدوية الجنيسة ذات العلامات التجارية إلى أدوية فموية وحقنية وموضعية وغيرها. احتلت الأدوية الفموية الحصة الأكبر في السوق في عام 2023.
- من حيث قنوات التوزيع، يتم تصنيف السوق إلى المستشفيات والصيدليات بالتجزئة والصيدليات عبر الإنترنت ومتاجر الأدوية. احتل قطاع الصيدليات بالتجزئة حصة كبيرة من السوق في عام 2023.
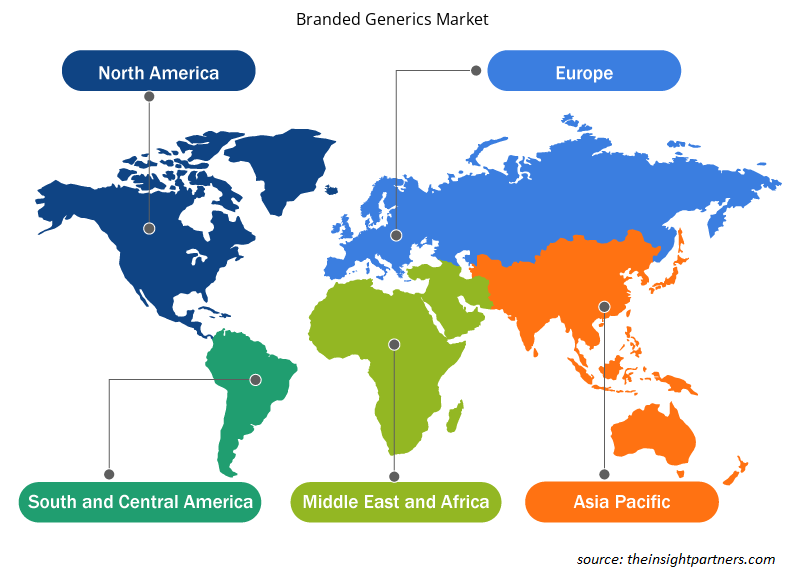
تحليل حصة سوق الأدوية الجنيسة ذات العلامات التجارية حسب المنطقة الجغرافية
ينقسم النطاق الجغرافي لتقرير سوق العلامات التجارية العامة بشكل أساسي إلى خمس مناطق: أمريكا الشمالية، ومنطقة آسيا والمحيط الهادئ، وأوروبا، والشرق الأوسط وأفريقيا، وأمريكا الجنوبية والوسطى.
سيطرت أمريكا الشمالية على السوق. وقد زادت فائدة الأدوية الجنيسة من حصة الإنفاق الصيدلاني. وفقًا لمقال نُشر في المكتبة الوطنية للطب (NLM)، يتم حاليًا صرف أكثر من 90٪ من وصفات الأدوية الصيدلانية في الولايات المتحدة كأدوية عامة. وفقًا للتقرير الذي نشرته إدارة الغذاء والدواء (FDA) في عام 2020، فإن الأدوية الجنيسة الأولى ضرورية للصحة العامة؛ حصل 72 دواءً عامًا أوليًا على موافقة إدارة الغذاء والدواء (FDA) في عام 2020. بالإضافة إلى ذلك، قدرت إدارة الغذاء والدواء أن الأدوية الجنيسة ذات العلامات التجارية ساعدت نظام الرعاية الصحية في توفير 2.2 تريليون دولار أمريكي في العقد الماضي. نظرًا للزيادة في استخدام الأدوية الجنيسة ذات العلامات التجارية في المنطقة، احتلت أمريكا الشمالية الحصة الأكبر في عام 2023. ومن المتوقع أن تسجل منطقة آسيا والمحيط الهادئ أعلى معدل نمو سنوي مركب في السنوات القادمة.
رؤى إقليمية حول سوق الأدوية الجنيسة ذات العلامات التجارية
لقد قام المحللون في Insight Partners بشرح الاتجاهات والعوامل الإقليمية المؤثرة على سوق الأدوية الجنيسة ذات العلامات التجارية طوال فترة التوقعات بشكل شامل. يناقش هذا القسم أيضًا قطاعات سوق الأدوية الجنيسة ذات العلامات التجارية والجغرافيا في جميع أنحاء أمريكا الشمالية وأوروبا ومنطقة آسيا والمحيط الهادئ والشرق الأوسط وأفريقيا وأمريكا الجنوبية والوسطى.
- احصل على البيانات الإقليمية المحددة لسوق الأدوية الجنيسة ذات العلامات التجارية
نطاق تقرير سوق الأدوية الجنيسة ذات العلامات التجارية
| سمة التقرير | تفاصيل |
|---|---|
| حجم السوق في عام 2023 | 258.85 مليار دولار أمريكي |
| حجم السوق بحلول عام 2031 | 570.40 مليار دولار أمريكي |
| معدل النمو السنوي المركب العالمي (2023 - 2031) | 10.38% |
| البيانات التاريخية | 2021-2022 |
| فترة التنبؤ | 2024-2031 |
| القطاعات المغطاة | حسب التطبيق العلاجي
|
| المناطق والدول المغطاة | أمريكا الشمالية
|
| قادة السوق وملفات تعريف الشركات الرئيسية |
|
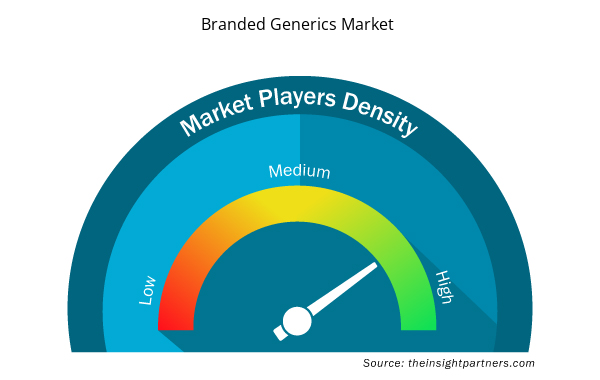
كثافة اللاعبين في سوق الأدوية الجنيسة ذات العلامات التجارية: فهم تأثيرها على ديناميكيات الأعمال
يشهد سوق الأدوية الجنيسة ذات العلامات التجارية نموًا سريعًا، مدفوعًا بالطلب المتزايد من المستخدم النهائي بسبب عوامل مثل تفضيلات المستهلكين المتطورة والتقدم التكنولوجي والوعي المتزايد بفوائد المنتج. ومع ارتفاع الطلب، تعمل الشركات على توسيع عروضها والابتكار لتلبية احتياجات المستهلكين والاستفادة من الاتجاهات الناشئة، مما يؤدي إلى زيادة نمو السوق.
تشير كثافة اللاعبين في السوق إلى توزيع الشركات أو المؤسسات العاملة في سوق أو صناعة معينة. وهي تشير إلى عدد المنافسين (اللاعبين في السوق) الموجودين في مساحة سوق معينة نسبة إلى حجمها أو قيمتها السوقية الإجمالية.
الشركات الرئيسية العاملة في سوق العلامات التجارية العامة هي:
- مغاير
- اسبن القابضة
- شركة ساندوز الدولية المحدودة
- شركة بار فارماسيوتيكالز المحدودة
- مختبرات الدكتور ريدي
- شركة أسترازينيكا المحدودة
إخلاء المسؤولية : الشركات المذكورة أعلاه ليست مرتبة بأي ترتيب معين.
- احصل على نظرة عامة على أهم اللاعبين الرئيسيين في سوق العلامات التجارية الجنيسة
أخبار سوق الأدوية الجنيسة ذات العلامات التجارية والتطورات الأخيرة
يتم تقييم سوق الأدوية الجنيسة ذات العلامات التجارية من خلال جمع البيانات النوعية والكمية بعد البحث الأولي والثانوي، والذي يتضمن المنشورات الأساسية للشركات وبيانات الجمعيات وقواعد البيانات. فيما يلي بعض التطورات في سوق الأدوية الجنيسة ذات العلامات التجارية:
- أطلقت شركة نوفارتيس ساندوز نسخة عامة من Combigan من شركة AbbVie، وهي قطرة عين مركبة تستخدم لعلاج ارتفاع ضغط العين في الولايات المتحدة. وباعتبارها الدواء المركب الأكثر انتشارًا لعلاج الجلوكوما، حققت الشركة المصنعة 373 مليون دولار من المبيعات في الولايات المتحدة في عام 2021. ومع الإطلاق، تعمل الشركة على توسيع عروض أدوية العيون الخاصة بها. (المصدر: Sandoz، موقع الشركة على الويب، أبريل 2022)
- وافقت شركة جلاكسو سميث كلاين على الاستحواذ على شركة سييرا أونكولوجي، وهي شركة أدوية حيوية في مراحلها الأخيرة مقرها كاليفورنيا تركز على العلاجات المستهدفة لعلاج أشكال نادرة من السرطان، مقابل 55 دولارًا أمريكيًا للسهم الواحد من الأسهم العادية نقدًا، وهو ما يمثل قيمة إجمالية تقريبية لحقوق الملكية تبلغ 1.9 مليار دولار أمريكي (1.5 مليار جنيه إسترليني). (المصدر: GlaxoSmithKline plc.، بيان صحفي، أبريل 2022)
تقرير سوق الأدوية الجنيسة ذات العلامات التجارية والتغطية والنتائج النهائية
يقدم تقرير "حجم سوق الأدوية الجنيسة ذات العلامات التجارية والتوقعات (2021-2031)" تفصيلاً شاملاً للسوق يغطي المجالات:
- حجم سوق الأدوية الجنيسة ذات العلامات التجارية والتوقعات على المستويات العالمية والإقليمية والوطنية لجميع قطاعات السوق الرئيسية التي يغطيها النطاق
- اتجاهات سوق الأدوية الجنيسة ذات العلامات التجارية، بالإضافة إلى ديناميكيات السوق مثل المحركات والقيود والفرص الرئيسية
- تحليل مفصل لقوى PEST/Porter الخمس وSWOT
- تحليل سوق العلامات التجارية الجنيسة يغطي اتجاهات السوق الرئيسية والإطار العالمي والإقليمي والجهات الفاعلة الرئيسية واللوائح والتطورات الأخيرة في السوق
- تحليل المشهد الصناعي والمنافسة الذي يغطي تركيز السوق، وتحليل خريطة الحرارة، واللاعبين البارزين، والتطورات الأخيرة لسوق العلامات التجارية الجنيسة
- ملفات تعريف الشركة التفصيلية

مرينال محللة أبحاث مخضرمة، تتمتع بخبرة تزيد عن 8 سنوات في مجال استخبارات واستشارات سوق علوم الحياة. بفضل عقليتها الاستراتيجية والتزامها الراسخ بالتميز، اكتسبت خبرة واسعة في التنبؤ بالصناعات الدوائية، وتقييم فرص السوق، وتطوير معايير الصناعة. يرتكز عملها على تقديم رؤى عملية تُمكّن العملاء من اتخاذ قرارات استراتيجية مدروسة.
تكمن قوة مرينال الأساسية في ترجمة مجموعات البيانات الكمية المعقدة إلى معلومات استخباراتية قيّمة. وتُعدّ براعتها التحليلية ركيزةً أساسيةً في صياغة استراتيجيات دخول السوق (GTM) واكتشاف فرص النمو في قطاعي الأدوية والأجهزة الطبية. وبصفتها مستشارةً موثوقةً، تُركز مرينال باستمرار على تبسيط إجراءات سير العمل وترسيخ أفضل الممارسات، مما يُعزز الابتكار والكفاءة التشغيلية لعملائها.
- التحليل التاريخي (سنتان)، سنة الأساس، التوقعات (7 سنوات) مع معدل النمو السنوي المركب
- تحليل PEST و SWOT
- حجم السوق والقيمة / الحجم - عالمي، إقليمي، بلد
- الصناعة والمنافسة
- مجموعة بيانات إكسل
التقارير الحديثة
شهادات العملاء
تقرير سوق أنظمة SCADA من Insight Partners شامل، ويقدم رؤى قيّمة حول الاتجاهات الحالية والتوقعات المستقبلية. تميّز الفريق باحترافية عالية وسرعة في الاستجابة ودعم مستمر طوال الوقت. نحن راضون جدًا ونوصي بشدة بخدماتهم.
ران كيديم شريك, شركة ريالي تكنولوجيز المحدودةطلبتُ تقريرًا عن سوق برمجيات محدد، وأعدّه الفريق في غضون أيام قليلة. كانت المعلومات ذات صلة وثيقة وعرضها جيد. ثم طلبتُ بعض التعديلات والإضافات على التقرير. وكان الفريق متجاوبًا للغاية، وحصلتُ على التقرير النهائي في أقل من أسبوع.
جان هيرفيه جين رئيس مجلس الإدارة, فيوتشر أناليتيكاعملنا مع شركة "إنسايت بارتنرز" لإجراء دراسة سوقية وتوقعات مهمة. زودونا برؤى واضحة حول الفرص والمخاطر، مما ساعدنا في صياغة خططنا. كانت أبحاثهم سهلة الاستخدام ومبنية على بيانات دقيقة، مما ساعدنا على اتخاذ قرارات ذكية وواثقة. نوصي بهم بشدة.
بيوش ناجبال نائب الرئيس الأول, شعاع عالي عالميقدّمت شركة Insight Partners أبحاثًا سوقية ثاقبة ومنظمة جيدًا بخبرة واسعة في هذا المجال. تميّز فريقهم بالاحترافية وسرعة الاستجابة طوال الوقت. وسهّل موقعهم الإلكتروني سهل الاستخدام الوصول إلى تقارير القطاع. نوصي بهم بشدة لخدمات بحثية موثوقة وعالية الجودة.
يوكيهيكو أداتشي المدير التنفيذي, ديب بلو، ذ.م.م.هذه أول مرة أشتري فيها تقرير سوق من The Insight Partners. رغم أنني كنت مترددًا في البداية، إلا أنني زرت موقعهم الإلكتروني وشعرت براحة أكبر للمخاطرة وشراء تقرير السوق. أنا راضٍ تمامًا عن جودة التقرير وخدمة العملاء. كانت لديّ عدة أسئلة وتعليقات حول التقرير الأولي، ولكن بعد بضع محادثات عبر البريد الإلكتروني مع محللهم، أعتقد أن لديّ تقريرًا يمكنني استخدامه كمدخل لعملية التخطيط الاستراتيجي لدينا. شكرًا جزيلاً لكم على تخصيص وقتكم الإضافي وجعل هذه التجربة إيجابية. سأوصي بخدماتكم للآخرين بالتأكيد، وستكونون أول من ألجأ إليه عندما نحتاج إلى المزيد من بيانات السوق.
جون سوزوكي الرئيس والرئيس التنفيذي وعضو مجلس الإدارة, بي كيه تكنولوجيزأود أن أقدّر دعمكم واحترافيتكم في الاستجابة لطلبي للحصول على معلومات بشأن سوق التشخيص المخبري للأمراض المعدية في نيجيريا. كما أُقدّر صبركم وتوجيهكم، واستعدادكم لتقديم خصم، مما مكّننا في النهاية من إتمام الصفقة. أتطلع إلى التعامل مع "ذا إنسايت بارتنرز" مستقبلًا، كل ذلك بفضل الانطباع الذي تركتموه لديّ نتيجةً لهذا اللقاء الأول.
الدكتور تشيجيوك أونيا المدير الإداري, شركة باينكريست للرعاية الصحية المحدودةسبب الشراء
- اتخاذ قرارات مدروسة
- فهم ديناميكيات السوق
- تحليل المنافسة
- رؤى العملاء
- توقعات السوق
- تخفيف المخاطر
- التخطيط الاستراتيجي
- مبررات الاستثمار
- تحديد الأسواق الناشئة
- تحسين استراتيجيات التسويق
- تعزيز الكفاءة التشغيلية
- مواكبة التوجهات التنظيمية


 احصل على عينة مجانية ل - سوق الأدوية الجنيسة ذات العلامات التجارية