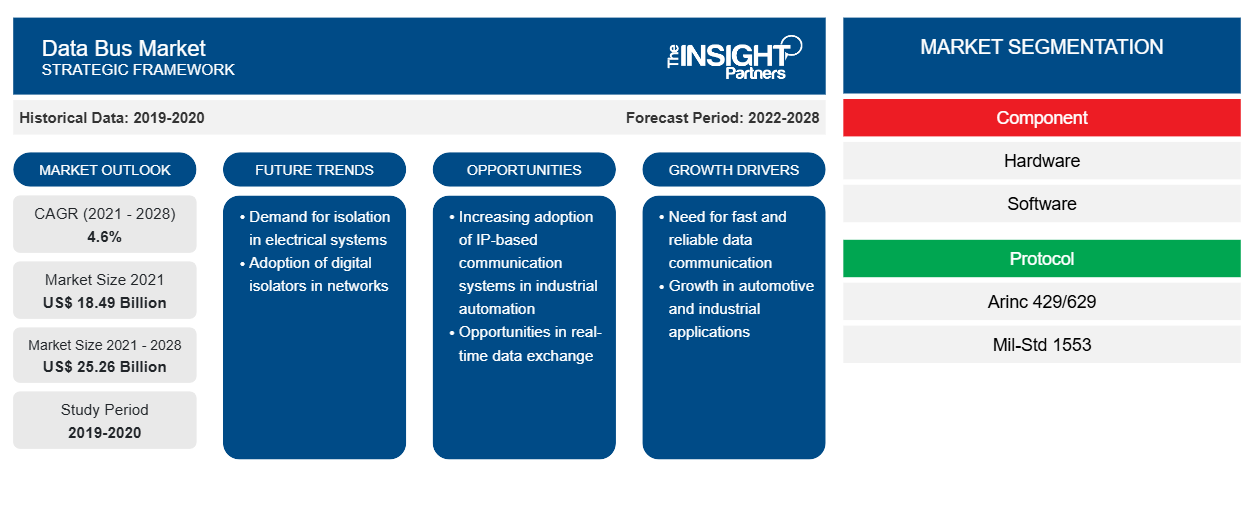
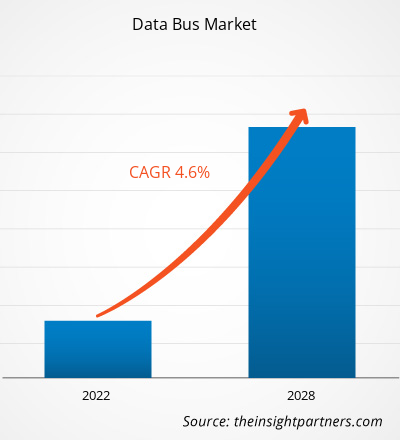
قُدِّر حجم سوق ناقل البيانات بـ 22.51 مليار دولار أمريكي في عام 2024، ومن المتوقع أن يصل إلى 32.01 مليار دولار أمريكي بحلول عام 2031؛ ومن المتوقع أن يسجل معدل نمو سنوي مركب قدره 5.3% خلال الفترة 2025-2031. ومن المرجح أن يُسفر تزايد اعتماد المعايير المفتوحة والمتوافقة عن اتجاه جديد في السوق.
تحليل سوق ناقل البيانات
تُحفّز عواملٌ مثل ارتفاع الطلب في تطبيقات الطيران والدفاع والتطورات التكنولوجية المستمرة سوقَ ناقل البيانات . ومن المتوقع أن ينمو السوق خلال فترة التوقعات بفضل تزايد اعتماد الأتمتة الصناعية والتطورات في مجال الاتصالات. ومن المتوقع أن يكون تزايد اعتماد المعايير المفتوحة والمتوافقة أحد الاتجاهات الرئيسية في السوق. ومع ذلك، قد تُعيق تكاليف التنفيذ المرتفعة نمو سوق ناقل البيانات.
نظرة عامة على سوق ناقل البيانات
ناقل البيانات هو نظام فرعي أساسي داخل الحاسوب أو النظام الرقمي، يُسهّل نقل البيانات بين مختلف المكونات، مثل وحدة المعالجة المركزية (CPU) والذاكرة والأجهزة الطرفية. يتكون من مجموعة من الأسلاك أو المسارات الكهربائية المتوازية التي تحمل معلومات ثنائية (بتات)، ويمكنها نقل البيانات في أي اتجاه حسب بنية النظام ومتطلباته. يُحدد عرض ناقل البيانات - المُقاس بالبتات (مثل 8 بت، 16 بت، 32 بت، 64 بت) - مقدار البيانات التي يمكن نقلها في وقت واحد، مما يؤثر بشكل مباشر على الأداء العام للنظام ومعدل نقل البيانات. يسمح الناقل الأوسع بنقل المزيد من البيانات دفعة واحدة، مما يُتيح معالجة وتواصل أسرع بين عناصر الأجهزة. بخلاف ناقلات العناوين التي تحمل معلومات حول وجهة البيانات، وناقلات التحكم التي تحمل إشارات لإدارة العمليات، فإن ناقل البيانات مسؤول بشكل خاص عن الحركة الفعلية للبيانات. في أنظمة الحوسبة الحديثة، تعمل ناقلة البيانات بالتنسيق مع حافلات العناوين والتحكم تحت إشراف ساعة النظام ومجموعة التعليمات لضمان اتصالات البيانات المتزامنة والدقيقة والفعالة عبر بنية الكمبيوتر.
ستحصل على تخصيص لأي تقرير - مجانًا - بما في ذلك أجزاء من هذا التقرير، أو تحليل على مستوى الدولة، وحزمة بيانات Excel، بالإضافة إلى الاستفادة من العروض والخصومات الرائعة للشركات الناشئة والجامعات
سوق ناقل البيانات:
- احصل على أهم اتجاهات السوق الرئيسية لهذا التقرير.ستتضمن هذه العينة المجانية تحليل البيانات، بدءًا من اتجاهات السوق وحتى التقديرات والتوقعات.
محركات وفرص سوق ناقل البيانات
ارتفاع الطلب على تطبيقات الطيران والدفاع
يشهد سوق ناقل البيانات نموًا متسارعًا، ويعزى ذلك بشكل رئيسي إلى تزايد الحاجة إلى اتصالات آمنة وعالية السرعة في البيئات الحرجة. ورغم أن بروتوكول MIL-STD-1553B يعود إلى عقود مضت، إلا أنه لا يزال يكتسب أهمية متزايدة بفضل أدائه الحتمي ومتانته المُثبتة، لا سيما في التطبيقات التي لا يُحتمل فيها الفشل. لا تُعدّ محولات ناقل البيانات 1553B مجرد مكونات تقليدية، بل هي مُمكّنات للاتصالات الرقمية الحديثة في البيئات التي تُعدّ فيها التكرارية، ومقاومة التداخل الكهرومغناطيسي، وعزل الأعطال أمرًا بالغ الأهمية. ويدعم اعتمادها المستمر اتجاهات قابلية التوسع والنمذجة في أنظمة الطيران والدفاع، حيث أصبحت البنى المفتوحة والقدرات المُعرّفة بالبرمجيات هي القاعدة. وبالتالي، فإن الطلب المتزايد على ناقل البيانات في تطبيقات الطيران والدفاع يُعزز نمو سوق ناقل البيانات.
التقدم التكنولوجي المستمر
يُعدّ التقدم التكنولوجي المستمر، الذي يُركّز على حل الاختناقات في أنظمة الحوسبة عالية الأداء ونقل البيانات القائمة على الذكاء الاصطناعي، أحد العوامل الرئيسية الدافعة لسوق ناقلات البيانات العالمية. ومن الأمثلة الحديثة البارزة على ذلك شركة NEO Semiconductor، التي كشفت في 5 أغسطس 2024 عن تقنية شريحة 3D X-AI، وهي ابتكار رائد صُمّم لتخفيف ازدحام ناقل البيانات في أحمال عمل الذكاء الاصطناعي من خلال دمج معالجة الذكاء الاصطناعي مباشرةً في ذاكرة الوصول العشوائي الديناميكية ثلاثية الأبعاد. لا يقتصر هذا الابتكار على ترقية الأجهزة فحسب، بل يُمثّل نقلة نوعية في إدارة البيانات بين ذاكرة النطاق الترددي العالي (HBM) ووحدات معالجة الرسومات (GPUs) خلال المهام التي تتطلب كميات كبيرة من الحوسبة، كتلك التي تُنفّذ في بيئات الذكاء الاصطناعي التوليدي والتعلم الآلي .
مع تزايد سرعات المعالجة وحجم البيانات في قطاعات مثل الذكاء الاصطناعي، والأنظمة المستقلة، ومراكز البيانات، والحوسبة المتقدمة، أصبحت الحاجة إلى أنظمة ناقل بيانات أكثر كفاءة أكثر إلحاحًا من أي وقت مضى. يُعزز حل NEO، إلى جانب تخفيفه بعض الضغط على ناقلات البيانات التقليدية، تحوّل السوق نحو هياكل الناقلات الهجينة، وأنظمة الذاكرة الذكية، والمعالجة المدمجة - وهي اتجاهات تُغذّي الابتكار في جميع المجالات. كما يُحفّز هذا الحل المزيد من البحث والتطوير في تقنيات ناقل البيانات التكيفية التي يُمكنها أن تُكمّل أو تتكامل مع هياكل ذاكرة الذكاء الاصطناعي المدمجة.
تقرير تحليل تجزئة سوق ناقل البيانات
القطاعات الرئيسية التي ساهمت في اشتقاق تحليل سوق ناقل البيانات هي المكون والنوع والتطبيق.
- بناءً على المكونات، ينقسم السوق إلى أجهزة وبرامج. وقد استحوذ قطاع الأجهزة على حصة سوقية أكبر لناقلات البيانات في عام ٢٠٢٤.
- من حيث النوع، يُقسّم السوق إلى ARINC 429/629 وMIL-STD-1553 وغيرها. وقد استحوذت فئة MIL-STD-1553 على أكبر حصة سوقية لناقلات البيانات في عام 2024.
- بناءً على التطبيق، يُقسّم السوق إلى قطاعات بحرية، وسيارات، وطيران تجاري، وطيران عسكري. وقد استحوذ قطاع الطيران العسكري على الحصة الأكبر من سوق ناقل البيانات في عام ٢٠٢٤.
تحليل حصة سوق ناقل البيانات حسب المنطقة الجغرافية
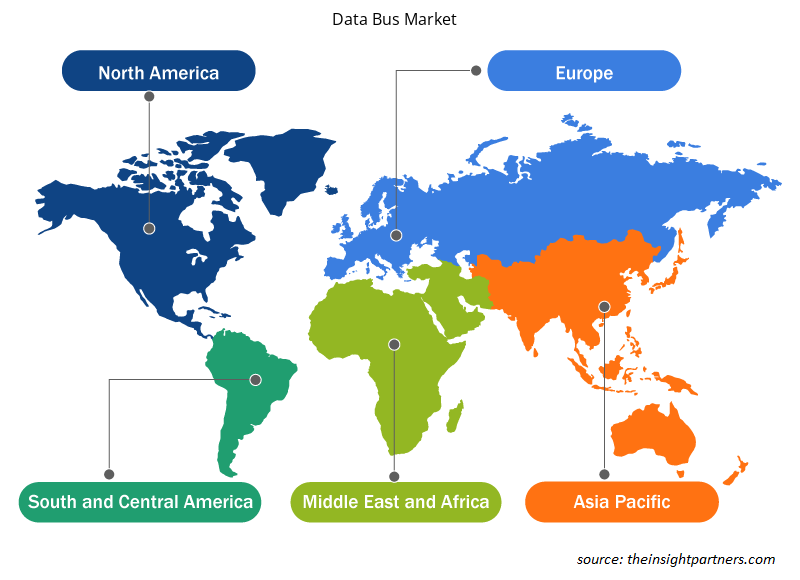
- يُقسّم سوق ناقل البيانات إلى خمس مناطق رئيسية: أمريكا الشمالية، وأوروبا، وآسيا والمحيط الهادئ، والشرق الأوسط وأفريقيا، وأمريكا الجنوبية والوسطى. وقد هيمنت أمريكا الشمالية على السوق في عام 2024. وتُعدّ أوروبا ثاني أكبر مساهم في سوق ناقل البيانات العالمي، تليها آسيا والمحيط الهادئ.
- تحتل أمريكا الشمالية مكانة مهيمنة في سوق ناقل البيانات العالمي، مدفوعةً إلى حد كبير بالولايات المتحدة، التي تُعد موطنًا لأكبر صناعة دفاعية وجوية في العالم. إن وجود لاعبين رئيسيين مثل لوكهيد مارتن ورايثيون تكنولوجيز ونورثروب غرومان وبوينغ يُغذي الاستثمار المستدام في أنظمة ناقل البيانات المتطورة، لا سيما في مجال الطيران العسكري والمركبات الجوية بدون طيار واستكشاف الفضاء. تفرض وزارة الدفاع الأمريكية معايير صارمة مثل MIL-STD-1553 لاتصالات بيانات آمنة ومتسامحة مع الأخطاء في التطبيقات المهمة. كما تُعد أمريكا الشمالية مركزًا للابتكار في هياكل ناقل البيانات القائمة على الإيثرنت والهجينة، بدعم من مؤسسات مثل ناسا وداربا وإدارة الطيران الفيدرالية (FAA). بالإضافة إلى ذلك، أدى نمو سوق المركبات المتصلة ودمج أنظمة مساعدة السائق المتقدمة (ADAS) في الولايات المتحدة وكندا إلى زيادة اعتماد ناقلات البيانات مثل CAN وFlexRay وAutomotive Ethernet. إن نشاط البحث والتطوير القوي، والنظام البيئي الناضج لشركات الدفاع، والأطر التنظيمية القوية تعمل مجتمعة على وضع أمريكا الشمالية كقائد عالمي في كل من التطوير التكنولوجي والتبني التجاري لأنظمة حافلات البيانات المتقدمة.
- تبرز منطقة آسيا والمحيط الهادئ كسوق سريعة النمو وذات أهمية استراتيجية لتقنيات ناقل البيانات، مدفوعةً بالتصنيع السريع، وارتفاع ميزانيات الدفاع، وتوسع صناعتي الطيران والفضاء والسيارات. وتأتي الصين والهند واليابان وكوريا الجنوبية في طليعة هذه الأسواق، مع تنامي قدرات التصنيع المحلية والتركيز المتزايد على تحديث الدفاع. على سبيل المثال، أسفرت مبادرات الهند في إطار مبادرة "صنع في الهند" ومبادرة "أتمانيربهار بهارات" عن برامج محلية تشمل تطوير طائرات دفاعية ومنصات بحرية وأقمار صناعية، مما أدى إلى ارتفاع الطلب على أنظمة ناقل البيانات المتوافقة مع معايير MIL-STD-1553 وARINC. وتعمل منظمات مثل منظمة البحث والتطوير الدفاعي (DRDO) ومنظمة أبحاث الفضاء الهندية (ISRO) ومنظمة HAL بشكل وثيق مع شركاء التكنولوجيا المحليين والدوليين لتعزيز بنيتها التحتية لاتصالات البيانات. في الصين، أدى النمو السريع لقطاع الطيران التجاري والمنصات العسكرية عالية التقنية إلى زيادة الإنتاج المحلي وتكامل هياكل ناقل البيانات المتقدمة.
رؤى إقليمية حول سوق ناقل البيانات
قام محللو إنسايت بارتنرز بشرح شامل للاتجاهات الإقليمية والعوامل المؤثرة في سوق ناقل البيانات خلال فترة التوقعات. ويناقش هذا القسم أيضًا قطاعات سوق ناقل البيانات ونطاقه الجغرافي في أمريكا الشمالية، وأوروبا، وآسيا والمحيط الهادئ، والشرق الأوسط وأفريقيا، وأمريكا الجنوبية والوسطى.
- احصل على بيانات إقليمية محددة لسوق ناقل البيانات
نطاق تقرير سوق ناقل البيانات
| سمة التقرير | تفاصيل |
|---|---|
| حجم السوق في عام 2024 | 22.51 مليار دولار أمريكي |
| حجم السوق بحلول عام 2031 | 32.01 مليار دولار أمريكي |
| معدل النمو السنوي المركب العالمي (2025 - 2031) | 5.3% |
| البيانات التاريخية | 2021-2023 |
| فترة التنبؤ | 2025-2031 |
| القطاعات المغطاة | حسب المكون
|
| المناطق والدول المغطاة | أمريكا الشمالية
|
| قادة السوق وملفات تعريف الشركات الرئيسية |
|
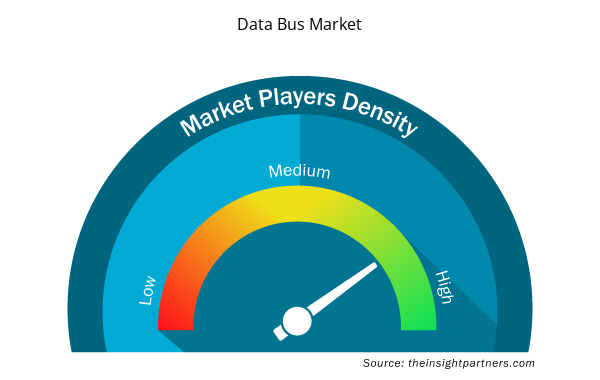
كثافة اللاعبين في سوق ناقل البيانات: فهم تأثيرها على ديناميكيات الأعمال
يشهد سوق ناقل البيانات نموًا سريعًا، مدفوعًا بتزايد طلب المستخدم النهائي نتيجةً لعوامل مثل تطور تفضيلات المستهلكين، والتقدم التكنولوجي، وزيادة الوعي بمزايا المنتج. ومع تزايد الطلب، تعمل الشركات على توسيع عروضها، والابتكار لتلبية احتياجات المستهلكين، والاستفادة من الاتجاهات الناشئة، مما يعزز نمو السوق.
تشير كثافة اللاعبين في السوق إلى توزيع الشركات العاملة في سوق أو قطاع معين. وتشير إلى عدد المنافسين (اللاعبين في السوق) الموجودين في سوق معين نسبةً إلى حجمه أو قيمته السوقية الإجمالية.
الشركات الرئيسية العاملة في سوق ناقل البيانات هي:
- شركة أسترونيكس
- كولينز للطيران
- شركة تي إي للاتصالات المحدودة
- شركة أمفينول المحدودة
- شركة داتا ديفايس
- شركة إكسكاليبور سيستمز
إخلاء المسؤولية : الشركات المذكورة أعلاه ليست مرتبة بأي ترتيب معين.
- احصل على نظرة عامة على أهم اللاعبين الرئيسيين في سوق ناقل البيانات
أخبار سوق ناقل البيانات والتطورات الأخيرة
يُقيّم سوق ناقل البيانات بجمع بيانات نوعية وكمية بعد البحث الأولي والثانوي، والتي تشمل منشورات الشركات المهمة، وبيانات الجمعيات، وقواعد البيانات. فيما يلي بعض التطورات الرئيسية في سوق ناقل البيانات:
- تعاونت شركتا Keysight وSPHEREA لتزويد العملاء بقدرات اختبار مُحسّنة في قطاعي الطيران والدفاع. ويستفيد هذا التعاون الجديد من خبرة Keysight في اختبارات وأنظمة قياس الإلكترونيات عالية الأداء، وقدرات SPHEREA في التصميم والتكامل، لتزويد العملاء بحلول محلية مبنية على تقنيات موثوقة. (المصدر: Keysight، بيان صحفي، مايو 2025)
- كشفت إيمرسون عن أحدث إضافاتها إلى مجموعة حلول جمع البيانات (DAQ)، مقدمةً هيكل إيثرنت NI cDAQ-9187 وcDAQ-9183 ووحدة الإدخال NI 9204. إلى جانب مستودع GitHub لمكونات برنامج NI FlexLogger DAQ الإضافية، توفر هذه الحلول الجديدة خيارات فعّالة من حيث التكلفة لنشر أنظمة اختبار وقياس عالية الأداء عبر إيثرنت.
(المصدر: إيمرسون، بيان صحفي، فبراير 2025)
تغطية تقرير سوق ناقل البيانات والمنتجات النهائية
يوفر "حجم سوق ناقل البيانات والتوقعات (2021-2031)" تحليلًا مفصلاً للسوق يغطي المجالات المذكورة أدناه:
- حجم سوق ناقل البيانات وتوقعاته على المستويات العالمية والإقليمية والوطنية لجميع قطاعات السوق الرئيسية التي يغطيها النطاق
- اتجاهات سوق ناقل البيانات، بالإضافة إلى ديناميكيات السوق مثل العوامل المحركة، والقيود، والفرص الرئيسية
- تحليل مفصل لـ PEST و SWOT
- تحليل سوق ناقل البيانات الذي يغطي اتجاهات السوق الرئيسية والإطار العالمي والإقليمي والجهات الفاعلة الرئيسية واللوائح والتطورات الأخيرة في السوق
- تحليل المشهد الصناعي والمنافسة الذي يغطي تركيز السوق، وتحليل خريطة الحرارة، واللاعبين البارزين، والتطورات الأخيرة لسوق ناقل البيانات
- ملفات تعريف الشركة التفصيلية
- التحليل التاريخي (سنتان)، السنة الأساسية، التوقعات (7 سنوات) مع معدل النمو السنوي المركب
- تحليل PEST و SWOT
- حجم السوق والقيمة / الحجم - عالميًا وإقليميًا وقطريًا
- الصناعة والمنافسة
- مجموعة بيانات Excel


Report Coverage
Revenue forecast, Company Analysis, Industry landscape, Growth factors, and Trends

Segment Covered
This text is related
to segments covered.

Regional Scope
North America, Europe, Asia Pacific, Middle East & Africa, South & Central America

Country Scope
This text is related
to country scope.
الأسئلة الشائعة
Rise in demand in aerospace and defense applications and continuous technological advancements are driving the market growth.
Increased adoption of open and interoperable standards is one of the key trends in the market.
TE Connectivity, Amphenol Corporation, Data Device Corporation, Curtiss-Wright Defense Solutions, and Astronics Corporation are major players in the market.
The market is expected to reach a value of US$ 32.07 billion by 2031.
The market is anticipated to expand at a CAGR of 5.3% during 2025-2031.
The List of Companies - Data Bus Market
- Astronics Corporation
- Collins Aerospace
- TE Connectivity Ltd
- Amphenol Ltd.
- Data Device Corporation
- Excalibur Systems Inc.
- Curtiss-Wright Corporation
- Keysight Technologies Inc
- National Instruments Corp
- Holt Integrated Circuits
The Insight Partners performs research in 4 major stages: Data Collection & Secondary Research, Primary Research, Data Analysis and Data Triangulation & Final Review.
- Data Collection and Secondary Research:
As a market research and consulting firm operating from a decade, we have published and advised several client across the globe. First step for any study will start with an assessment of currently available data and insights from existing reports. Further, historical and current market information is collected from Investor Presentations, Annual Reports, SEC Filings, etc., and other information related to company’s performance and market positioning are gathered from Paid Databases (Factiva, Hoovers, and Reuters) and various other publications available in public domain.
Several associations trade associates, technical forums, institutes, societies and organization are accessed to gain technical as well as market related insights through their publications such as research papers, blogs and press releases related to the studies are referred to get cues about the market. Further, white papers, journals, magazines, and other news articles published in last 3 years are scrutinized and analyzed to understand the current market trends.
- Primary Research:
The primarily interview analysis comprise of data obtained from industry participants interview and answers to survey questions gathered by in-house primary team.
For primary research, interviews are conducted with industry experts/CEOs/Marketing Managers/VPs/Subject Matter Experts from both demand and supply side to get a 360-degree view of the market. The primary team conducts several interviews based on the complexity of the markets to understand the various market trends and dynamics which makes research more credible and precise.
A typical research interview fulfils the following functions:
- Provides first-hand information on the market size, market trends, growth trends, competitive landscape, and outlook
- Validates and strengthens in-house secondary research findings
- Develops the analysis team’s expertise and market understanding
Primary research involves email interactions and telephone interviews for each market, category, segment, and sub-segment across geographies. The participants who typically take part in such a process include, but are not limited to:
- Industry participants: VPs, business development managers, market intelligence managers and national sales managers
- Outside experts: Valuation experts, research analysts and key opinion leaders specializing in the electronics and semiconductor industry.
Below is the breakup of our primary respondents by company, designation, and region:

Once we receive the confirmation from primary research sources or primary respondents, we finalize the base year market estimation and forecast the data as per the macroeconomic and microeconomic factors assessed during data collection.
- Data Analysis:
Once data is validated through both secondary as well as primary respondents, we finalize the market estimations by hypothesis formulation and factor analysis at regional and country level.
- Macro-Economic Factor Analysis:
We analyse macroeconomic indicators such the gross domestic product (GDP), increase in the demand for goods and services across industries, technological advancement, regional economic growth, governmental policies, the influence of COVID-19, PEST analysis, and other aspects. This analysis aids in setting benchmarks for various nations/regions and approximating market splits. Additionally, the general trend of the aforementioned components aid in determining the market's development possibilities.
- Country Level Data:
Various factors that are especially aligned to the country are taken into account to determine the market size for a certain area and country, including the presence of vendors, such as headquarters and offices, the country's GDP, demand patterns, and industry growth. To comprehend the market dynamics for the nation, a number of growth variables, inhibitors, application areas, and current market trends are researched. The aforementioned elements aid in determining the country's overall market's growth potential.
- Company Profile:
The “Table of Contents” is formulated by listing and analyzing more than 25 - 30 companies operating in the market ecosystem across geographies. However, we profile only 10 companies as a standard practice in our syndicate reports. These 10 companies comprise leading, emerging, and regional players. Nonetheless, our analysis is not restricted to the 10 listed companies, we also analyze other companies present in the market to develop a holistic view and understand the prevailing trends. The “Company Profiles” section in the report covers key facts, business description, products & services, financial information, SWOT analysis, and key developments. The financial information presented is extracted from the annual reports and official documents of the publicly listed companies. Upon collecting the information for the sections of respective companies, we verify them via various primary sources and then compile the data in respective company profiles. The company level information helps us in deriving the base number as well as in forecasting the market size.
- Developing Base Number:
Aggregation of sales statistics (2020-2022) and macro-economic factor, and other secondary and primary research insights are utilized to arrive at base number and related market shares for 2022. The data gaps are identified in this step and relevant market data is analyzed, collected from paid primary interviews or databases. On finalizing the base year market size, forecasts are developed on the basis of macro-economic, industry and market growth factors and company level analysis.
- Data Triangulation and Final Review:
The market findings and base year market size calculations are validated from supply as well as demand side. Demand side validations are based on macro-economic factor analysis and benchmarks for respective regions and countries. In case of supply side validations, revenues of major companies are estimated (in case not available) based on industry benchmark, approximate number of employees, product portfolio, and primary interviews revenues are gathered. Further revenue from target product/service segment is assessed to avoid overshooting of market statistics. In case of heavy deviations between supply and demand side values, all thes steps are repeated to achieve synchronization.
We follow an iterative model, wherein we share our research findings with Subject Matter Experts (SME’s) and Key Opinion Leaders (KOLs) until consensus view of the market is not formulated – this model negates any drastic deviation in the opinions of experts. Only validated and universally acceptable research findings are quoted in our reports.
We have important check points that we use to validate our research findings – which we call – data triangulation, where we validate the information, we generate from secondary sources with primary interviews and then we re-validate with our internal data bases and Subject matter experts. This comprehensive model enables us to deliver high quality, reliable data in shortest possible time.
 احصل على عينة مجانية لهذا التقرير