تحليل سوق المحطات الفرعية لمراكز البيانات والتنبؤ بها حسب الحجم والمشاركة والنمو والاتجاهات 2031
البيانات التاريخية : 2021-2022 | سنة الأساس : 2023 | فترة التنبؤ : 2024-2031حجم سوق محطات مراكز البيانات الفرعية وتوقعاته (2021-2031)، والحصة العالمية والإقليمية، والاتجاهات، وفرص النمو. يغطي التقرير: حسب المكونات (المحولات، ومفاتيح التوزيع، والمرحلات، وغيرها)، ونوع الجهد (33 كيلو فولت - 110 كيلو فولت، 111 كيلو فولت - 220 كيلو فولت، 221 كيلو فولت - 500 كيلو فولت، وفوق 500 كيلو فولت)، والموقع الجغرافي.
- تاريخ التقرير : Mar 2026
- رمز التقرير : TIPRE00025991
- الفئة : التكنولوجيا والإعلام والاتصالات
- الحالة : البيانات الصادرة
- تنسيقات التقارير المتاحة :


- عدد الصفحات : 150
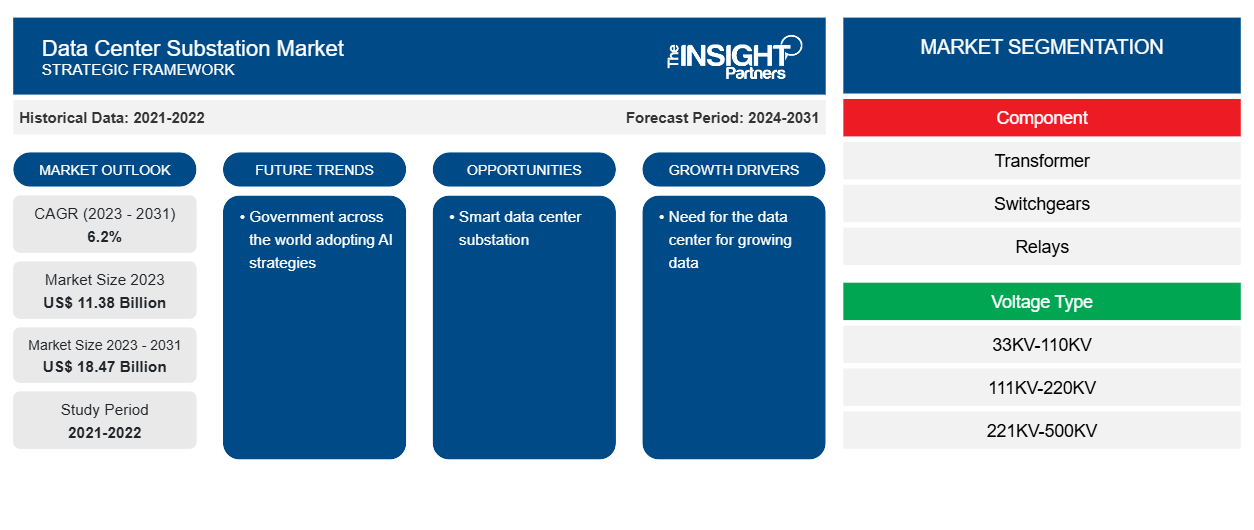
من المتوقع أن يصل حجم سوق محطات مراكز البيانات إلى 18.47 مليار دولار أمريكي بحلول عام 2031 من 11.38 مليار دولار أمريكي في عام 2023. ومن المتوقع أن يسجل السوق معدل نمو سنوي مركب بنسبة 6.2٪ خلال الفترة 2023-2031. ومن المرجح أن يظل النمو في مراكز البيانات في جميع أنحاء العالم والحاجة إلى إمداد طاقة فعال وسلس وموثوق به لمركز البيانات من الاتجاهات الرئيسية في السوق.
تحليل سوق محطات مركز البيانات
إن العدد المتزايد من مراكز البيانات في جميع أنحاء العالم يدفع الحاجة إلى إمدادات طاقة فعالة، مما يعزز سوق محطات فرعية لمراكز البيانات. إن الشركات التي توسع أعمالها في جميع أنحاء العالم تطلق مراكز بياناتها أو تتجه إلى خدمات التواجد المشترك مما يدفع الحاجة إلى مراكز البيانات. إن البيانات المتزايدة تولد الحاجة إلى التخزين حيث يمكن معالجتها وتحليلها، مما يعزز الحاجة إلى مراكز البيانات. وبالتالي، فإن الحاجة المتزايدة إلى مركز البيانات تغذي سوق محطات فرعية لمراكز البيانات لإمدادات الطاقة الفعالة أثناء بناء مركز البيانات وتشغيله.
نظرة عامة على سوق محطات مراكز البيانات
محطة فرعية لمركز البيانات هي منشأة تلعب دورًا حيويًا في شبكة الطاقة التي تنقل الطاقة من الإنتاج إلى الاستهلاك. تساعد المحطة الفرعية في حماية المعدات من الأعطال أو الدوائر القصيرة وتجنب تلف خطوط الطاقة والمعدات. يتصل مزودو مراكز البيانات بمزود المرافق لإنشاء محطة فرعية في الحرم الجامعي الخاص بهم أو لبناء واحدة وتسليمها إلى مركز البيانات.
قم بتخصيص هذا التقرير ليناسب متطلباتك
ستحصل على تخصيص لأي تقرير - مجانًا - بما في ذلك أجزاء من هذا التقرير، أو تحليل على مستوى الدولة، وحزمة بيانات Excel، بالإضافة إلى الاستفادة من العروض والخصومات الرائعة للشركات الناشئة والجامعات
سوق محطات مراكز البيانات: رؤى استراتيجية
-
احصل على أهم اتجاهات السوق الرئيسية لهذا التقرير.ستتضمن هذه العينة المجانية تحليلاً للبيانات، بدءًا من اتجاهات السوق وحتى التقديرات والتوقعات.
محركات وفرص سوق محطات مراكز البيانات
الحاجة إلى مركز بيانات لتنمية البيانات لصالح السوق
يتم توليد البيانات بوتيرة أسرع. أدى ارتفاع معدل انتشار الإنترنت إلى تغذية توليد البيانات. تعتمد الشركات في جميع أنحاء العالم على التخطيط الاستراتيجي القائم على البيانات لتحقيق نمو تجاري فعال. بالإضافة إلى ذلك، يولد إنترنت الأشياء عددًا هائلاً من البيانات التي تحتاج إلى المعالجة والتخزين والتحليل في الوقت الفعلي. من المتوقع أن يؤدي نشر 5G إلى زيادة حجم حركة البيانات بشكل كبير، حيث توفر 5G بيانات أعلى بكثير وزمن انتقال أقل من 4G والشبكات الأخرى. وفقًا لتقارير Cisco، ستدعم 5G أكثر من 10٪ من اتصالات الهاتف المحمول في العالم بحلول عام 2023، بمتوسط سرعة 575 ميجابت في الثانية. هذا أسرع بـ 13 مرة من متوسط اتصال الهاتف المحمول اليوم. نظرًا لزيادة حركة البيانات، ستسعى الشركات والمؤسسات إلى موقع لتخزين ومعالجة وتوزيع بياناتها بكفاءة وموثوقية أكبر، مما يساهم في الحاجة إلى مزودي مراكز البيانات. وبالتالي، لإدارة شبكة الطاقة لمركز البيانات بشكل فعال، يتزايد الطلب على محطات فرعية لمركز البيانات.fuelled the generation of data. Businesses all over the world are relying on data-driven strategic planning for efficient business growth. In addition, IoT generates a huge number of data that needs to be processed, stored and analyzed in real-time. The deployment of 5G is expected to significantly increase the volume of data traffic, as 5G offers much higher data and lower latency than the 4G and other networks. According to the Cisco reports, 5G will support more than 10% of the world's mobile connections by 2023, with an average speed of 575 Mbps. That's 13 times faster than the average mobile connection today. Due to increased data traffic, businesses and enterprises will seek a location to store, process and distribute their data more efficiently and reliably, contributing to the need for data center providers. Thus, to manage the power grid of a data center effectively, the demand for data center substations is growing.
محطة فرعية لمركز البيانات الذكي
تراقب الحكومات في مختلف البلدان عن كثب بناء مراكز البيانات وضمان الاستدامة أثناء تطوير مراكز البيانات والعمل عليها. تركز الحكومة على تقليل بصمتها الكربونية ومعالجة المخاوف الناشئة عن المرافق كثيفة الطاقة. لذلك، يركز اللاعبون في السوق على بناء حلول محطات فرعية ذكية لمراكز البيانات للترويج لصناعة مراكز البيانات بشكل فعال. على سبيل المثال، توفر ABB محطات فرعية ذكية لمراكز البيانات لتقليل البصمة الكربونية والعقارية لهذه المرافق. من خلال استخدام المكونات المعيارية الذكية، تمكنت الشركة من تقليل كمية كابلات التحكم النحاسية بأكثر من 50٪. وبالتالي، فإن بناء مثل هذه الحلول الذكية من شأنه أن يعزز صناعة مراكز البيانات ويولد الطلب على سوق محطات فرعية فعالة لمراكز البيانات.
تقرير تحليل تجزئة سوق محطات مركز البيانات
إن القطاعات الرئيسية التي ساهمت في اشتقاق تحليل سوق محطات مراكز البيانات هي نوع المكون والجهد.
- بناءً على المكون، يتم تقسيم سوق محطات مراكز البيانات إلى المحولات والمفاتيح والمرحلات وغيرها. احتل قطاع المفاتيح الحصة الأكبر من السوق في عام 2023.
- بحسب نوع الجهد، يتم تقسيم السوق إلى 33 كيلو فولت - 110 كيلو فولت، 111 كيلو فولت - 220 كيلو فولت، 221 كيلو فولت - 500 كيلو فولت، وفوق 500 كيلو فولت. ومن المتوقع أن ينمو الجهد فوق 500 كيلو فولت بمعدل نمو سنوي مركب كبير خلال فترة التنبؤ.
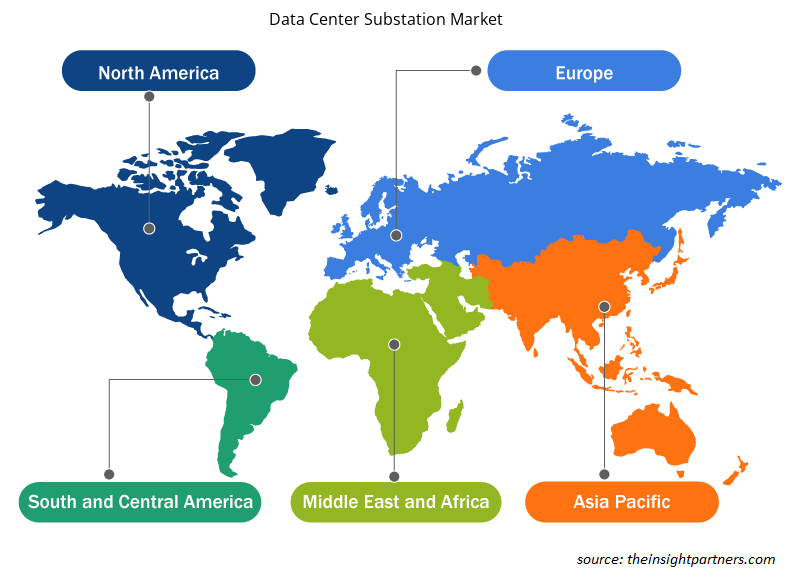
تحليل حصة سوق محطات مراكز البيانات حسب المنطقة الجغرافية
ينقسم النطاق الجغرافي لتقرير سوق محطات مراكز البيانات بشكل أساسي إلى خمس مناطق: أمريكا الشمالية، وآسيا والمحيط الهادئ، وأوروبا، والشرق الأوسط وأفريقيا، وأمريكا الجنوبية والوسطى.
من المتوقع أن تنمو منطقة آسيا والمحيط الهادئ بأعلى معدل نمو سنوي مركب خلال الفترة المتوقعة. يعمل ارتفاع شبكات الجيل الخامس والحوسبة السحابية وتحليلات البيانات الضخمة والعديد من التقنيات المتقدمة الأخرى على نطاق واسع من البيانات التي تحتاج إلى المعالجة والتحليل. يعمل الطلب على تخزين البيانات والحوسبة على تعزيز سوق مراكز البيانات في المنطقة، مما يكمل سوق محطات مراكز البيانات في منطقة آسيا والمحيط الهادئ.
رؤى إقليمية حول سوق محطات مراكز البيانات
لقد قام المحللون في Insight Partners بشرح الاتجاهات والعوامل الإقليمية المؤثرة على سوق محطات مراكز البيانات طوال فترة التوقعات بشكل شامل. يناقش هذا القسم أيضًا قطاعات سوق محطات مراكز البيانات والجغرافيا في جميع أنحاء أمريكا الشمالية وأوروبا ومنطقة آسيا والمحيط الهادئ والشرق الأوسط وأفريقيا وأمريكا الجنوبية والوسطى.
- احصل على البيانات الإقليمية المحددة لسوق محطات مراكز البيانات
نطاق تقرير سوق محطات مركز البيانات
| سمة التقرير | تفاصيل |
|---|---|
| حجم السوق في عام 2023 | 11.38 مليار دولار أمريكي |
| حجم السوق بحلول عام 2031 | 18.47 مليار دولار أمريكي |
| معدل النمو السنوي المركب العالمي (2023 - 2031) | 6.2% |
| البيانات التاريخية | 2021-2022 |
| فترة التنبؤ | 2024-2031 |
| القطاعات المغطاة |
حسب المكون
|
| المناطق والدول المغطاة |
أمريكا الشمالية
|
| قادة السوق وملفات تعريف الشركات الرئيسية |
|
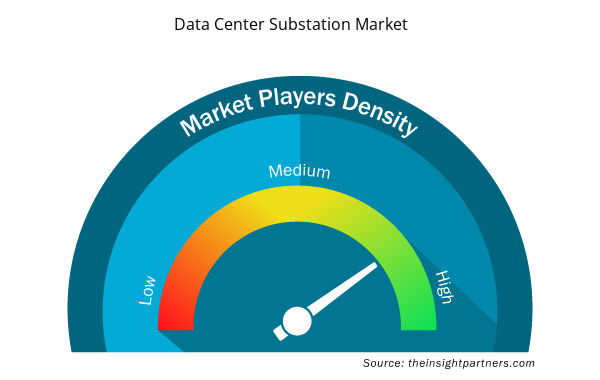
كثافة اللاعبين في سوق محطات مراكز البيانات: فهم تأثيرها على ديناميكيات الأعمال
يشهد سوق محطات مراكز البيانات نموًا سريعًا، مدفوعًا بالطلب المتزايد من المستخدم النهائي بسبب عوامل مثل تفضيلات المستهلكين المتطورة والتقدم التكنولوجي والوعي الأكبر بفوائد المنتج. ومع ارتفاع الطلب، تعمل الشركات على توسيع عروضها والابتكار لتلبية احتياجات المستهلكين والاستفادة من الاتجاهات الناشئة، مما يؤدي إلى زيادة نمو السوق.
تشير كثافة اللاعبين في السوق إلى توزيع الشركات أو المؤسسات العاملة في سوق أو صناعة معينة. وهي تشير إلى عدد المنافسين (اللاعبين في السوق) الموجودين في مساحة سوق معينة نسبة إلى حجمها أو قيمتها السوقية الإجمالية.
الشركات الرئيسية العاملة في سوق محطات مركز البيانات هي:
- ايتون
- جنرال الكتريك
- شركة هيتاشي للطاقة المحدودة
- شركة NEI للهندسة الكهربائية
- NR الكهربائية
- شركة الكهرباء S&C
إخلاء المسؤولية : الشركات المذكورة أعلاه ليست مرتبة بأي ترتيب معين.
- احصل على نظرة عامة على أهم اللاعبين الرئيسيين في سوق محطات مركز البيانات
أخبار سوق محطات مراكز البيانات والتطورات الأخيرة
يتم تقييم سوق محطات مراكز البيانات من خلال جمع البيانات النوعية والكمية بعد البحث الأولي والثانوي، والذي يتضمن منشورات الشركات المهمة وبيانات الجمعيات وقواعد البيانات. فيما يلي بعض التطورات في سوق محطات مراكز البيانات:
- أعلنت شركة NTT Ltd. وهي شركة رائدة في مجال البنية التحتية لتكنولوجيا المعلومات والخدمات، من خلال شركة NTT Global Data Centers Corporation (شركة تابعة لشركة NTT Ltd.)، عن إطلاق مركز البيانات الجديد الخاص بها في حرم NTT Cyberjaya. يتماشى هذا المرفق، باستثمار يزيد عن 50 مليون دولار أمريكي (234 مليون رينغيت ماليزي)، مع رؤية النمو الرقمي في ماليزيا، والتي تهدف إلى أن تكون ماليزيا "نمرًا رقميًا آسيويًا" بحلول عام 2025. يحتوي CBJ6، وهو مركز البيانات السادس في حرم NTT، على حمولة تكنولوجيا معلومات حرجة تبلغ 7 ميجاوات، ومساحة 4890 مترًا مربعًا، ومحطتان فرعيتان 33 كيلو فولت مع استقبال طاقة متنوع وتقنية جدار تبريد متقدمة للحفاظ على بيئة مستقرة للأرفف عالية الكثافة حتى 15 كيلووات. يكمل CBJ6 مركز بيانات Cyberjaya 5 (CBJ5)، الذي تم بناؤه في عام 2021، ويحتوي المرفق المشترك على مساحة 20000 متر مربع وحمولة منشأة تبلغ 22 ميجاوات. (المصدر: NTT Ltd، بيان صحفي، أكتوبر 2023)
- أعلنت شركة Colt Data Centre Services (DCS)، وهي شركة عالمية تقدم حلول مراكز البيانات الضخمة والكبيرة الحجم للمؤسسات، عن إطلاق أول مركز بيانات لها في الهند. ويمثل مركز البيانات الرائد في نافي مومباي التوسع الاستراتيجي لشركة Colt DCS والتزامها بدعم الطلب المتزايد من مقدمي خدمات الحوسبة السحابية الضخمة الحجم والشركات التجارية الكبيرة في سوق مراكز البيانات الهندية سريعة النمو. ويضم مركز البيانات محطة فرعية GIS عالية المرونة بقوة 220 كيلو فولت في الموقع مع تكوين LILO. (المصدر: Colt Data Centre Services Holdings، بيان صحفي، سبتمبر 2023)
تقرير سوق محطات مركز البيانات والتغطية والنتائج المتوقعة
يوفر تقرير "حجم سوق محطات مراكز البيانات والتوقعات (2021-2031)" تحليلاً مفصلاً للسوق يغطي المجالات التالية:
- حجم سوق محطات مراكز البيانات والتوقعات على المستويات العالمية والإقليمية والوطنية لجميع قطاعات السوق الرئيسية التي يغطيها النطاق
- اتجاهات سوق محطات مراكز البيانات بالإضافة إلى ديناميكيات السوق مثل المحركات والقيود والفرص الرئيسية
- تحليل مفصل لقوى PEST/Porter الخمس وSWOT
- تحليل سوق محطات مراكز البيانات يغطي اتجاهات السوق الرئيسية والإطار العالمي والإقليمي والجهات الفاعلة الرئيسية واللوائح والتطورات الأخيرة في السوق
- تحليل المشهد الصناعي والمنافسة الذي يغطي تركيز السوق، وتحليل خريطة الحرارة، واللاعبين البارزين، والتطورات الأخيرة لسوق محطات فرعية لمركز البيانات
- ملفات تعريف الشركة التفصيلية

أنكيتا خبيرة ديناميكية في أبحاث السوق والاستشارات، تتمتع بخبرة تزيد عن 8 سنوات في قطاعات التكنولوجيا والإعلام وتكنولوجيا المعلومات والاتصالات والإلكترونيات وأشباه الموصلات. وقد قادت ونفذت بنجاح أكثر من 100 مهمة استشارية وبحثية لعملاء عالميين مثل مايكروسوفت وأوراكل وشركة NEC وSAP وKPMG وExpeditors International. تشمل كفاءاتها الأساسية تقييم السوق، وتحليل البيانات، والتنبؤ، وصياغة الاستراتيجيات، والاستخبارات التنافسية، وكتابة التقارير.
أنكيتا بارعة في إدارة دورات المشاريع الكاملة، بدءًا من تصميم عروض ما قبل البيع ومناقشات العملاء، وصولًا إلى تقديم رؤى عملية بعد البيع. كما أنها ماهرة في إدارة فرق متعددة الوظائف، وهيكلة وحدات بحثية معقدة، ومواءمة الحلول مع أهداف العمل الخاصة بالعملاء. وقد مكنتها مهاراتها الممتازة في التواصل والقيادة والعرض التقديمي من تحقيق نتائج قيّمة باستمرار في بيئات سوقية سريعة التطور.
- التحليل التاريخي (سنتان)، سنة الأساس، التوقعات (7 سنوات) مع معدل النمو السنوي المركب
- تحليل PEST و SWOT
- حجم السوق والقيمة / الحجم - عالمي، إقليمي، بلد
- الصناعة والمنافسة
- مجموعة بيانات إكسل
التقارير الحديثة
تقارير ذات صلة
شهادات العملاء
تقرير سوق أنظمة SCADA من Insight Partners شامل، ويقدم رؤى قيّمة حول الاتجاهات الحالية والتوقعات المستقبلية. تميّز الفريق باحترافية عالية وسرعة في الاستجابة ودعم مستمر طوال الوقت. نحن راضون جدًا ونوصي بشدة بخدماتهم.
ران كيديم شريك, شركة ريالي تكنولوجيز المحدودةطلبتُ تقريرًا عن سوق برمجيات محدد، وأعدّه الفريق في غضون أيام قليلة. كانت المعلومات ذات صلة وثيقة وعرضها جيد. ثم طلبتُ بعض التعديلات والإضافات على التقرير. وكان الفريق متجاوبًا للغاية، وحصلتُ على التقرير النهائي في أقل من أسبوع.
جان هيرفيه جين رئيس مجلس الإدارة, فيوتشر أناليتيكاعملنا مع شركة "إنسايت بارتنرز" لإجراء دراسة سوقية وتوقعات مهمة. زودونا برؤى واضحة حول الفرص والمخاطر، مما ساعدنا في صياغة خططنا. كانت أبحاثهم سهلة الاستخدام ومبنية على بيانات دقيقة، مما ساعدنا على اتخاذ قرارات ذكية وواثقة. نوصي بهم بشدة.
بيوش ناجبال نائب الرئيس الأول, شعاع عالي عالميقدّمت شركة Insight Partners أبحاثًا سوقية ثاقبة ومنظمة جيدًا بخبرة واسعة في هذا المجال. تميّز فريقهم بالاحترافية وسرعة الاستجابة طوال الوقت. وسهّل موقعهم الإلكتروني سهل الاستخدام الوصول إلى تقارير القطاع. نوصي بهم بشدة لخدمات بحثية موثوقة وعالية الجودة.
يوكيهيكو أداتشي المدير التنفيذي, ديب بلو، ذ.م.م.هذه أول مرة أشتري فيها تقرير سوق من The Insight Partners. رغم أنني كنت مترددًا في البداية، إلا أنني زرت موقعهم الإلكتروني وشعرت براحة أكبر للمخاطرة وشراء تقرير السوق. أنا راضٍ تمامًا عن جودة التقرير وخدمة العملاء. كانت لديّ عدة أسئلة وتعليقات حول التقرير الأولي، ولكن بعد بضع محادثات عبر البريد الإلكتروني مع محللهم، أعتقد أن لديّ تقريرًا يمكنني استخدامه كمدخل لعملية التخطيط الاستراتيجي لدينا. شكرًا جزيلاً لكم على تخصيص وقتكم الإضافي وجعل هذه التجربة إيجابية. سأوصي بخدماتكم للآخرين بالتأكيد، وستكونون أول من ألجأ إليه عندما نحتاج إلى المزيد من بيانات السوق.
جون سوزوكي الرئيس والرئيس التنفيذي وعضو مجلس الإدارة, بي كيه تكنولوجيزأود أن أقدّر دعمكم واحترافيتكم في الاستجابة لطلبي للحصول على معلومات بشأن سوق التشخيص المخبري للأمراض المعدية في نيجيريا. كما أُقدّر صبركم وتوجيهكم، واستعدادكم لتقديم خصم، مما مكّننا في النهاية من إتمام الصفقة. أتطلع إلى التعامل مع "ذا إنسايت بارتنرز" مستقبلًا، كل ذلك بفضل الانطباع الذي تركتموه لديّ نتيجةً لهذا اللقاء الأول.
الدكتور تشيجيوك أونيا المدير الإداري, شركة باينكريست للرعاية الصحية المحدودةسبب الشراء
- اتخاذ قرارات مدروسة
- فهم ديناميكيات السوق
- تحليل المنافسة
- رؤى العملاء
- توقعات السوق
- تخفيف المخاطر
- التخطيط الاستراتيجي
- مبررات الاستثمار
- تحديد الأسواق الناشئة
- تحسين استراتيجيات التسويق
- تعزيز الكفاءة التشغيلية
- مواكبة التوجهات التنظيمية


 احصل على عينة مجانية ل - سوق محطات مراكز البيانات الفرعية