سوق نسيج البيانات – المحركات والاتجاهات والفرص وإحصاءات النمو | 2031

  • Report Code : TIPTE100000792
  • Category : Technology, Media and Telecommunications
  • Status : Published
  • No. of Pages : 198
Buy Now

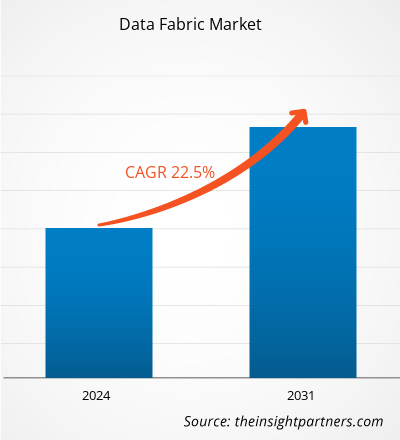
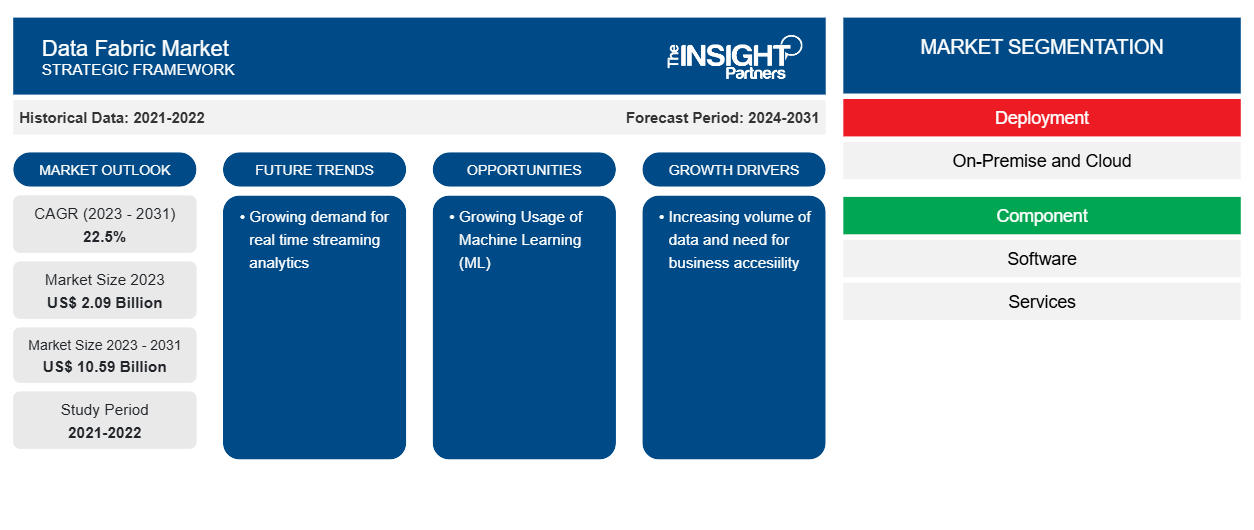
[تقرير بحثي] من المتوقع أن يصل سوق نسيج البيانات إلى 2,466.12 مليون دولار أمريكي بحلول عام 2028 من 1,241.04 مليون دولار أمريكي في عام 2021؛ ومن المقدر أن يسجل معدل نمو سنوي مركب قدره 10.3% خلال الفترة 2021-2028.

تزايد استخدام الإنترنت وارتفاع العديد من الأجهزة المتصلة، مثل الهواتف الذكية وأجهزة الكمبيوتر المحمولة والأجهزة اللوحية وأجهزة الكمبيوتر ، زيادة كمية وتنوع بيانات الأعمال بشكل مباشر. على سبيل المثال، يتم استخدام الكاميرات وأجهزة الاستشعار لأغراض المراقبة وجمع بيانات الموقع بشكل مستمر. إن الحاجة المتزايدة إلى رؤى مفيدة من البيانات المجمعة تغذي اعتماد تحليلات البيانات بين الشركات. ولأغراض التحليل، يتم استخراج البيانات من نسيج البيانات.

علاوة على ذلك، أثناء التحليل، يدمج نسيج البيانات البيانات من مجموعات البيانات المنظمة وشبه المنظمة وغير المنظمة. يتزايد تنوع بيانات الأعمال وكمية مجموعات البيانات يوميًا بسبب تطور الرقمنة عبر العديد من مؤسسات الأعمال. على سبيل المثال، وفقا للبيانات السنوية الثامنة لشركة دومو، ينفق المستهلكون مليون دولار أمريكي عبر الإنترنت، ويجرون 1.4 مليون مكالمة فيديو وصوتية، ويشاركون 150 ألف رسالة على فيسبوك، ويبثون 404 ألف ساعة من مقاطع الفيديو على نيتفليكس. وبالتالي، فإن البيانات الجماعية التي تحتاج إلى إدارتها هي بكميات هائلة. ولذلك، يتم استخدام نسيج البيانات لإدارة البيانات. يساعد نسيج البيانات على دمج البيانات من مصادر مختلفة، وتخزين كميات كبيرة من البيانات، وتحليلها بسلاسة في مكان واحد. لذلك، يتزايد الطلب على نسيج البيانات لجمع معلومات الأعمال.


الرؤى الإستراتيجية

تأثير جائحة كوفيد-19 على سوق نسيج البيانات

لقد أثر وباء فيروس كورونا (COVID-19) على معظم الأعمال التجارية على مستوى العالم. وأجبر النمو المستمر في عدد المرضى المصابين بالفيروس الحكومات على وضع حظر على نقل البشر والبضائع. وقد أدى فرض الإغلاق إلى انخفاض إنتاج السلع والسلع والخدمات. التصنيع والسيارات وأشباه الموصلات & الإلكترونيات والنفط والأمبير. شهدت قطاعات الغاز والتعدين والطيران وغيرها من الصناعات انخفاضًا في عملياتها بسبب الإغلاق المؤقت للأنشطة.

أجبر وباء فيروس كورونا (COVID-19) الشركات على البحث عن بدائل جديدة للتعافي السريع والاهتمام بالحاجة الملحة للوصول إلى ما يكفي من البيانات في أوقات الأزمات. علاوة على ذلك، انتقلت البنوك إلى فرق المبيعات والخدمة عن بعد وأطلقت تواصلًا رقميًا مع العملاء لإجراء ترتيبات دفع مرنة للقروض والرهون العقارية. تحولت متاجر البقالة إلى الطلب والتسليم عبر الإنترنت كعملها الأساسي. اعتمدت المدارس في العديد من المناطق التعلم عبر الإنترنت والفصول الدراسية الرقمية. وقد أدت هذه الأساليب إلى زيادة كمية وتنوع بيانات الأعمال. وبالتالي، فإن الحاجة المتزايدة إلى مرونة الأعمال وإمكانية الوصول إلى البيانات وزيادة الطلب على تحليلات البث في الوقت الفعلي هي من بين العوامل التي تساهم في نمو سوق نسيج البيانات.

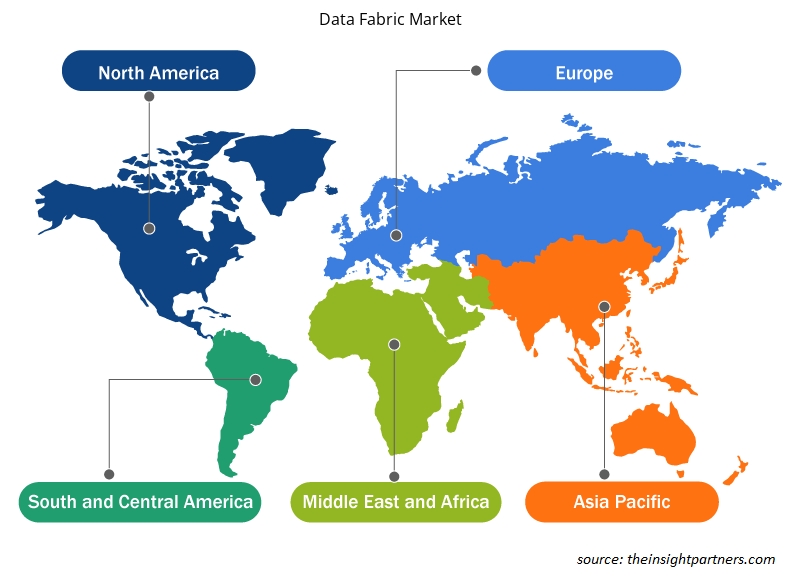
مربحة مناطق سوق نسيج البيانات

رؤى سوق نسيج البيانات

الطلب المتزايد على التحليلات في الوقت الفعلي

على مدى السنوات القليلة الماضية، أصبحت تحليلات البيانات الضخمة موضع اهتمام بحثي كبير بين الممارسين والباحثين. ارتفعت الاستثمارات الخاصة والعامة في تطبيق تحليلات البيانات الضخمة إلى مليون دولار في جميع أنحاء العالم. يؤدي النمو السريع في حجم البيانات وتعقيدها بسبب ارتفاع حركة البيانات المتنقلة والحوسبة السحابية وزيادة تطوير واعتماد التقنيات، مثل الذكاء الاصطناعي (AI) وإنترنت الأشياء (IoT)، إلى دفع الطلب على البيانات الضخمة. تقنيات التحليلات. تتمتع هذه التقنيات بإمكانات هائلة لتحويل الأعمال بالكامل. تقوم منصات البيانات الضخمة بتحليل مجموعات البيانات الضخمة المنظمة وغير المنظمة بشكل فعال. تعد صناعة BFSI واحدة من أكبر الصناعات التي تنفق مبلغًا كبيرًا على البيانات الضخمة وتكنولوجيا التحليلات. وتنشط المناطق المحتملة، مثل أمريكا الشمالية وأوروبا، بشكل كبير في تنفيذ هذه التقنيات. كما تقوم حكومات هذه المناطق بتنفيذ مشاريع مختلفة لتطبيق البيانات الضخمة في مختلف الصناعات. على سبيل المثال، حصل مشروع أوروبا للبيانات الضخمة لعامي 2015 و2017 على تمويل من برنامج البحث والابتكار Horizon 2020 التابع للاتحاد الأوروبي. صمم المشروع نماذج أولية لتطبيقات البيانات الضخمة في العديد من القطاعات التي يمكنها تقديم عدد كبير من مجموعات البيانات ويمكنها التقدم نحو مناهج الحلول القائمة على البيانات. لذلك، يتم جمع البيانات من نسيج البيانات لأغراض التحليل في الوقت الفعلي.

تعد تقنية تحليل البيانات الضخمة أحد المحركات المهمة في سوق نسيج البيانات، والتي يساعد في الحصول على رؤى قابلة للتنفيذ من كمية البيانات المنظمة والضخمة المتوفرة في البيانات غير المنظمة من مصادر مختلفة، مثل الويب ووسائل التواصل الاجتماعي. تساعد الرؤية المكتسبة من تحليل البيانات الضخمة الشركات على تحسين العديد من المجالات مثل الاحتفاظ بالعملاء، واكتشاف الأسواق الجديدة، وخدمة العملاء المحسنة، والاحتفاظ بالموظفين، وتحسين ولاء العملاء. لذلك، يساعد الطلب المتزايد على التحليلات في الوقت الفعلي في نمو سوق نسيج البيانات.

رؤى السوق القائمة على النشر

استنادًا إلى النشر، ينقسم سوق نسيج البيانات إلى سحابي ومحلي. في عام 2020، قاد قطاع السحابة السوق واستحوذ على حصة سوقية أكبر.

سوق نسيج البيانات، حسب النشر، 2020 و2028 (%)
< br>

رؤى السوق القائمة على المكونات

استنادًا إلى المكونات، ينقسم سوق نسيج البيانات إلى برامج وخدمات. في عام 2020، استحوذ قطاع البرمجيات على حصة سوقية أكبر.

رؤى السوق القائمة على الحلول

استنادًا إلى الحل، يعد سوق نسيج البيانات مقسمة إلى اكتشاف البيانات، واستيعاب البيانات، وتنسيق البيانات، والوصول إلى بيانات النسيج، وإدارة البيانات، وإدارة النسيج. في عام 2020، استحوذ قطاع إدارة البيانات على حصة سوقية أكبر.

رؤى السوق القائمة على المستخدم النهائي

استنادًا إلى المستخدم النهائي، البيانات يتم تقسيم سوق النسيج إلى BFSI وتكنولوجيا المعلومات & الاتصالات وتجارة التجزئة والرعاية الصحية والأدوية وغيرها. في عام 2020، قاد قطاع BFSI سوق نسيج البيانات واستحوذ على أكبر حصة في السوق.

يتبنى اللاعبون العاملون في سوق نسيج البيانات استراتيجيات مثل عمليات الدمج والاستحواذ ، ومبادرات السوق للحفاظ على مراكزها في السوق. فيما يلي بعض التطورات التي قام بها اللاعبون الرئيسيون:

  • في مارس 2021، كشفت شركة Denodo Technologies Inc.، الشركة الرائدة في مجال المحاكاة الافتراضية للبيانات، عن Denodo Standard، وهو حل جديد لتكامل البيانات يمكن الوصول إليه في الأسواق السحابية البارزة . يتم استخدام محرك المحاكاة الافتراضية للبيانات الحالي من Denodo في الحل الجديد لتمكين أداء وإنتاجية أكبر، مما يسمح بالتحليلات في الوقت الفعلي وخدمات البيانات دون الحاجة إلى نسخ البيانات في مستودع آخر.
  • في سبتمبر 2020، أصدرت شركة Denodo Technologies Inc. إصدارًا جديدًا من برنامج منصة Denodo الخاص بها. يهدف الإصدار الأخير 8.0 إلى تحسين الأداء من خلال تسريع التكامل المختلط/متعدد السحابات وأتمتة إدارة البيانات باستخدام الذكاء الاصطناعي (AI) والتعلم الآلي (ML) مع تسريع الاستعلام الذكي. يدعم النظام الأساسي المحاكاة الافتراضية للبيانات في نسيج بيانات منطقي من خلال توفير اقتراحات ذكية وأداء فائق ودعم النظام الأساسي كخدمة (PaaS).
< h3>تم تقسيم سوق نسيج البيانات العالمي كما هو مذكور أدناه:

حسب النشر

  • السحابة
  • محليًا

  • حسب المكون

    • البرامج
    • الخدمات


    حسب الحل

    < ul>
  • اكتشاف البيانات
  • استيعاب البيانات
  • تنسيق البيانات
  • الوصول إلى بيانات النسيج
  • إدارة البيانات
  • إدارة الأقمشة

بواسطة المستخدم النهائي

  • BFSI
  • تكنولوجيا المعلومات & الاتصالات
  • البيع بالتجزئة
  • الرعاية الصحية & المستحضرات الصيدلانية
  • أخرى

حسب الجغرافيا

  • أمريكا الشمالية
    • الولايات المتحدة
    • كندا< /li>
    • المكسيك
  • أوروبا
    • فرنسا
    • ألمانيا
    • إيطاليا
    • المملكة المتحدة
    • روسيا
    • بقية أوروبا
  • آسيا والمحيط الهادئ (APAC)
    • الصين< /li>
    • الهند
    • كوريا الجنوبية
    • اليابان
    • أستراليا
    • باقي دول آسيا والمحيط الهادئ
  • الشرق الأوسط & أفريقيا (MEA)
    • جنوب أفريقيا
    • المملكة العربية السعودية
    • الإمارات العربية المتحدة
    • باقي دول الشرق الأوسط وأفريقيا
  • أمريكا الجنوبية (SAM)
    • البرازيل
    • الأرجنتين
    • باقي دول SAM

الملفات التعريفية للشركة

  • Denodo Technologies
  • IBM Corporation
  • Informatica Corporation
  • K2View
  • NetApp, Inc.
  • Oracle Corporation
  • SAP SE
  • Software AG
  • Teradata
  • Hewlett Packard Enterprise Development LP (HPE)
Report Coverage
Report Coverage

Revenue forecast, Company Analysis, Industry landscape, Growth factors, and Trends

Segment Covered
Segment Covered

This text is related
to segments covered.

Regional Scope
Regional Scope

North America, Europe, Asia Pacific, Middle East & Africa, South & Central America

Country Scope
Country Scope

This text is related
to country scope.

Frequently Asked Questions


What are the driving factors responsible for the growth of Data fabric market?

Rising Quantity and Variety of Business Data
Growing Demand for Real-Time Analytics

What are the market opportunities for data fabric market?

With the growing population, the number of internet users is increasing. For instance, it has been observed that there are 4.66 Million internet users present globally (59% of the global population). From this total, 92.6% (4.32 Million) users accessed internet through mobile devices. A few countries with the highest internet penetration rate globally are Denmark, the UAE, and Sweden. Further, till 2020, APAC had the largest number of online users with over 2.5 Million and Europe was ranked second with almost 728 million internet users. In 2020, China held the leading market share in the world, followed by India and the US. China has more than 854 million internet users and India has around 560 million online users. Still there are a few MEA countries, such as Oman, Qatar, and Kuwait, where the digitalization and internet are in initial phase. The continuous growth in the internet users also let the industries to transform their business to the digital platform. Also, the need for cloud technology has positively impacted the businesses because of the storage and data transfer facilities and cost-effectiveness.

Which deployment type-based segment has the largest market share in 2020?

Based on the deployment type, the data fabric market is segmented into cloud and on-premise. The global data fabric market is dominated by cloud segment in 2020, which accounted for 69.1%.

What are the future trend for data fabric market?

With the digital transformation, the use of the cloud-based platform is increasing due to the simplification of the deployment time and the reduction in the deployment cost. Further, the internet infrastructure has matured in developed countries and is flourishing in several developing countries across the world, which allows Components in these countries access to the cloud-based platform. The adoption of data fabric across several applications is associated with the varying end user requirements. However, technological advancements also play a vital role in enhancing the adoption trend by companies and customers. For instance, many financial institutions use financial analytics to gain insights, ensure optimal performance, and make crucial decisions. Financial analytics helps the banking sector enhance the customer experience and assists in risk management.

Who are the major vendors in the data fabric market?

A few key companies operating in the data fabric market are Denodo Technologies; IBM Corporation; Informatica Corporation; K2View; NetApp, Inc.; Oracle Corporation; SAP SE; Software AG; Teradata; and Hewlett Packard Enterprise Development LP (HPE). Several other companies are also functioning in the market and are contributing substantial revenues toward the market's growth.

Which region has the largest market share in the data fabric market?

North America held the significant market share in year 2020, along with the notable revenue generation opportunities in Europe and APAC.

The List of Companies - Data Fabric Market

  1. Denodo Technologies Inc
  2. Hewlett Packard Enterprise Company
  3. IBM Corp.
  4. Informatica Corporation
  5. K2VIEW
  6. NetApp, Inc.
  7. Oracle Corporation
  8. SAP SE
  9. Software AG
  10. Teradata Corporation

The Insight Partners performs research in 4 major stages: Data Collection & Secondary Research, Primary Research, Data Analysis and Data Triangulation & Final Review.

  1. Data Collection and Secondary Research:

As a market research and consulting firm operating from a decade, we have published and advised several client across the globe. First step for any study will start with an assessment of currently available data and insights from existing reports. Further, historical and current market information is collected from Investor Presentations, Annual Reports, SEC Filings, etc., and other information related to company’s performance and market positioning are gathered from Paid Databases (Factiva, Hoovers, and Reuters) and various other publications available in public domain.

Several associations trade associates, technical forums, institutes, societies and organization are accessed to gain technical as well as market related insights through their publications such as research papers, blogs and press releases related to the studies are referred to get cues about the market. Further, white papers, journals, magazines, and other news articles published in last 3 years are scrutinized and analyzed to understand the current market trends.

  1. Primary Research:

The primarily interview analysis comprise of data obtained from industry participants interview and answers to survey questions gathered by in-house primary team.

For primary research, interviews are conducted with industry experts/CEOs/Marketing Managers/VPs/Subject Matter Experts from both demand and supply side to get a 360-degree view of the market. The primary team conducts several interviews based on the complexity of the markets to understand the various market trends and dynamics which makes research more credible and precise.

A typical research interview fulfils the following functions:

  • Provides first-hand information on the market size, market trends, growth trends, competitive landscape, and outlook
  • Validates and strengthens in-house secondary research findings
  • Develops the analysis team’s expertise and market understanding

Primary research involves email interactions and telephone interviews for each market, category, segment, and sub-segment across geographies. The participants who typically take part in such a process include, but are not limited to:

  • Industry participants: VPs, business development managers, market intelligence managers and national sales managers
  • Outside experts: Valuation experts, research analysts and key opinion leaders specializing in the electronics and semiconductor industry.

Below is the breakup of our primary respondents by company, designation, and region:

Research Methodology

Once we receive the confirmation from primary research sources or primary respondents, we finalize the base year market estimation and forecast the data as per the macroeconomic and microeconomic factors assessed during data collection.

  1. Data Analysis:

Once data is validated through both secondary as well as primary respondents, we finalize the market estimations by hypothesis formulation and factor analysis at regional and country level.

  • Macro-Economic Factor Analysis:

We analyse macroeconomic indicators such the gross domestic product (GDP), increase in the demand for goods and services across industries, technological advancement, regional economic growth, governmental policies, the influence of COVID-19, PEST analysis, and other aspects. This analysis aids in setting benchmarks for various nations/regions and approximating market splits. Additionally, the general trend of the aforementioned components aid in determining the market's development possibilities.

  • Country Level Data:

Various factors that are especially aligned to the country are taken into account to determine the market size for a certain area and country, including the presence of vendors, such as headquarters and offices, the country's GDP, demand patterns, and industry growth. To comprehend the market dynamics for the nation, a number of growth variables, inhibitors, application areas, and current market trends are researched. The aforementioned elements aid in determining the country's overall market's growth potential.

  • Company Profile:

The “Table of Contents” is formulated by listing and analyzing more than 25 - 30 companies operating in the market ecosystem across geographies. However, we profile only 10 companies as a standard practice in our syndicate reports. These 10 companies comprise leading, emerging, and regional players. Nonetheless, our analysis is not restricted to the 10 listed companies, we also analyze other companies present in the market to develop a holistic view and understand the prevailing trends. The “Company Profiles” section in the report covers key facts, business description, products & services, financial information, SWOT analysis, and key developments. The financial information presented is extracted from the annual reports and official documents of the publicly listed companies. Upon collecting the information for the sections of respective companies, we verify them via various primary sources and then compile the data in respective company profiles. The company level information helps us in deriving the base number as well as in forecasting the market size.

  • Developing Base Number:

Aggregation of sales statistics (2020-2022) and macro-economic factor, and other secondary and primary research insights are utilized to arrive at base number and related market shares for 2022. The data gaps are identified in this step and relevant market data is analyzed, collected from paid primary interviews or databases. On finalizing the base year market size, forecasts are developed on the basis of macro-economic, industry and market growth factors and company level analysis.

  1. Data Triangulation and Final Review:

The market findings and base year market size calculations are validated from supply as well as demand side. Demand side validations are based on macro-economic factor analysis and benchmarks for respective regions and countries. In case of supply side validations, revenues of major companies are estimated (in case not available) based on industry benchmark, approximate number of employees, product portfolio, and primary interviews revenues are gathered. Further revenue from target product/service segment is assessed to avoid overshooting of market statistics. In case of heavy deviations between supply and demand side values, all thes steps are repeated to achieve synchronization.

We follow an iterative model, wherein we share our research findings with Subject Matter Experts (SME’s) and Key Opinion Leaders (KOLs) until consensus view of the market is not formulated – this model negates any drastic deviation in the opinions of experts. Only validated and universally acceptable research findings are quoted in our reports.

We have important check points that we use to validate our research findings – which we call – data triangulation, where we validate the information, we generate from secondary sources with primary interviews and then we re-validate with our internal data bases and Subject matter experts. This comprehensive model enables us to deliver high quality, reliable data in shortest possible time.

Your data will never be shared with third parties, however, we may send you information from time to time about our products that may be of interest to you. By submitting your details, you agree to be contacted by us. You may contact us at any time to opt-out.

Related Reports