تقرير سوق أجهزة تصوير الشبكية 2028 حسب القطاعات والجغرافيا والديناميكيات والتطورات الأخيرة والرؤى الاستراتيجية
البيانات التاريخية : 2019-2020 | سنة الأساس : 2021 | فترة التنبؤ : 2022-2028توقعات سوق أجهزة تصوير الشبكية حتى عام 2028 - تأثير جائحة كوفيد-19 والتحليل العالمي حسب نوع الجهاز (تصوير الأوعية الدموية بالفلوريسين، وكاميرا قاع العين، والتصوير المقطعي البصري)، والمستخدم النهائي (المستشفيات والعيادات، ومراكز الجراحة الخارجية، ومراكز رعاية العيون المتخصصة، وغيرهم من المستخدمين النهائيين)
- تاريخ التقرير : Jan 2022
- رمز التقرير : TIPRE00008683
- الفئة : علوم الحياة
- الحالة : نُشرت
- تنسيقات التقارير المتاحة :


- عدد الصفحات : 148
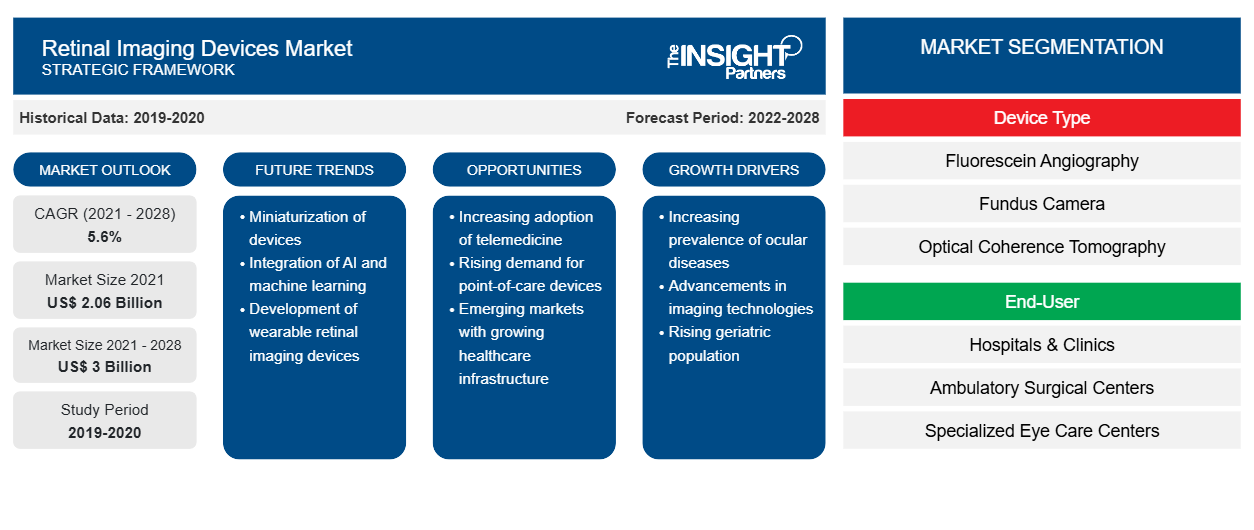
من المتوقع أن يصل سوق أجهزة تصوير شبكية العين إلى 3.00 مليار دولار أمريكي بحلول عام 2028 من 2.06 مليار دولار أمريكي في عام 2021؛ ومن المتوقع أن ينمو بمعدل نمو سنوي مركب قدره 5.6٪ خلال الفترة 2021-2028.
التصوير الشبكي هو تقنية تستخدم لتحليل وتشخيص حالة شبكية العين لدى المريض. تستخدم أجهزة التصوير الشبكي أنظمة تصوير عالية الدقة لالتقاط صور داخلية للعين. تساعد الصورة الملتقطة أطباء شبكة الشبكة الخاصة الافتراضية (VSP) في تقييم صحة شبكية العين، مما يساعد في اكتشاف وإدارة حالات العين والصحة مثل مرض السكري والجلوكوما والتنكس البقعي، وغيرها.
قم بتخصيص هذا التقرير ليناسب متطلباتك
ستحصل على تخصيص لأي تقرير - مجانًا - بما في ذلك أجزاء من هذا التقرير، أو تحليل على مستوى الدولة، وحزمة بيانات Excel، بالإضافة إلى الاستفادة من العروض والخصومات الرائعة للشركات الناشئة والجامعات
سوق أجهزة تصوير الشبكية: رؤى استراتيجية
- احصل على أهم اتجاهات السوق الرئيسية لهذا التقرير.ستتضمن هذه العينة المجانية تحليلاً للبيانات، بدءًا من اتجاهات السوق وحتى التقديرات والتوقعات.
يعود نمو سوق أجهزة تصوير الشبكية إلى تحسن قدرة أطباء العيون على الوصول إلى الشبكية، والمبادرات العالمية المتنامية لعلاج العمى والتقدم التكنولوجي. ومع ذلك، فإن التكلفة العالية لأجهزة التصوير المقطعي البصري تعيق نمو السوق.
رؤى السوق
ارتفاع معدل انتشار أمراض العيون
تُستخدم أجهزة تصوير الشبكية على نطاق واسع لتشخيص وعلاج العديد من الأمراض المتعلقة بالعين مثل اعتلال الشبكية السكري ، والتنكس البقعي المرتبط بالعمر، والجلوكوما، وسرطان العين، ومشاكل الرؤية الخفيفة. بالإضافة إلى ذلك، يتزايد القلق بشأن العمى أو ضعف البصر بشكل كبير في جميع أنحاء العالم. وفقًا للبيانات التي نشرتها منظمة الصحة العالمية (WHO) في أكتوبر 2021، يعيش ما يقرب من 2.2 مليار شخص مع ضعف البصر أو العمى. ومن بين هؤلاء المليار شخص تقريبًا، يمكن الوقاية من مشاكل العين المختلفة المتعلقة بضعف الرؤية عن بعد أو العمى المعتدل أو الشديد. بدأت تقنيات التشخيص المتعلقة بالصور في تقديم نمو غير مسبوق في أمراض العيون بناءً على مجموعات البيانات المورفولوجية. ومن المتوقع أن يساعد هذا العامل سوق أجهزة تصوير الشبكية خلال فترة التنبؤ.
رؤى تعتمد على نوع الجهاز
بناءً على نوع الجهاز، تم تقسيم سوق أجهزة تصوير الشبكية العالمية إلى تصوير الأوعية الدموية بالفلوريسين وكاميرا قاع العين والتصوير المقطعي البصري. احتل قطاع كاميرا قاع العين أكبر حصة من السوق في عام 2021. تحول تصوير قاع العين من الفلاشات الإلكترونية إلى الكاميرات القائمة على الهواتف الذكية إلى مجموعة فحص العين المحمولة الأحدث (PEEK). PEEK هو تطبيق قائم على الهواتف الذكية لإجراء فحص شامل للعين. تتمثل ميزة هذه الكاميرات في أنه يمكن لغير أخصائي طب العيون التقاط الصور، ومع بعض التدريب، تصنيفها أيضًا. ومع ذلك، من المتوقع أن يسجل قطاع التصوير المقطعي البصري أعلى معدل نمو سنوي مركب بنسبة 8.1٪ في السوق خلال فترة التنبؤ. يسمح التصوير المقطعي البصري بتقييم مستويات مختلفة من نقص تروية البقعة الصفراء التي لم يتم تشخيصها في التصوير الأولي. تُستخدم هذه التقنية كمعيار لوسائل التصوير للعيون.
رؤى تعتمد على المستخدم النهائي
بناءً على المستخدم النهائي، يتم تقسيم سوق أجهزة تصوير الشبكية العالمية إلى المستشفيات والعيادات والعيادات المتخصصة ومراكز الرعاية الخارجية وغيرها. استحوذ قطاع المستشفيات والعيادات على أكبر حصة من السوق في عام 2021 ومن المتوقع أن تسجل مراكز رعاية العيون المتخصصة أعلى معدل نمو سنوي مركب بنسبة 6.6٪ في السوق خلال الفترة المتوقعة.
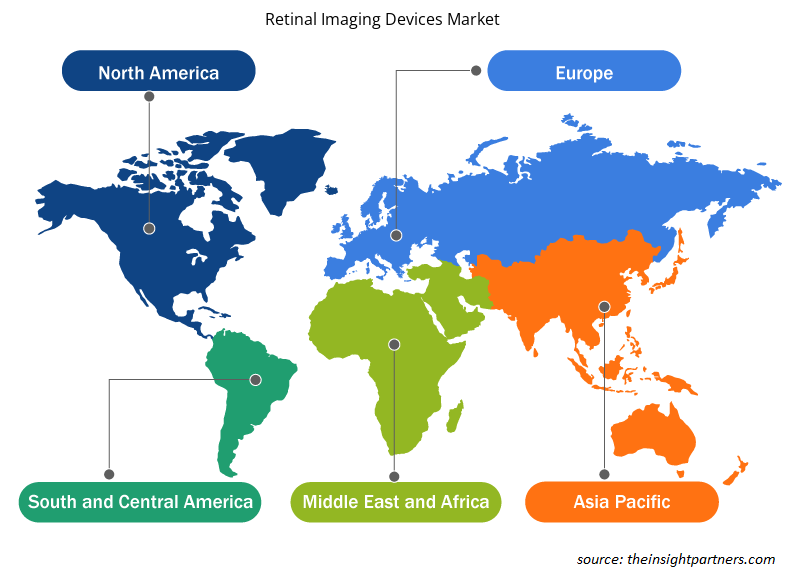
رؤى إقليمية حول سوق أجهزة تصوير الشبكية
لقد قام المحللون في Insight Partners بشرح الاتجاهات والعوامل الإقليمية المؤثرة على سوق أجهزة تصوير الشبكية طوال فترة التوقعات بشكل شامل. يناقش هذا القسم أيضًا قطاعات سوق أجهزة تصوير الشبكية والجغرافيا في جميع أنحاء أمريكا الشمالية وأوروبا ومنطقة آسيا والمحيط الهادئ والشرق الأوسط وأفريقيا وأمريكا الجنوبية والوسطى.
- احصل على البيانات الإقليمية المحددة لسوق أجهزة تصوير شبكية العين
نطاق تقرير سوق أجهزة تصوير الشبكية
| سمة التقرير | تفاصيل |
|---|---|
| حجم السوق في عام 2021 | 2.06 مليار دولار أمريكي |
| حجم السوق بحلول عام 2028 | 3 مليار دولار أمريكي |
| معدل النمو السنوي المركب العالمي (2021 - 2028) | 5.6% |
| البيانات التاريخية | 2019-2020 |
| فترة التنبؤ | 2022-2028 |
| القطاعات المغطاة | حسب نوع الجهاز
|
| المناطق والدول المغطاة | أمريكا الشمالية
|
| قادة السوق وملفات تعريف الشركات الرئيسية |
|
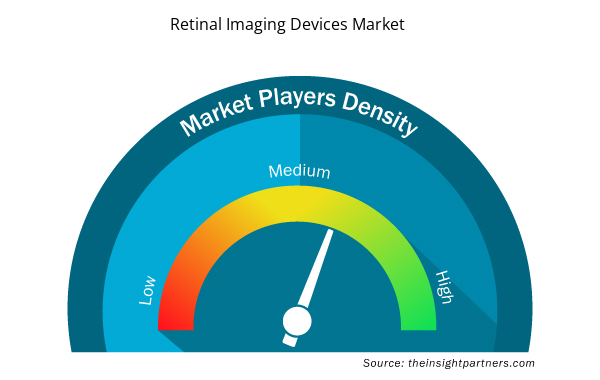
كثافة اللاعبين في سوق أجهزة تصوير شبكية العين: فهم تأثيرها على ديناميكيات الأعمال
يشهد سوق أجهزة تصوير الشبكية نموًا سريعًا، مدفوعًا بالطلب المتزايد من المستخدم النهائي بسبب عوامل مثل تفضيلات المستهلكين المتطورة والتقدم التكنولوجي والوعي المتزايد بفوائد المنتج. ومع ارتفاع الطلب، تعمل الشركات على توسيع عروضها والابتكار لتلبية احتياجات المستهلكين والاستفادة من الاتجاهات الناشئة، مما يؤدي إلى زيادة نمو السوق.
تشير كثافة اللاعبين في السوق إلى توزيع الشركات أو المؤسسات العاملة في سوق أو صناعة معينة. وهي تشير إلى عدد المنافسين (اللاعبين في السوق) الموجودين في مساحة سوق معينة نسبة إلى حجمها أو قيمتها السوقية الإجمالية.
الشركات الرئيسية العاملة في سوق أجهزة تصوير شبكية العين هي:
- كارل زايس ميديتك
- مجموعة ريفينيو
- شركة نيكون
- أوبتوميد
- شركة توبكون
إخلاء المسؤولية : الشركات المذكورة أعلاه ليست مرتبة بأي ترتيب معين.
- احصل على نظرة عامة على أهم اللاعبين الرئيسيين في سوق أجهزة تصوير شبكية العين
رؤى إقليمية
وبناءً على المناطق، استحوذت منطقة أمريكا الشمالية على الحصة الأكبر في عام 2021 ومن المتوقع أن تتبع اتجاهًا مماثلًا خلال الفترة المتوقعة. ومن المتوقع أن تشهد منطقة آسيا والمحيط الهادئ أعلى معدل نمو خلال الفترة المتوقعة. ومن المتوقع أن يساعد تطبيق الذكاء الاصطناعي ونظام التعلم العميق لتحسين تغطية الفحص في سنغافورة في النمو الإقليمي على مدى السنوات السبع المقبلة.
إن إطلاق المنتجات والحصول على الموافقات عليها هي استراتيجيات تتبناها الشركات عادة لتوسيع نطاق وجودها العالمي ومحافظ منتجاتها. وعلاوة على ذلك، يركز اللاعبون في سوق أجهزة التصوير الشبكي على استراتيجية الشراكة لتوسيع قاعدة عملائهم، الأمر الذي يسمح لهم بدوره بالحفاظ على اسم علامتهم التجارية في جميع أنحاء العالم.
بناءً على نوع الجهاز، يتم تصنيف سوق أجهزة تصوير الشبكية إلى تصوير الأوعية الدموية بالفلوريسين وكاميرا قاع العين والتصوير المقطعي البصري. بناءً على المستخدم النهائي، يتم تقسيم السوق إلى المستشفيات والعيادات ومراكز الجراحة الخارجية ومراكز رعاية العيون المتخصصة والمستخدمين النهائيين الآخرين. من حيث الجغرافيا، يتم تقسيم سوق أجهزة التصوير الشبكي إلى أمريكا الشمالية (الولايات المتحدة وكندا والمكسيك)، وأوروبا (المملكة المتحدة وألمانيا وفرنسا وإيطاليا وإسبانيا وبقية أوروبا)، وآسيا والمحيط الهادئ (الصين واليابان والهند وأستراليا وكوريا الجنوبية وبقية آسيا والمحيط الهادئ)، والشرق الأوسط وأفريقيا (الإمارات العربية المتحدة والمملكة العربية السعودية وجنوب أفريقيا وبقية الشرق الأوسط وأفريقيا)، وأمريكا الجنوبية والوسطى (البرازيل والأرجنتين وبقية أمريكا الجنوبية والوسطى). بعض ملفات تعريف الشركة المدرجة في نطاق بحثنا هي Carl Zeiss Meditec وRevenio Group Oyj وNikon Corporation وOptomed وTopcon Corporation وImagine Eyes وEpipole Ltd وForus Health Pvt Ltd وEynuk Inc وPhoenix Technology Group LLC وغيرها.

مرينال محللة أبحاث مخضرمة، تتمتع بخبرة تزيد عن 8 سنوات في مجال استخبارات واستشارات سوق علوم الحياة. بفضل عقليتها الاستراتيجية والتزامها الراسخ بالتميز، اكتسبت خبرة واسعة في التنبؤ بالصناعات الدوائية، وتقييم فرص السوق، وتطوير معايير الصناعة. يرتكز عملها على تقديم رؤى عملية تُمكّن العملاء من اتخاذ قرارات استراتيجية مدروسة.
تكمن قوة مرينال الأساسية في ترجمة مجموعات البيانات الكمية المعقدة إلى معلومات استخباراتية قيّمة. وتُعدّ براعتها التحليلية ركيزةً أساسيةً في صياغة استراتيجيات دخول السوق (GTM) واكتشاف فرص النمو في قطاعي الأدوية والأجهزة الطبية. وبصفتها مستشارةً موثوقةً، تُركز مرينال باستمرار على تبسيط إجراءات سير العمل وترسيخ أفضل الممارسات، مما يُعزز الابتكار والكفاءة التشغيلية لعملائها.
- التحليل التاريخي (سنتان)، سنة الأساس، التوقعات (7 سنوات) مع معدل النمو السنوي المركب
- تحليل PEST و SWOT
- حجم السوق والقيمة / الحجم - عالمي، إقليمي، بلد
- الصناعة والمنافسة
- مجموعة بيانات إكسل
التقارير الحديثة
شهادات العملاء
تقرير سوق أنظمة SCADA من Insight Partners شامل، ويقدم رؤى قيّمة حول الاتجاهات الحالية والتوقعات المستقبلية. تميّز الفريق باحترافية عالية وسرعة في الاستجابة ودعم مستمر طوال الوقت. نحن راضون جدًا ونوصي بشدة بخدماتهم.
ران كيديم شريك, شركة ريالي تكنولوجيز المحدودةطلبتُ تقريرًا عن سوق برمجيات محدد، وأعدّه الفريق في غضون أيام قليلة. كانت المعلومات ذات صلة وثيقة وعرضها جيد. ثم طلبتُ بعض التعديلات والإضافات على التقرير. وكان الفريق متجاوبًا للغاية، وحصلتُ على التقرير النهائي في أقل من أسبوع.
جان هيرفيه جين رئيس مجلس الإدارة, فيوتشر أناليتيكاعملنا مع شركة "إنسايت بارتنرز" لإجراء دراسة سوقية وتوقعات مهمة. زودونا برؤى واضحة حول الفرص والمخاطر، مما ساعدنا في صياغة خططنا. كانت أبحاثهم سهلة الاستخدام ومبنية على بيانات دقيقة، مما ساعدنا على اتخاذ قرارات ذكية وواثقة. نوصي بهم بشدة.
بيوش ناجبال نائب الرئيس الأول, شعاع عالي عالميقدّمت شركة Insight Partners أبحاثًا سوقية ثاقبة ومنظمة جيدًا بخبرة واسعة في هذا المجال. تميّز فريقهم بالاحترافية وسرعة الاستجابة طوال الوقت. وسهّل موقعهم الإلكتروني سهل الاستخدام الوصول إلى تقارير القطاع. نوصي بهم بشدة لخدمات بحثية موثوقة وعالية الجودة.
يوكيهيكو أداتشي المدير التنفيذي, ديب بلو، ذ.م.م.هذه أول مرة أشتري فيها تقرير سوق من The Insight Partners. رغم أنني كنت مترددًا في البداية، إلا أنني زرت موقعهم الإلكتروني وشعرت براحة أكبر للمخاطرة وشراء تقرير السوق. أنا راضٍ تمامًا عن جودة التقرير وخدمة العملاء. كانت لديّ عدة أسئلة وتعليقات حول التقرير الأولي، ولكن بعد بضع محادثات عبر البريد الإلكتروني مع محللهم، أعتقد أن لديّ تقريرًا يمكنني استخدامه كمدخل لعملية التخطيط الاستراتيجي لدينا. شكرًا جزيلاً لكم على تخصيص وقتكم الإضافي وجعل هذه التجربة إيجابية. سأوصي بخدماتكم للآخرين بالتأكيد، وستكونون أول من ألجأ إليه عندما نحتاج إلى المزيد من بيانات السوق.
جون سوزوكي الرئيس والرئيس التنفيذي وعضو مجلس الإدارة, بي كيه تكنولوجيزأود أن أقدّر دعمكم واحترافيتكم في الاستجابة لطلبي للحصول على معلومات بشأن سوق التشخيص المخبري للأمراض المعدية في نيجيريا. كما أُقدّر صبركم وتوجيهكم، واستعدادكم لتقديم خصم، مما مكّننا في النهاية من إتمام الصفقة. أتطلع إلى التعامل مع "ذا إنسايت بارتنرز" مستقبلًا، كل ذلك بفضل الانطباع الذي تركتموه لديّ نتيجةً لهذا اللقاء الأول.
الدكتور تشيجيوك أونيا المدير الإداري, شركة باينكريست للرعاية الصحية المحدودةسبب الشراء
- اتخاذ قرارات مدروسة
- فهم ديناميكيات السوق
- تحليل المنافسة
- رؤى العملاء
- توقعات السوق
- تخفيف المخاطر
- التخطيط الاستراتيجي
- مبررات الاستثمار
- تحديد الأسواق الناشئة
- تحسين استراتيجيات التسويق
- تعزيز الكفاءة التشغيلية
- مواكبة التوجهات التنظيمية


 احصل على عينة مجانية ل - سوق أجهزة تصوير الشبكية