استراتيجيات السوق لمحاكاة الطائرات بدون طيار، وأفضل اللاعبين، وفرص النمو، والتحليل والتنبؤ بحلول عام 2031
البيانات التاريخية : 2021-2022 | سنة الأساس : 2023 | فترة التنبؤ : 2024-2031حجم سوق محاكاة الطائرات بدون طيار وتوقعاته (2021-2031)، والحصة العالمية والإقليمية، والاتجاهات، وفرص النمو. يغطي التقرير: حسب المكون (الأجهزة والبرامج)، ونوع المحاكاة (ثابت ومحمول)، ونوع الطائرة بدون طيار (ذات الأجنحة الثابتة والدوارة)، والتكنولوجيا (الواقع المعزز والافتراضي)، والجغرافيا.
- تاريخ التقرير : Mar 2026
- رمز التقرير : TIPRE00006738
- الفئة : الفضاء والدفاع
- الحالة : البيانات الصادرة
- تنسيقات التقارير المتاحة :


- عدد الصفحات : 150
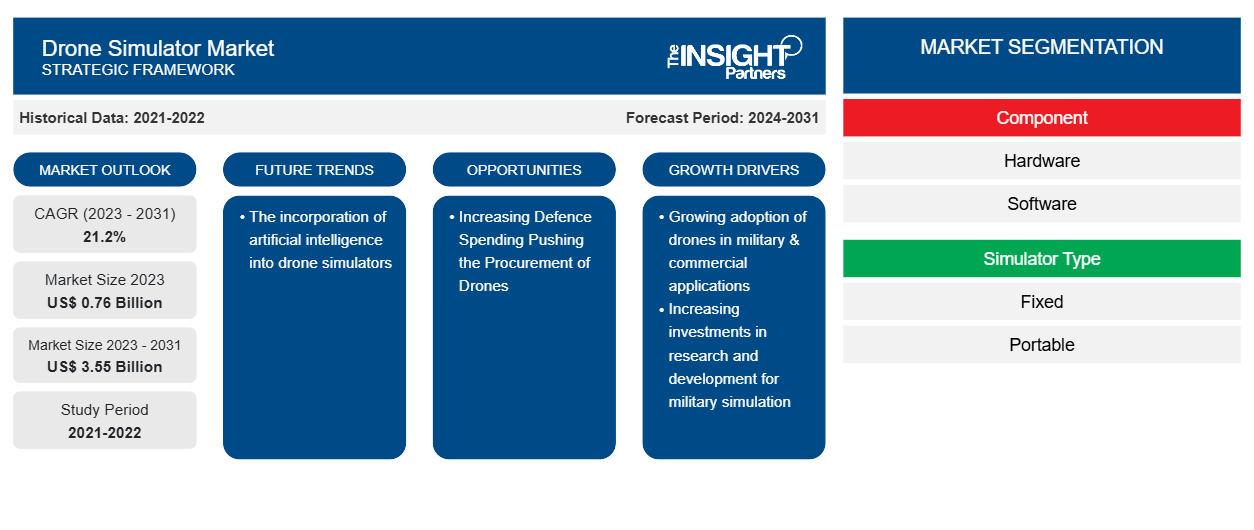
من المتوقع أن يصل حجم سوق محاكاة الطائرات بدون طيار إلى 3.55 مليار دولار أمريكي بحلول عام 2031 من 0.76 مليار دولار أمريكي في عام 2023. ومن المتوقع أن يسجل السوق معدل نمو سنوي مركب بنسبة 21.2٪ خلال الفترة 2023-2031. ومن المرجح أن يظل دمج الذكاء الاصطناعي اتجاهًا رئيسيًا في السوق.
تحليل سوق محاكاة الطائرات بدون طيار
تهيمن الشركات المصنعة الرائدة في الصناعة مثل Aegis Technologies و Leonardo Spa و General Atomics و Israel Aerospace Industries وغيرها على سوق أجهزة محاكاة الطائرات بدون طيار. الطلب على هذه الموصلات بين مصنعي الطائرات بدون طيار مرتفع بشكل غير مسبوق. إن وجود وصورة العلامة التجارية القوية للشركات المصنعة المعترف بها في الصناعة يحد من ظهور لاعبين جدد في السوق. بالإضافة إلى ذلك، تتطلب تصنيع أجهزة محاكاة الطائرات بدون طيار الالتزام بالعديد من المعايير التي وضعتها السلطات الحاكمة المعنية والحصول على ترخيص لتصنيع مثل هذه المنتجات هي عملية كثيفة رأس المال. مثل هذا المتطلب الضخم لرأس المال هو عامل آخر يقيد دخول اللاعبين الناشئين إلى هذه السوق.
نظرة عامة على سوق محاكاة الطائرات بدون طيار
أصحاب المصلحة الرئيسيون في سوق محاكاة الطائرات بدون طيار هم موردو المكونات وموفرو محاكيات الطائرات بدون طيار والمستخدمون النهائيون. يقدم البائعون الإلكترونيون مكونات إلكترونية مثل أجهزة الاستشعار والكاميرات والمكونات السلبية، من بين أمور أخرى، لموردي محاكيات الطائرات بدون طيار لإنتاج محاكي الطائرات بدون طيار (الأجهزة). قد يحصل المستخدمون النهائيون على محاكي طائرات بدون طيار لأنواع عديدة من الطائرات بدون طيار اعتمادًا على تطبيقها من موردي محاكيات الطائرات بدون طيار. يجب اتباع العديد من القواعد التنظيمية قبل إنتاج هذه المحاكيات. يمتلك مورد محاكيات الطائرات بدون طيار بشكل أساسي الكفاءة التكنولوجية لتزويد الصناعة العسكرية والفضائية بنظام محاكاة فعال وجدير بالثقة. أخيرًا، يستخدم المستخدمون النهائيون مثل المنظمات التجارية والعسكرية محاكي الطائرات بدون طيار لاختبار تطبيقات مختلفة.
قم بتخصيص هذا التقرير ليناسب متطلباتك
ستحصل على تخصيص لأي تقرير - مجانًا - بما في ذلك أجزاء من هذا التقرير، أو تحليل على مستوى الدولة، وحزمة بيانات Excel، بالإضافة إلى الاستفادة من العروض والخصومات الرائعة للشركات الناشئة والجامعات
سوق محاكاة الطائرات بدون طيار: رؤى استراتيجية
-
احصل على أهم اتجاهات السوق الرئيسية لهذا التقرير.ستتضمن هذه العينة المجانية تحليلاً للبيانات، بدءًا من اتجاهات السوق وحتى التقديرات والتوقعات.
محركات وفرص سوق محاكاة الطائرات بدون طيار
زيادة الاستثمارات في البحث والتطوير للمحاكاة العسكرية
إن الوزارات العسكرية في العديد من الدول تعمل على خفض نفقات التدريب وتقليص حجم قواتها. ونتيجة لذلك، تحول اهتمام الجيش نحو إيجاد حلول أقل تكلفة وأكثر فعالية لاحتياجاته. إن التدريب في الوقت الحقيقي يستغرق وقتًا طويلاً ومكلفًا. كما أنه يتطلب كمية هائلة من الموارد الخام، مثل البنزين والمتفجرات، ويتألف من مستوى عالٍ من الخطر. لذلك، تفضل الوزارات العسكرية بشكل متزايد التدريب الافتراضي والألعاب القائمة على المحاكاة التي تستخدم تقنيات، مثل البيانات الضخمة والذكاء الاصطناعي والحوسبة السحابية. أصبحت المحاكاة العسكرية والتدريب الافتراضي أكثر شعبية بين القوات العسكرية في جميع أنحاء العالم لأنها تستند إلى مكونات تجارية جاهزة (COTS)، وتساعد في تقليل نفقات التدريب. يتم تصنيع أجهزة المحاكاة بتكلفة تطوير ضئيلة. المعايير حاسمة للجيش للابتكار بشكل كبير في تكنولوجيا التدريب القائمة على المحاكاة. تُستخدم محاكاة الطائرات بدون طيار حاليًا لتدريب الجنود المستقبليين وتمثيل سيناريو في الوقت الفعلي باستخدام إعدادات رقمية واقعية. وبالتالي، فإن زيادة الإنفاق على برامج المحاكاة تدفع نمو سوق محاكاة الطائرات بدون طيار. علاوة على ذلك، تقوم وزارات الدفاع في العديد من الدول بإعادة هيكلة وتغيير جيوشها باستخدام حلول جديدة، وهو ما يعزز أيضًا نمو السوق.
زيادة الإنفاق الدفاعي تدفع إلى شراء الطائرات بدون طيار
إن التغيير السريع في الحروب الحديثة يحث الحكومات على تخصيص مبالغ أعلى للقوات العسكرية المعنية. تساعد الميزانية المخصصة للجيش القوات العسكرية على الانخراط في تطوير تقنيات محلية قوية وشراء الأسلحة المتقدمة والمركبات والمعدات الأخرى من الشركات المصنعة الدولية. هناك ارتفاع في اعتماد الأنظمة غير المأهولة بين معظم القوات العسكرية من أجل إبقاء الأفراد والمركبات جاهزة للمهمة. بهدف تحديث الجنود والمركبات، تستثمر وزارات الدفاع في جميع أنحاء العالم مبالغ كبيرة في التقنيات الأحدث، بما في ذلك أنظمة الطائرات بدون طيار. هذا العامل يعزز نمو سوق محاكاة الطائرات بدون طيار لتوفير تدريب الطائرات بدون طيار المشتراة بين القوات المسلحة. وفقًا لمعهد ستوكهولم الدولي لأبحاث السلام (SIPRI)، ارتفع الإنفاق العسكري العالمي إلى 2443 مليار دولار أمريكي في عام 2023، حيث شهد ارتفاعًا بنحو 13٪ مقارنة بعام 2022. تشمل الدول الرئيسية في عام 2023، والتي شكلت حوالي 60٪ من الإنفاق العالمي، الولايات المتحدة والصين والهند وروسيا والمملكة العربية السعودية. لقد عملت مثل هذه الاستثمارات على تعزيز المشتريات والطلبات على محاكيات الطائرات بدون طيار من مختلف البلدان في جميع أنحاء العالم مما يدفع نمو السوق بشكل أكبر.
تقرير تحليل تجزئة سوق محاكاة الطائرات بدون طيار
كانت القطاعات الرئيسية التي ساهمت في اشتقاق تحليل سوق جهاز محاكاة الطائرات بدون طيار هي المكون ونوع المحاكاة ونوع الطائرة بدون طيار والتكنولوجيا.
- بناءً على المكون، يتم تقسيم سوق محاكاة الطائرات بدون طيار إلى أجهزة وبرامج. احتل قطاع الأجهزة حصة سوقية أكبر في عام 2023.
- بناءً على نوع جهاز المحاكاة، يتم تقسيم سوق أجهزة محاكاة الطائرات بدون طيار إلى أجهزة ثابتة وأجهزة محمولة. احتلت شريحة الأجهزة الثابتة حصة سوقية أكبر في عام 2023.
- بناءً على نوع الطائرة بدون طيار، يتم تقسيم سوق محاكاة الطائرات بدون طيار إلى طائرات ذات أجنحة ثابتة وطائرات ذات أجنحة دوارة. احتلت شريحة الطائرات ذات الأجنحة الثابتة بالكامل حصة سوقية أكبر في عام 2023.
- استنادًا إلى التكنولوجيا، يتم تقسيم سوق محاكاة الطائرات بدون طيار إلى الواقع المعزز والواقع الافتراضي. احتل قطاع الواقع الافتراضي حصة سوقية أكبر في عام 2023.
تحليل حصة سوق محاكاة الطائرات بدون طيار حسب المنطقة الجغرافية
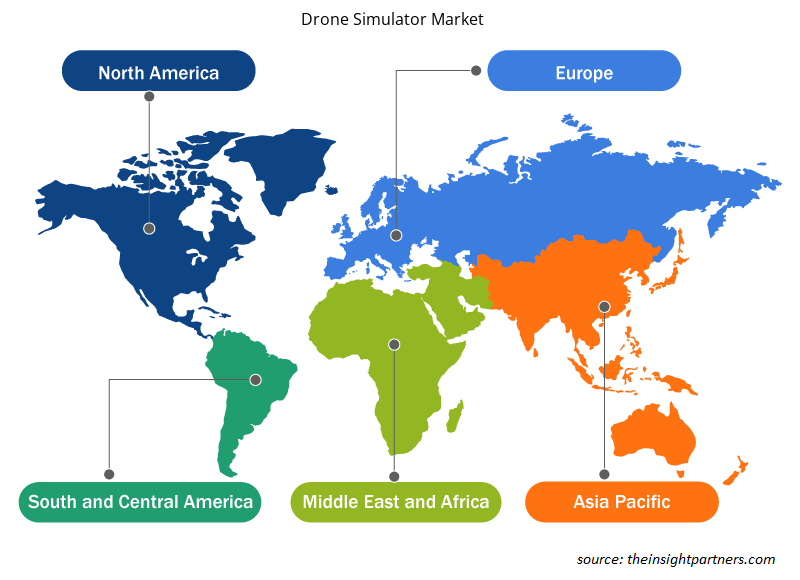
ينقسم النطاق الجغرافي لتقرير سوق محاكاة الطائرات بدون طيار بشكل أساسي إلى خمس مناطق: أمريكا الشمالية وأوروبا وآسيا والمحيط الهادئ والشرق الأوسط وأفريقيا وأمريكا الجنوبية.
سيطرت أمريكا الشمالية على السوق في عام 2023 تليها مناطق أوروبا وآسيا والمحيط الهادئ. علاوة على ذلك، من المرجح أن تشهد منطقة آسيا والمحيط الهادئ أيضًا أعلى معدل نمو سنوي مركب في السنوات القادمة. سيطرت الولايات المتحدة على سوق محاكاة الطائرات بدون طيار في أمريكا الشمالية في عام 2023. يرجع النمو في سوق محاكاة الطائرات بدون طيار في الولايات المتحدة إلى استخدام الطائرات بدون طيار في التطبيقات العسكرية والتجارية. تستخدم القوات العسكرية الأمريكية الطائرات بدون طيار للوعي الظرفي. يوفر الوعي الظرفي معلومات في الوقت الفعلي حول مواقع العدو والتضاريس والطقس والمتغيرات المتغيرة الأخرى. تساعد الطائرات بدون طيار في الحصول على معلومات حول مواقع القوات في منطقة الحرب لاتخاذ قرارات أفضل. بعد انتهاء الحرب، تُستخدم الطائرات بدون طيار في تحليل أضرار تقييم المعركة. وأيضًا، مع زيادة الإنفاق الدفاعي الأمريكي، زاد تنفيذ الطائرات بدون طيار. على سبيل المثال، أنفقت الولايات المتحدة حوالي 916 مليار دولار أمريكي على إنفاقها العسكري في عام 2023 والذي شهد نموًا بنحو 4.6٪ مقارنة بنفقات عام 2022 التي كانت حوالي 876 مليار دولار أمريكي. كانت مثل هذه العوامل تدفع إلى اعتماد سوق محاكاة الطائرات بدون طيار.
رؤى إقليمية حول سوق محاكاة الطائرات بدون طيار
لقد قام المحللون في Insight Partners بشرح الاتجاهات والعوامل الإقليمية المؤثرة على سوق محاكاة الطائرات بدون طيار طوال فترة التوقعات بشكل شامل. يناقش هذا القسم أيضًا قطاعات سوق محاكاة الطائرات بدون طيار والجغرافيا في جميع أنحاء أمريكا الشمالية وأوروبا ومنطقة آسيا والمحيط الهادئ والشرق الأوسط وأفريقيا وأمريكا الجنوبية والوسطى.
- احصل على البيانات الإقليمية المحددة لسوق محاكاة الطائرات بدون طيار
نطاق تقرير سوق محاكاة الطائرات بدون طيار
| سمة التقرير | تفاصيل |
|---|---|
| حجم السوق في عام 2023 | 0.76 مليار دولار أمريكي |
| حجم السوق بحلول عام 2031 | 3.55 مليار دولار أمريكي |
| معدل النمو السنوي المركب العالمي (2023 - 2031) | 21.2% |
| البيانات التاريخية | 2021-2022 |
| فترة التنبؤ | 2024-2031 |
| القطاعات المغطاة |
حسب المكون
|
| المناطق والدول المغطاة |
أمريكا الشمالية
|
| قادة السوق وملفات تعريف الشركات الرئيسية |
|
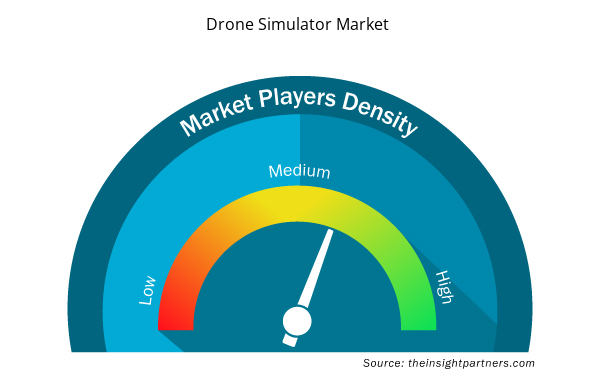
كثافة اللاعبين في سوق محاكاة الطائرات بدون طيار: فهم تأثيرها على ديناميكيات الأعمال
يشهد سوق محاكاة الطائرات بدون طيار نموًا سريعًا، مدفوعًا بالطلب المتزايد من المستخدم النهائي بسبب عوامل مثل تفضيلات المستهلك المتطورة والتقدم التكنولوجي والوعي المتزايد بفوائد المنتج. ومع ارتفاع الطلب، تعمل الشركات على توسيع عروضها والابتكار لتلبية احتياجات المستهلكين والاستفادة من الاتجاهات الناشئة، مما يؤدي إلى زيادة نمو السوق.
تشير كثافة اللاعبين في السوق إلى توزيع الشركات أو المؤسسات العاملة في سوق أو صناعة معينة. وهي تشير إلى عدد المنافسين (اللاعبين في السوق) الموجودين في مساحة سوق معينة نسبة إلى حجمها أو قيمتها السوقية الإجمالية.
الشركات الرئيسية العاملة في سوق محاكاة الطائرات بدون طيار هي:
- ايجيس تكنولوجيز
- شركة سي ايه اي
- الذرات العامة
- شركة هافيلسان
- شركة الصناعات الجوية الإسرائيلية المحدودة
- تدريب ومحاكاة L3 Link
إخلاء المسؤولية : الشركات المذكورة أعلاه ليست مرتبة بأي ترتيب معين.
- احصل على نظرة عامة على أهم اللاعبين الرئيسيين في سوق محاكاة الطائرات بدون طيار
أخبار سوق محاكاة الطائرات بدون طيار والتطورات الأخيرة
يتم تقييم سوق محاكاة الطائرات بدون طيار من خلال جمع البيانات النوعية والكمية بعد البحث الأولي والثانوي، والتي تتضمن منشورات الشركات المهمة وبيانات الجمعيات وقواعد البيانات. فيما يلي بعض التطورات في سوق محاكاة الطائرات بدون طيار:
- أعلنت شركة CAE أنها توصلت إلى اتفاق رسمي مع شركة L3Harris Technologies (NYSE: LHX) لشراء أعمال التدريب العسكري لشركة L3Harris مقابل 1.05 مليار دولار أمريكي ("الاستحواذ")، مع مراعاة التعديلات العادية. تبلغ قيمة الاستحواذ حوالي 13.5 ضعف الأرباح المعدلة المقدرة لشركة L3Harris للتدريب العسكري لعام 2020، أو حوالي 10 أضعاف عند احتساب التآزر في التكاليف، والتي من المتوقع أن تصل إلى نطاق يتراوح بين 35 إلى 45 مليون دولار كندي (حوالي 28 إلى 35 مليون دولار أمريكي) سنويًا بحلول نهاية العام الثاني بعد إغلاق الاستحواذ. (المصدر: CAE Inc، بيان صحفي، 2021)
- ستتيح شركة الصناعات الجوية الإسرائيلية (IAI) للحكومات والأكاديميات ومعاهد التعليم العالي والمؤسسات من جميع أنحاء العالم الفرصة لتعلم كيفية الدفاع عن نفسها ضد التهديدات السيبرانية من خلال منصة خدمة الحوسبة السحابية Azure من Microsoft . لأغراض التدريب، توفر منصة التدريب السيبراني TAME RANGE بيئة تعليمية واقعية وتفاعلية تحاكي التهديدات الحقيقية. (المصدر: شركة الصناعات الجوية الإسرائيلية، بيان صحفي، 2021)
تقرير سوق محاكاة الطائرات بدون طيار والتغطية والنتائج المتوقعة
يوفر تقرير "حجم سوق محاكاة الطائرات بدون طيار والتوقعات (2021-2031)" تحليلاً مفصلاً للسوق يغطي المجالات التالية:
- حجم سوق محاكاة الطائرات بدون طيار وتوقعاته على المستويات العالمية والإقليمية والوطنية لجميع قطاعات السوق الرئيسية التي يغطيها النطاق
- اتجاهات سوق محاكاة الطائرات بدون طيار بالإضافة إلى ديناميكيات السوق مثل السائقين والقيود والفرص الرئيسية
- تحليل مفصل لقوى بورتر الخمس
- تحليل سوق محاكاة الطائرات بدون طيار يغطي اتجاهات السوق الرئيسية والإطار العالمي والإقليمي واللاعبين الرئيسيين واللوائح والتطورات الأخيرة في السوق
- تحليل المشهد الصناعي والمنافسة الذي يغطي تركيز السوق، وتحليل خريطة الحرارة، واللاعبين البارزين، والتطورات الأخيرة لسوق محاكاة الطائرات بدون طيار
- ملفات تعريف الشركة التفصيلية

نافين خبيرٌ متمرسٌ في أبحاث السوق والاستشارات، يتمتع بخبرةٍ تزيد عن 9 سنوات في مشاريع مُخصصة ومُشتركة واستشارية. يشغل حاليًا منصب نائب الرئيس المساعد، وقد نجح في إدارة أصحاب المصلحة عبر سلسلة قيمة المشاريع، وألّف أكثر من 100 تقرير بحثي وأكثر من 30 مهمة استشارية. يمتد نطاق عمله ليشمل مشاريع صناعية وحكومية، مساهمًا بشكل كبير في نجاح العملاء واتخاذ القرارات القائمة على البيانات.
نافين حاصلٌ على شهادة في هندسة الإلكترونيات والاتصالات من جامعة فرجينيا التقنية، كارناتاكا، وشهادة ماجستير في إدارة الأعمال في التسويق والعمليات من جامعة مانيبال. وهو عضوٌ نشطٌ في معهد مهندسي الكهرباء والإلكترونيات (IEEE) لمدة 9 سنوات، حيث شارك في مؤتمراتٍ وندواتٍ تقنية، وتطوّع على مستوى الأقسام والمناطق. قبل منصبه الحالي، عمل مستشارًا استراتيجيًا مساعدًا في IndustryARC، ومستشارًا للخوادم الصناعية في شركة هيوليت باكارد (HP Global).
- التحليل التاريخي (سنتان)، سنة الأساس، التوقعات (7 سنوات) مع معدل النمو السنوي المركب
- تحليل PEST و SWOT
- حجم السوق والقيمة / الحجم - عالمي، إقليمي، بلد
- الصناعة والمنافسة
- مجموعة بيانات إكسل
التقارير الحديثة
تقارير ذات صلة
شهادات العملاء
تقرير سوق أنظمة SCADA من Insight Partners شامل، ويقدم رؤى قيّمة حول الاتجاهات الحالية والتوقعات المستقبلية. تميّز الفريق باحترافية عالية وسرعة في الاستجابة ودعم مستمر طوال الوقت. نحن راضون جدًا ونوصي بشدة بخدماتهم.
ران كيديم شريك, شركة ريالي تكنولوجيز المحدودةطلبتُ تقريرًا عن سوق برمجيات محدد، وأعدّه الفريق في غضون أيام قليلة. كانت المعلومات ذات صلة وثيقة وعرضها جيد. ثم طلبتُ بعض التعديلات والإضافات على التقرير. وكان الفريق متجاوبًا للغاية، وحصلتُ على التقرير النهائي في أقل من أسبوع.
جان هيرفيه جين رئيس مجلس الإدارة, فيوتشر أناليتيكاعملنا مع شركة "إنسايت بارتنرز" لإجراء دراسة سوقية وتوقعات مهمة. زودونا برؤى واضحة حول الفرص والمخاطر، مما ساعدنا في صياغة خططنا. كانت أبحاثهم سهلة الاستخدام ومبنية على بيانات دقيقة، مما ساعدنا على اتخاذ قرارات ذكية وواثقة. نوصي بهم بشدة.
بيوش ناجبال نائب الرئيس الأول, شعاع عالي عالميقدّمت شركة Insight Partners أبحاثًا سوقية ثاقبة ومنظمة جيدًا بخبرة واسعة في هذا المجال. تميّز فريقهم بالاحترافية وسرعة الاستجابة طوال الوقت. وسهّل موقعهم الإلكتروني سهل الاستخدام الوصول إلى تقارير القطاع. نوصي بهم بشدة لخدمات بحثية موثوقة وعالية الجودة.
يوكيهيكو أداتشي المدير التنفيذي, ديب بلو، ذ.م.م.هذه أول مرة أشتري فيها تقرير سوق من The Insight Partners. رغم أنني كنت مترددًا في البداية، إلا أنني زرت موقعهم الإلكتروني وشعرت براحة أكبر للمخاطرة وشراء تقرير السوق. أنا راضٍ تمامًا عن جودة التقرير وخدمة العملاء. كانت لديّ عدة أسئلة وتعليقات حول التقرير الأولي، ولكن بعد بضع محادثات عبر البريد الإلكتروني مع محللهم، أعتقد أن لديّ تقريرًا يمكنني استخدامه كمدخل لعملية التخطيط الاستراتيجي لدينا. شكرًا جزيلاً لكم على تخصيص وقتكم الإضافي وجعل هذه التجربة إيجابية. سأوصي بخدماتكم للآخرين بالتأكيد، وستكونون أول من ألجأ إليه عندما نحتاج إلى المزيد من بيانات السوق.
جون سوزوكي الرئيس والرئيس التنفيذي وعضو مجلس الإدارة, بي كيه تكنولوجيزأود أن أقدّر دعمكم واحترافيتكم في الاستجابة لطلبي للحصول على معلومات بشأن سوق التشخيص المخبري للأمراض المعدية في نيجيريا. كما أُقدّر صبركم وتوجيهكم، واستعدادكم لتقديم خصم، مما مكّننا في النهاية من إتمام الصفقة. أتطلع إلى التعامل مع "ذا إنسايت بارتنرز" مستقبلًا، كل ذلك بفضل الانطباع الذي تركتموه لديّ نتيجةً لهذا اللقاء الأول.
الدكتور تشيجيوك أونيا المدير الإداري, شركة باينكريست للرعاية الصحية المحدودةسبب الشراء
- اتخاذ قرارات مدروسة
- فهم ديناميكيات السوق
- تحليل المنافسة
- رؤى العملاء
- توقعات السوق
- تخفيف المخاطر
- التخطيط الاستراتيجي
- مبررات الاستثمار
- تحديد الأسواق الناشئة
- تحسين استراتيجيات التسويق
- تعزيز الكفاءة التشغيلية
- مواكبة التوجهات التنظيمية


 احصل على عينة مجانية ل - سوق محاكاة الطائرات بدون طيار