استراتيجيات سوق الفواتير الإلكترونية، وأفضل اللاعبين، وفرص النمو، والتحليل والتنبؤ بحلول عام 2031
البيانات التاريخية : 2021-2022 | سنة الأساس : 2023 | فترة التنبؤ : 2024-2031حجم سوق الفوترة الإلكترونية وتوقعاته (2021-2031)، والحصة العالمية والإقليمية، والاتجاهات، وفرص النمو. يغطي التقرير: حسب النشر (محليًا، سحابيًا)، المستخدم النهائي (قطاع التجزئة والتجارة الإلكترونية، الحكومة، تكنولوجيا المعلومات والاتصالات، قطاع الخدمات المالية والمصرفية والتأمين، وغيرها)، التطبيق (بين الشركات، بين الشركات والمستهلكين، بين الشركات والحكومات)، النوع (فواتير غير فواتير الشراء، فواتير الشراء)، والمناطق الجغرافية (أمريكا الشمالية، أوروبا، آسيا والمحيط الهادئ، الشرق الأوسط وأفريقيا، أمريكا الجنوبية والوسطى).
- تاريخ التقرير : May 2024
- رمز التقرير : TIPRE00009392
- الفئة : التكنولوجيا والإعلام والاتصالات
- الحالة : نُشرت
- تنسيقات التقارير المتاحة :


- عدد الصفحات : 179
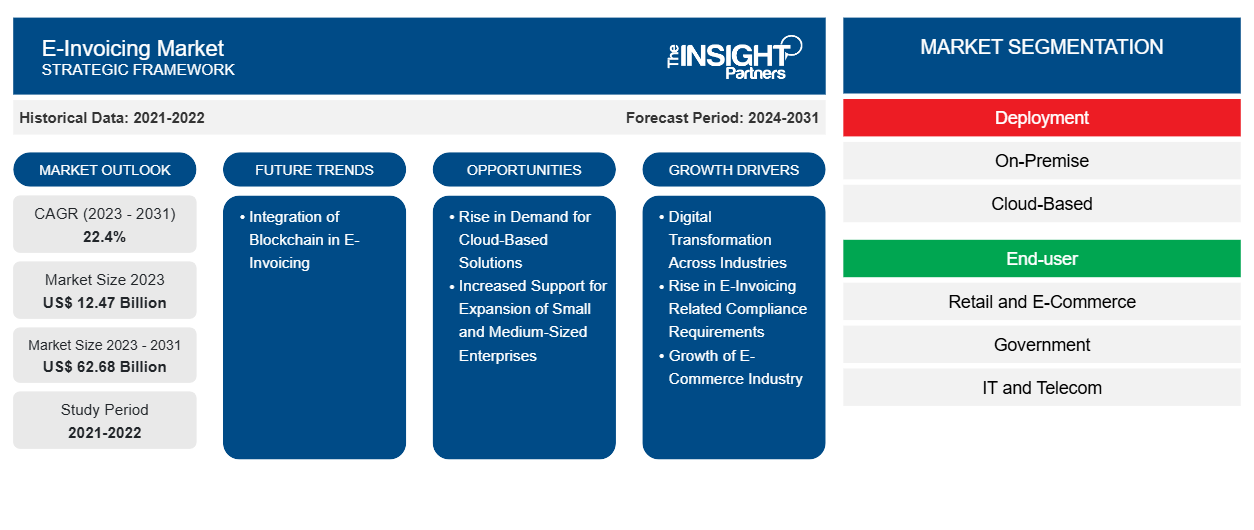
من المتوقع أن يصل حجم سوق الفواتير الإلكترونية إلى 62.68 مليار دولار أمريكي بحلول عام 2031 من 12.47 مليار دولار أمريكي في عام 2023. ومن المتوقع أن يسجل السوق معدل نمو سنوي مركب بنسبة 22.4٪ في الفترة 2023-2031.
يتضمن التقرير آفاق النمو في ضوء اتجاهات سوق الفوترة الإلكترونية الحالية والعوامل المحركة التي تؤثر على نمو السوق.
تحليل سوق الفواتير الإلكترونية
إن الطلب المتزايد على الحلول الرقمية لمكافحة التهرب الضريبي والاحتيال المالي بين المنظمات الحكومية والسلطات الضريبية يدفع النمو في تفويضات الفوترة الإلكترونية في مختلف البلدان. تلعب المبادرات الداعمة المختلفة التي اتخذتها المنظمات الحكومية والجمعيات، مثل جمعية مقدمي خدمات الفوترة الإلكترونية الأوروبية (EESPA)، وCEN، وUN/CEFACT، وOpenPEPPOL، وGS1، دورًا حاسمًا في دفع تطوير معايير/أطر/تنسيقات الفوترة الإلكترونية وتبني الفوترة الإلكترونية في جميع البلدان. من حيث اعتماد الفوترة الإلكترونية، تعد البرازيل وتشيلي والمكسيك من رواد السوق، تليها دول مثل إيطاليا، التي فرضت الفوترة الإلكترونية في عام 2019. إن التنفيذ الناجح للفوترة الإلكترونية في هذه البلدان وفوائدها يدفع دولًا أخرى، مثل بوليفيا وفرنسا وكولومبيا وغواتيمالا والصين والهند وقيرغيزستان وأوزبكستان وفيتنام وكرواتيا وإستونيا وصربيا والبرتغال، إلى تنفيذ تفويضات الفوترة الإلكترونية.
نظرة عامة على سوق الفواتير الإلكترونية
تعد الفواتير الإلكترونية سوقًا متنامية مع زيادة التبني في مختلف القطاعات مثل الأعمال إلى الأعمال (B2B)، والأعمال إلى العملاء (B2C)، والأعمال إلى الحكومة (B2G). تشير الفواتير الإلكترونية حصريًا إلى تبادل الفواتير الإلكترونية بين المشترين والموردين. تحدد البلدان المختلفة الفواتير الإلكترونية بشكل مختلف بناءً على اللوائح وطبيعة الأعمال السائدة في بلدان معينة. لتبادل الفواتير الإلكترونية، يتم استخدام نماذج مختلفة عبر الصناعات، مثل نموذج المورد المباشر، ونموذج المشتري المباشر، ونموذج SaaS / PaaS، ونموذج الشبكة، ونموذج الزوايا الأربع، ونموذج السحابة المتعددة، ونموذج السحابة الهجينة. تقوم المنظمات في جميع أنحاء العالم إما بتبادل الفواتير الإلكترونية مباشرة مع عملائها أو استخدام موفري خدمات تابعين لجهات خارجية. إن الاتجاه المتزايد لرقمنة المستندات المختلفة من أجل المعالجة الفعالة ومتطلبات الامتثال يعزز الانتقال من الفواتير الورقية اليدوية إلى الفواتير الإلكترونية على نطاق عالمي.
قم بتخصيص هذا التقرير ليناسب متطلباتك
ستحصل على تخصيص لأي تقرير - مجانًا - بما في ذلك أجزاء من هذا التقرير، أو تحليل على مستوى الدولة، وحزمة بيانات Excel، بالإضافة إلى الاستفادة من العروض والخصومات الرائعة للشركات الناشئة والجامعات
سوق الفواتير الإلكترونية: رؤى استراتيجية
- احصل على أهم اتجاهات السوق الرئيسية لهذا التقرير.ستتضمن هذه العينة المجانية تحليلاً للبيانات، بدءًا من اتجاهات السوق وحتى التقديرات والتوقعات.
محركات وفرص سوق الفوترة الإلكترونية
التحول الرقمي عبر الصناعات لصالح السوق
- تعمل التقنيات الرقمية على تحويل الصناعات في جميع أنحاء العالم وإحداث ثورة في عمليات الأعمال من أجل تعزيز الكفاءة التشغيلية وخفض التكاليف. تستثمر كل من الشركات الكبيرة والصغيرة في مختلف التقنيات الرقمية مثل تطبيقات الويب والحوسبة السحابية والذكاء الاصطناعي وإنترنت الأشياء والتحليلات التنبؤية والبيانات الضخمة.
- تتمتع التحولات الرقمية وأتمتة العمليات بالقدرة على خلق فرص لا مثيل لها للشركات لخلق المزيد من القيمة وزيادة الإيرادات. بالإضافة إلى ذلك، تساعد المبادرات الحكومية مثل الهند الرقمية، واستراتيجية الحكومة الرقمية (الولايات المتحدة)، والاستراتيجية الرقمية 2025 (ألمانيا) في جلب الرقمنة إلى البلاد، مما يؤدي إلى تبنيها من قبل العديد من اللاعبين في السوق عبر مختلف الصناعات لتحسين الكفاءة التشغيلية.
- تعد الفواتير وظيفة رئيسية في جميع قطاعات الأعمال، بما في ذلك B2B وB2C وB2G، والتي تتطلب عددًا كبيرًا من الموارد من حيث القوى العاملة والوقت والمعدات. يتم إنشاء مليارات الفواتير في جميع أنحاء العالم يوميًا، وجزء بسيط فقط من هذا في شكل فواتير إلكترونية. وبالتالي، هناك إمكانات هائلة لنمو سوق الفواتير الإلكترونية في السنوات القادمة. تؤدي عملية إنشاء الفواتير اليدوية والورقية الحالية إلى أخطاء بشرية وتقلل من الإنتاجية الإجمالية للشركة. مع اعتماد الفواتير الإلكترونية، يمكن للشركات توفير تكاليف كبيرة تتعلق بإنشاء الفواتير وإرسالها إلى العملاء النهائيين.
- ستؤدي أتمتة عملية الفوترة من خلال الفوترة الإلكترونية إلى تحقيق فوائد استراتيجية وتشغيلية مختلفة للمشترين والموردين والمديرين. وتشمل هذه الفوائد خفض التكاليف وزيادة الدقة وتسريع المدفوعات وتعزيز الإنتاجية والفوائد البيئية وتحسين إدارة النقد وتحسين الامتثال.
ارتفاع الطلب على الحلول المستندة إلى السحابة
- أصبحت الحوسبة السحابية بمثابة القوة الدافعة للتحول الرقمي عبر الصناعات. ويتزايد الطلب على الحلول المستندة إلى السحابة عبر الشركات بمعدل غير مسبوق بسبب المزايا التي توفرها هذه الحلول مقارنة بالنشر المحلي. وتشمل المزايا الرئيسية للحلول المستندة إلى السحابة سهولة النشر والتشغيل البيني وتوفير التكاليف والكفاءة العالية والميزات عند الطلب.
- تشهد الخدمات مثل البنية الأساسية كخدمة (IaaS) والبرمجيات كخدمة (SaaS) نموًا سريعًا. ومع ذلك، يختلف تبني الحلول المستندة إلى السحابة عبر المناطق الجغرافية والشركات اعتمادًا على عوامل مثل البيئة التنظيمية والسيناريوهات التنافسية.
- الطلب على الحلول المستندة إلى السحابة مرتفع في الشركات الصغيرة والمتوسطة نظرًا للفوائد المرتبطة بالتكلفة المرتبطة بهذه الحلول. لا تزال معظم المؤسسات الكبيرة تستخدم الحلول المحلية حيث أن تنفيذ العمليات الجديدة عبر المؤسسات الكبيرة وشبكاتها يعد مهمة معقدة وتتطلب تغييرات في ممارسات العمل التقليدية.
تقرير تحليل تجزئة سوق الفواتير الإلكترونية
إن القطاعات الرئيسية التي ساهمت في استخلاص تحليل سوق الفواتير الإلكترونية هي النشر والمستخدم النهائي والتطبيق والنوع.
- من خلال نموذج النشر، يتم تقسيم سوق الفوترة الإلكترونية إلى سحابية ومحلية. في عام 2023، احتفظ قطاع السحابة بحصة سوقية أكبر في الفوترة الإلكترونية بسبب مزايا مثل سهولة التنفيذ وتوفير التكاليف والمرونة التشغيلية.
- بناءً على المستخدم النهائي، يتم تقسيم السوق إلى قطاعات البيع بالتجزئة والتجارة الإلكترونية والحكومة وتكنولوجيا المعلومات والاتصالات والخدمات المصرفية والمالية والتأمين وغيرها. احتل قطاع الحكومة أكبر حصة في سوق الفواتير الإلكترونية في عام 2023.
- بناءً على النوع، يتم تقسيم سوق الفواتير الإلكترونية إلى فواتير طلب الشراء وفواتير غير طلب الشراء. في عام 2023، هيمنت شريحة الفواتير غير طلب الشراء على السوق بحصة سوقية أكبر ومن المتوقع أن تسجل معدل نمو سنوي مركب أعلى خلال فترة التوقعات.
- بناءً على التطبيق، يتم تصنيف سوق الفواتير الإلكترونية إلى B2B وB2C وB2G. احتل قطاع B2G الحصة الأكبر في سوق الفواتير الإلكترونية العالمية، ومن المتوقع أن يكون قطاع B2B هو القطاع الأسرع نموًا خلال فترة التوقعات.
تحليل حصة سوق الفواتير الإلكترونية حسب المنطقة الجغرافية
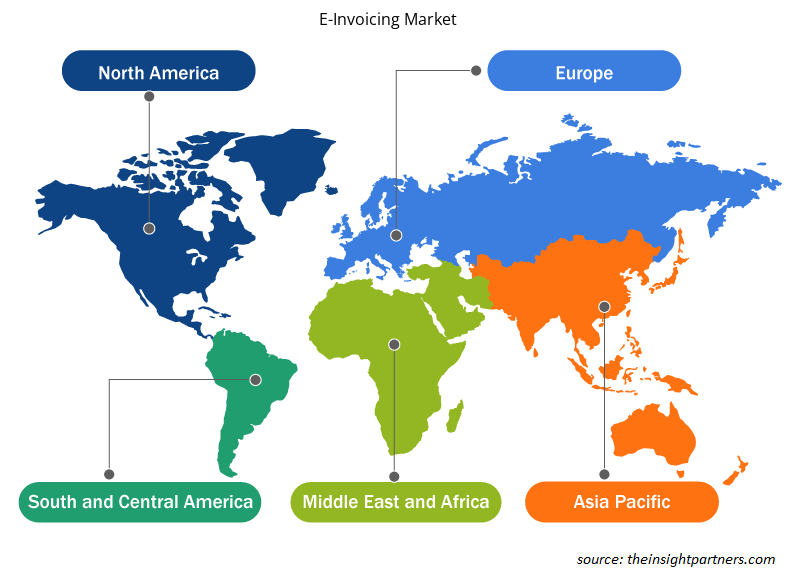
- تم تقسيم سوق الفواتير الإلكترونية إلى خمس مناطق رئيسية - أمريكا الشمالية وأوروبا وآسيا والمحيط الهادئ والشرق الأوسط وأفريقيا وأمريكا الجنوبية والوسطى. احتلت أمريكا الشمالية أكبر حصة في سوق الفواتير الإلكترونية في عام 2023. من حيث حصة السوق، احتلت أوروبا وأمريكا الجنوبية والوسطى ومنطقة آسيا والمحيط الهادئ المرتبة الثانية والثالثة والرابعة على التوالي في عام 2023.
- وتشكل أوروبا سوقاً أخرى بالغة الأهمية للفوترة الإلكترونية. ومؤخراً، أصبحت إيطاليا أول دولة في أوروبا تفرض الفوترة الإلكترونية لمكافحة الاحتيال الضريبي والتهرب الضريبي، فضلاً عن زيادة كفاءة النظام الضريبي. ومن المتوقع أيضاً أن تحذو دول أوروبية أخرى حذو إيطاليا وتتبنى الفوترة الإلكترونية، وهو ما من شأنه أن يعزز السوق بشكل إيجابي.
رؤى إقليمية حول سوق الفواتير الإلكترونية
لقد قام المحللون في Insight Partners بشرح الاتجاهات والعوامل الإقليمية المؤثرة على سوق الفواتير الإلكترونية طوال فترة التوقعات بشكل شامل. يناقش هذا القسم أيضًا قطاعات سوق الفواتير الإلكترونية والجغرافيا في جميع أنحاء أمريكا الشمالية وأوروبا ومنطقة آسيا والمحيط الهادئ والشرق الأوسط وأفريقيا وأمريكا الجنوبية والوسطى.
- احصل على البيانات الإقليمية المحددة لسوق الفواتير الإلكترونية
نطاق تقرير سوق الفواتير الإلكترونية
| سمة التقرير | تفاصيل |
|---|---|
| حجم السوق في عام 2023 | 12.47 مليار دولار أمريكي |
| حجم السوق بحلول عام 2031 | 62.68 مليار دولار أمريكي |
| معدل النمو السنوي المركب العالمي (2023 - 2031) | 22.4% |
| البيانات التاريخية | 2021-2022 |
| فترة التنبؤ | 2024-2031 |
| القطاعات المغطاة | حسب النشر
|
| المناطق والدول المغطاة | أمريكا الشمالية
|
| قادة السوق وملفات تعريف الشركات الرئيسية |
|
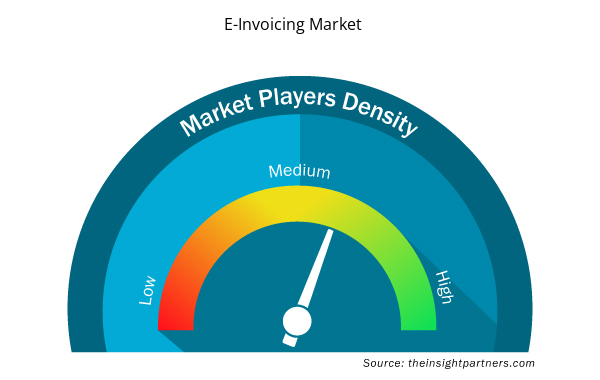
كثافة اللاعبين في سوق الفواتير الإلكترونية: فهم تأثيرها على ديناميكيات الأعمال
يشهد سوق الفواتير الإلكترونية نموًا سريعًا، مدفوعًا بالطلب المتزايد من جانب المستخدم النهائي بسبب عوامل مثل تفضيلات المستهلكين المتطورة والتقدم التكنولوجي والوعي المتزايد بفوائد المنتج. ومع ارتفاع الطلب، تعمل الشركات على توسيع عروضها والابتكار لتلبية احتياجات المستهلكين والاستفادة من الاتجاهات الناشئة، مما يؤدي إلى زيادة نمو السوق.
تشير كثافة اللاعبين في السوق إلى توزيع الشركات أو المؤسسات العاملة في سوق أو صناعة معينة. وهي تشير إلى عدد المنافسين (اللاعبين في السوق) الموجودين في مساحة سوق معينة نسبة إلى حجمها أو قيمتها السوقية الإجمالية.
الشركات الرئيسية العاملة في سوق الفواتير الإلكترونية هي:
- شركة سيجيديم
- مجموعة سيج المحدودة
- كومارتش إس إيه
- شركة نيبندو المحدودة
- تغيير التجارة
- ترانسبتا ذ.م.م
إخلاء المسؤولية : الشركات المذكورة أعلاه ليست مرتبة بأي ترتيب معين.
- احصل على نظرة عامة على أهم اللاعبين الرئيسيين في سوق الفواتير الإلكترونية
أخبار سوق الفواتير الإلكترونية والتطورات الأخيرة
يتم تقييم سوق الفوترة الإلكترونية من خلال جمع البيانات النوعية والكمية بعد البحث الأولي والثانوي، والتي تتضمن منشورات الشركات المهمة وبيانات الجمعيات وقواعد البيانات. فيما يلي قائمة بالتطورات في سوق الفوترة الإلكترونية:
- في عام 2021، أعلنت شركة Coupa Software، إحدى الشركات الرائدة في مجال إدارة الإنفاق التجاري (BSM)، أنها أصبحت عضوًا رسميًا في جمعية ترويج الفواتير الإلكترونية (EIPA)، وهي منظمة تعمل على تطوير وإثبات وتعزيز المواصفات القياسية للفواتير الإلكترونية. (المصدر: Coupa Software، بيان صحفي)
- في عام 2024، أعلنت Basware، الشركة العالمية الرائدة في مجال أتمتة الحسابات الدائنة ومعالجة الفواتير، عن خطط توسع عالمية كبرى مع ارتفاع الحجوزات بنسبة 52% وتسارع نمو الإيرادات المتكررة على أساس سنوي في عام 2023. (المصدر: Sweco AB، بيان صحفي)
- في عام 2023، وقعت شركة Toyota Boshoku Asia عقدًا مع شركة Comarch لتنفيذ الفوترة الإلكترونية في تايلاند. وستدعم شركة Comarch شركة Toyota Boshoku Asia في إعداد حل الفوترة الإلكترونية لإعداد وتسليم وتخزين المستندات الرقمية، مع التوقيعات الرقمية للفواتير والإيصالات الضريبية التي تتوافق مع شروط ومتطلبات إدارة الإيرادات في تايلاند. (المصدر: Toyota Boshoku، بيان صحفي)
تقرير سوق الفوترة الإلكترونية: التغطية والنتائج المتوقعة
يوفر "حجم سوق الفواتير الإلكترونية والتوقعات (2022-2030)" تحليلاً مفصلاً للسوق يغطي المجالات المذكورة أدناه:
- حجم السوق والتوقعات على المستويات العالمية والإقليمية والوطنية لجميع قطاعات السوق الرئيسية التي يغطيها النطاق
- ديناميكيات السوق مثل المحركات والقيود والفرص الرئيسية
- الاتجاهات المستقبلية الرئيسية
- تحليل مفصل لقوى PEST/Porter الخمس وSWOT
- تحليل السوق العالمي والإقليمي الذي يغطي اتجاهات السوق الرئيسية واللاعبين الرئيسيين واللوائح والتطورات الأخيرة في السوق
- تحليل المشهد الصناعي والمنافسة الذي يغطي تركيز السوق، وتحليل خريطة الحرارة، واللاعبين البارزين، والتطورات الأخيرة
- ملفات تعريف الشركة التفصيلية

أنكيتا خبيرة ديناميكية في أبحاث السوق والاستشارات، تتمتع بخبرة تزيد عن 8 سنوات في قطاعات التكنولوجيا والإعلام وتكنولوجيا المعلومات والاتصالات والإلكترونيات وأشباه الموصلات. وقد قادت ونفذت بنجاح أكثر من 100 مهمة استشارية وبحثية لعملاء عالميين مثل مايكروسوفت وأوراكل وشركة NEC وSAP وKPMG وExpeditors International. تشمل كفاءاتها الأساسية تقييم السوق، وتحليل البيانات، والتنبؤ، وصياغة الاستراتيجيات، والاستخبارات التنافسية، وكتابة التقارير.
أنكيتا بارعة في إدارة دورات المشاريع الكاملة، بدءًا من تصميم عروض ما قبل البيع ومناقشات العملاء، وصولًا إلى تقديم رؤى عملية بعد البيع. كما أنها ماهرة في إدارة فرق متعددة الوظائف، وهيكلة وحدات بحثية معقدة، ومواءمة الحلول مع أهداف العمل الخاصة بالعملاء. وقد مكنتها مهاراتها الممتازة في التواصل والقيادة والعرض التقديمي من تحقيق نتائج قيّمة باستمرار في بيئات سوقية سريعة التطور.
- التحليل التاريخي (سنتان)، سنة الأساس، التوقعات (7 سنوات) مع معدل النمو السنوي المركب
- تحليل PEST و SWOT
- حجم السوق والقيمة / الحجم - عالمي، إقليمي، بلد
- الصناعة والمنافسة
- مجموعة بيانات إكسل
التقارير الحديثة
شهادات العملاء
تقرير سوق أنظمة SCADA من Insight Partners شامل، ويقدم رؤى قيّمة حول الاتجاهات الحالية والتوقعات المستقبلية. تميّز الفريق باحترافية عالية وسرعة في الاستجابة ودعم مستمر طوال الوقت. نحن راضون جدًا ونوصي بشدة بخدماتهم.
ران كيديم شريك, شركة ريالي تكنولوجيز المحدودةطلبتُ تقريرًا عن سوق برمجيات محدد، وأعدّه الفريق في غضون أيام قليلة. كانت المعلومات ذات صلة وثيقة وعرضها جيد. ثم طلبتُ بعض التعديلات والإضافات على التقرير. وكان الفريق متجاوبًا للغاية، وحصلتُ على التقرير النهائي في أقل من أسبوع.
جان هيرفيه جين رئيس مجلس الإدارة, فيوتشر أناليتيكاعملنا مع شركة "إنسايت بارتنرز" لإجراء دراسة سوقية وتوقعات مهمة. زودونا برؤى واضحة حول الفرص والمخاطر، مما ساعدنا في صياغة خططنا. كانت أبحاثهم سهلة الاستخدام ومبنية على بيانات دقيقة، مما ساعدنا على اتخاذ قرارات ذكية وواثقة. نوصي بهم بشدة.
بيوش ناجبال نائب الرئيس الأول, شعاع عالي عالميقدّمت شركة Insight Partners أبحاثًا سوقية ثاقبة ومنظمة جيدًا بخبرة واسعة في هذا المجال. تميّز فريقهم بالاحترافية وسرعة الاستجابة طوال الوقت. وسهّل موقعهم الإلكتروني سهل الاستخدام الوصول إلى تقارير القطاع. نوصي بهم بشدة لخدمات بحثية موثوقة وعالية الجودة.
يوكيهيكو أداتشي المدير التنفيذي, ديب بلو، ذ.م.م.هذه أول مرة أشتري فيها تقرير سوق من The Insight Partners. رغم أنني كنت مترددًا في البداية، إلا أنني زرت موقعهم الإلكتروني وشعرت براحة أكبر للمخاطرة وشراء تقرير السوق. أنا راضٍ تمامًا عن جودة التقرير وخدمة العملاء. كانت لديّ عدة أسئلة وتعليقات حول التقرير الأولي، ولكن بعد بضع محادثات عبر البريد الإلكتروني مع محللهم، أعتقد أن لديّ تقريرًا يمكنني استخدامه كمدخل لعملية التخطيط الاستراتيجي لدينا. شكرًا جزيلاً لكم على تخصيص وقتكم الإضافي وجعل هذه التجربة إيجابية. سأوصي بخدماتكم للآخرين بالتأكيد، وستكونون أول من ألجأ إليه عندما نحتاج إلى المزيد من بيانات السوق.
جون سوزوكي الرئيس والرئيس التنفيذي وعضو مجلس الإدارة, بي كيه تكنولوجيزأود أن أقدّر دعمكم واحترافيتكم في الاستجابة لطلبي للحصول على معلومات بشأن سوق التشخيص المخبري للأمراض المعدية في نيجيريا. كما أُقدّر صبركم وتوجيهكم، واستعدادكم لتقديم خصم، مما مكّننا في النهاية من إتمام الصفقة. أتطلع إلى التعامل مع "ذا إنسايت بارتنرز" مستقبلًا، كل ذلك بفضل الانطباع الذي تركتموه لديّ نتيجةً لهذا اللقاء الأول.
الدكتور تشيجيوك أونيا المدير الإداري, شركة باينكريست للرعاية الصحية المحدودةسبب الشراء
- اتخاذ قرارات مدروسة
- فهم ديناميكيات السوق
- تحليل المنافسة
- رؤى العملاء
- توقعات السوق
- تخفيف المخاطر
- التخطيط الاستراتيجي
- مبررات الاستثمار
- تحديد الأسواق الناشئة
- تحسين استراتيجيات التسويق
- تعزيز الكفاءة التشغيلية
- مواكبة التوجهات التنظيمية


 احصل على عينة مجانية ل - سوق الفواتير الإلكترونية