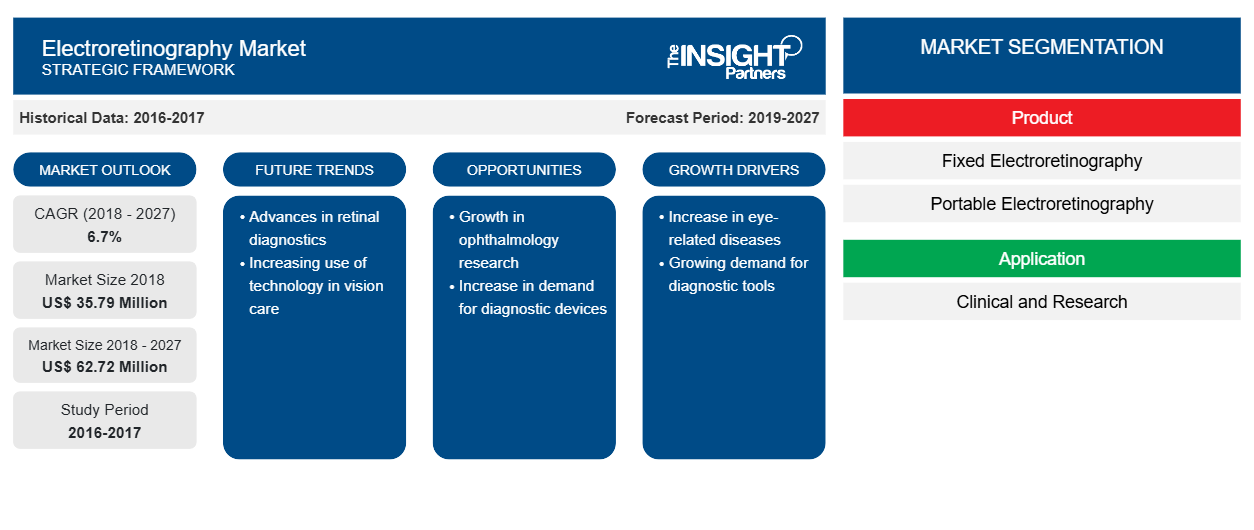
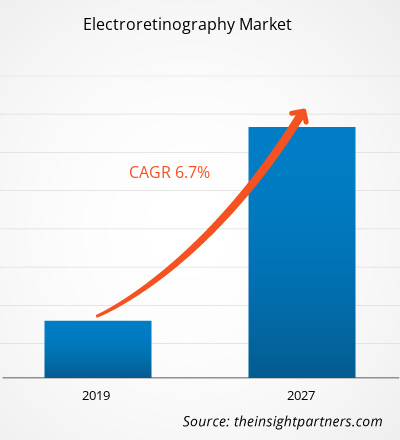
بلغت قيمة سوق تخطيط كهربية الشبكية 35.79 مليون دولار أمريكي في عام 2018 ومن المتوقع أن تصل إلى 62.72 مليون دولار أمريكي في عام 2027؛ ومن المتوقع أن تنمو بمعدل نمو سنوي مركب قدره 6.7٪ من عام 2019 إلى عام 2027.
تخطيط كهربية الشبكية (ERG) هو اختبار تشخيصي يستخدم لقياس الاستجابة الكهربائية للخلايا الحساسة للضوء مثل المخاريط والقضبان الموجودة في العين. يستخدم تخطيط كهربية الشبكية للكشف عن اضطرابات العين مثل التهاب الشبكية الصباغي، والتنكس البقعي، وورم الشبكية، والجلوكوما، وكذلك اعتلال الشبكية السكري. بالمقارنة مع طرق فحص العين الأخرى، يقدم تخطيط كهربية الشبكية نتائج أفضل بالإضافة إلى أنه يسبب إزعاجًا أقل للمرضى، وبالتالي فهو مفضل على نطاق واسع لتشخيص وعلاج اضطرابات العين المختلفة. يُعزى نمو سوق تخطيط كهربية الشبكية العالمي إلى انتشار الجلوكوما المتزايد بين الأفراد، وزيادة حالات اضطرابات العين في الاقتصادات المتقدمة وتزايد عدد السكان المسنين في جميع أنحاء العالم. ومع ذلك، فإن المخاطر المرتبطة بتخطيط كهربية الشبكية هي العامل الرئيسي الذي يعيق نمو السوق.
من المتوقع أن يشهد سوق تخطيط كهربية الشبكية العالمي نموًا كبيرًا بعد الوباء. لقد أثرت جائحة كوفيد-19 على الاقتصادات والصناعات في مختلف البلدان بسبب عمليات الإغلاق وحظر السفر وإغلاق الشركات. لقد أثقلت أزمة كوفيد-19 كاهل أنظمة الصحة العامة في العديد من البلدان وسلطت الضوء على الحاجة القوية للاستثمار المستدام في أنظمة الصحة. مع تقدم جائحة كوفيد-19، من المتوقع أن تشهد صناعة الرعاية الصحية انخفاضًا في النمو. يزدهر قطاع العلوم الحيوية بسبب زيادة الطلب على منتجات التشخيص المختبري وأنشطة البحث والتطوير المتزايدة في جميع أنحاء العالم. ومع ذلك، يشهد قطاع التقنيات الطبية والتصوير انخفاضًا في المبيعات بسبب عدد أقل من العمليات الجراحية التي يتم إجراؤها وتأخير أو إطالة شراء المعدات. بالإضافة إلى ذلك، من المتوقع أن تصبح الاستشارات الافتراضية من قبل المتخصصين في الرعاية الصحية نموذج تقديم الرعاية السائد بعد الوباء. مع تحويل الرعاية الصحية عن بعد، ستستمر الصحة الرقمية في الازدهار في السنوات القادمة. بالإضافة إلى ذلك، من المتوقع أيضًا أن تمهد التجارب السريرية المعطلة والتأخير اللاحق في إطلاق الأدوية الطريق للتجارب الافتراضية بالكامل في المستقبل. ومن المتوقع ظهور تقنيات جديدة مثل mRNA وتغيير صناعة الأدوية، ومن المتوقع أيضًا أن يشهد السوق المزيد من التكامل الرأسي والمشاريع المشتركة في السنوات القادمة.
قم بتخصيص هذا التقرير ليناسب متطلباتك
ستحصل على تخصيص لأي تقرير - مجانًا - بما في ذلك أجزاء من هذا التقرير، أو تحليل على مستوى الدولة، وحزمة بيانات Excel، بالإضافة إلى الاستفادة من العروض والخصومات الرائعة للشركات الناشئة والجامعات
سوق تخطيط كهربية الشبكية:
- احصل على أهم اتجاهات السوق الرئيسية لهذا التقرير.ستتضمن هذه العينة المجانية تحليلاً للبيانات، بدءًا من اتجاهات السوق وحتى التقديرات والتوقعات.
رؤى السوق
ارتفاع معدل انتشار الجلوكوما بين الأفراد من شأنه أن يدفع نمو سوق تخطيط كهربية الشبكية العالمي
الجلوكوما هو مرض يتلف العصب البصري للعين. تحدث هذه الحالة عندما تمتلئ طبقة من السوائل على الجانب الخارجي من العين، مما يخلق ضغطًا وبالتالي يؤدي إلى تلف العصب البصري. غالبًا ما يؤدي الجلوكوما إلى فقدان البصر، مما يؤدي في النهاية إلى العمى. تقدر منظمة الصحة العالمية أن 4.5 مليون شخص في جميع أنحاء العالم مصابون بالعمى بسبب الجلوكوما. في الولايات المتحدة، حوالي 120.000 شخص مصابون بالعمى بسبب الجلوكوما، وهو ما يمثل 9٪ إلى 12٪ من جميع حالات العمى. يشمل السكان الأكثر عرضة لفقدان البصر بسبب الجلوكوما السكان الذين تزيد أعمارهم عن 60 عامًا. ومع ذلك، إذا تم اكتشافه وعلاجه في مرحلة مبكرة، يمكن للمرء تجنب فقدان البصر. يقدر انتشار الجلوكوما الموحد حسب العمر في جميع أنحاء العالم في السكان الذين تتراوح أعمارهم بين 40 عامًا وما فوق بحوالي 3.5٪.
ينقسم الجلوكوما إلى نوعين: الجلوكوما ذات الزاوية المفتوحة والجلوكوما ذات الزاوية المغلقة. الجلوكوما ذات الزاوية المفتوحة هي الشكل الأكثر شيوعًا وتدل عليها عوامل خطر مختلفة مثل الأصل العرقي الأفريقي جنوب الصحراء الكبرى وارتفاع ضغط العين والتقدم في السن والتاريخ العائلي الإيجابي وقصر النظر الشديد. في حين أن عوامل خطر الجلوكوما ذات الزاوية المغلقة تشمل الأصل العرقي في شرق آسيا وطول النظر والتقدم في السن.
وفقًا لمؤسسة أبحاث الجلوكوما، يوجد حاليًا حوالي 3 ملايين شخص مصاب بالجلوكوما في الولايات المتحدة. ومن المتوقع أن يصل العدد إلى 4.2 مليون بحلول عام 2030، مع زيادة بنسبة 58 بالمائة تقريبًا، وفقًا للتوقعات الصادرة عن المعهد الوطني للعيون. علاوة على ذلك، بين السكان من أصل أفريقي وأمريكا اللاتينية، يعد الجلوكوما أكثر انتشارًا، حيث يكون أكثر شيوعًا بنحو 6 إلى 8 مرات بين الأمريكيين من أصل أفريقي مقارنة بالسكان القوقازيين.
تعتبر تقنية تخطيط كهربية الشبكية النمطية (PERG) طريقة فعّالة للكشف المبكر عن الجلوكوما وعلاجها. وتوفر تقنية تخطيط كهربية الشبكية النمطية بعض المزايا مقارنة بالاختبارات الأخرى التي تُستخدم بشكل روتيني لتشخيص ومراقبة مرضى الجلوكوما. وعلى وجه الخصوص، تتمتع تقنية تخطيط كهربية الشبكية النمطية بالقدرة على اكتشاف الشذوذ الوظيفي في وقت مبكر جدًا من المرض - في بعض الحالات ربما قبل ثماني سنوات من اختباراتنا الأخرى. وتتميز اختبارات تخطيط كهربية الشبكية النمطية بالحساسية بطبيعتها وبالتالي تسمح بالكشف المبكر عن الشذوذ، وبالتالي تجنب موت الخلايا العقدية الشبكية (RGC) في الوقت المناسب. ومن المتوقع أن يؤدي ارتفاع حالات العمى بسبب الجلوكوما وقدرة تخطيط كهربية الشبكية النمطية على تمكين الكشف بشكل أفضل إلى دفع السوق بشكل كبير خلال السنوات القادمة.
رؤى قائمة على المنتج
من حيث المنتج، يتم تقسيم سوق تخطيط كهربية الشبكية العالمي إلى تخطيط كهربية الشبكية الثابت وتخطيط كهربية الشبكية المحمول. في عام 2018، احتل قطاع تخطيط كهربية الشبكية الثابت الحصة الأكبر من السوق. ومع ذلك، من المتوقع أن يسجل قطاع تخطيط كهربية الشبكية المحمول أعلى معدل نمو سنوي مركب خلال فترة التوقعات.
رؤى قائمة على التطبيق
بناءً على التطبيق، يتم تقسيم سوق تخطيط كهربية الشبكية العالمي إلى قسمين: السريري والبحثي. احتل القسم السريري الحصة الأكبر في السوق في عام 2018. كما يُقدر أن ينمو نفس القسم بأعلى معدل نمو سنوي مركب خلال الفترة المتوقعة.
يتبنى اللاعبون العالميون في سوق تخطيط كهربية الشبكية استراتيجيات إطلاق المنتجات وتوسيع نطاقها لتلبية متطلبات العملاء المتغيرة في جميع أنحاء العالم، مما يسمح لهم أيضًا بالحفاظ على اسم علامتهم التجارية عالميًا.
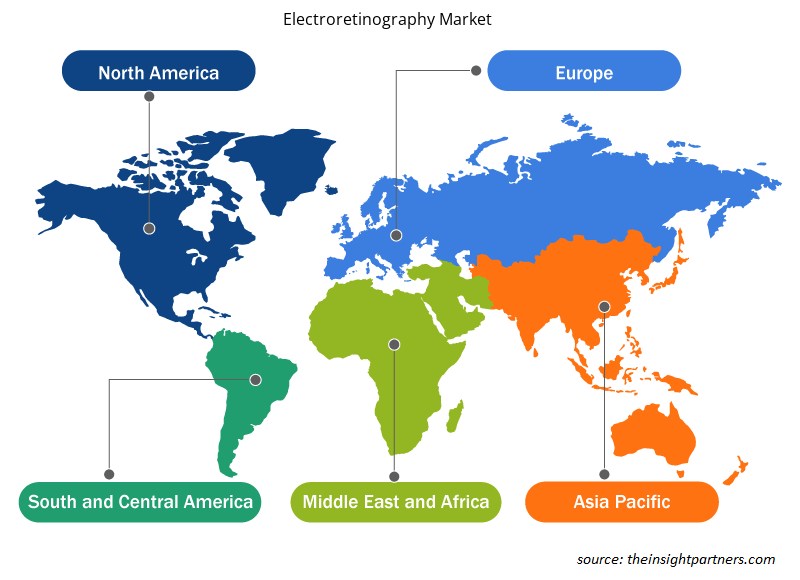
رؤى إقليمية حول سوق تخطيط كهربية الشبكية
لقد قام المحللون في Insight Partners بشرح الاتجاهات والعوامل الإقليمية المؤثرة على سوق تخطيط كهربية الشبكية طوال فترة التوقعات بشكل شامل. يناقش هذا القسم أيضًا قطاعات سوق تخطيط كهربية الشبكية والجغرافيا في جميع أنحاء أمريكا الشمالية وأوروبا ومنطقة آسيا والمحيط الهادئ والشرق الأوسط وأفريقيا وأمريكا الجنوبية والوسطى.
- احصل على البيانات الإقليمية المحددة لسوق تخطيط كهربية الشبكية
نطاق تقرير سوق تخطيط كهربية الشبكية
| سمة التقرير | تفاصيل |
|---|---|
| حجم السوق في عام 2018 | 35.79 مليون دولار أمريكي |
| حجم السوق بحلول عام 2027 | 62.72 مليون دولار أمريكي |
| معدل النمو السنوي المركب العالمي (2018 - 2027) | 6.7% |
| البيانات التاريخية | 2016-2017 |
| فترة التنبؤ | 2019-2027 |
| القطاعات المغطاة | حسب المنتج
|
| المناطق والدول المغطاة | أمريكا الشمالية
|
| قادة السوق وملفات تعريف الشركات الرئيسية |
|
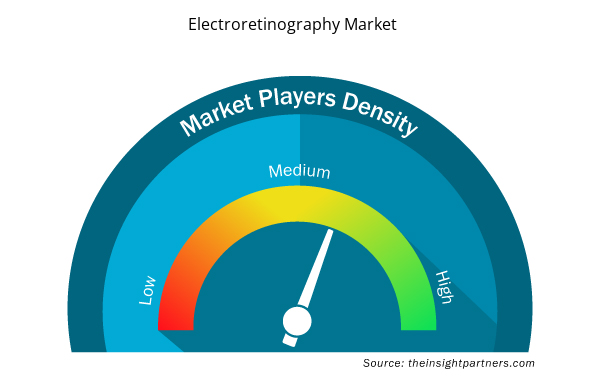
كثافة اللاعبين في سوق تخطيط كهربية الشبكية: فهم تأثيرها على ديناميكيات الأعمال
يشهد سوق تخطيط كهربية الشبكية نموًا سريعًا، مدفوعًا بالطلب المتزايد من المستخدم النهائي بسبب عوامل مثل تفضيلات المستهلكين المتطورة والتقدم التكنولوجي والوعي المتزايد بفوائد المنتج. ومع ارتفاع الطلب، تعمل الشركات على توسيع عروضها والابتكار لتلبية احتياجات المستهلكين والاستفادة من الاتجاهات الناشئة، مما يؤدي إلى زيادة نمو السوق.
تشير كثافة اللاعبين في السوق إلى توزيع الشركات أو المؤسسات العاملة في سوق أو صناعة معينة. وهي تشير إلى عدد المنافسين (اللاعبين في السوق) الموجودين في مساحة سوق معينة نسبة إلى حجمها أو قيمتها السوقية الإجمالية.
الشركات الرئيسية العاملة في سوق تخطيط كهربية الشبكية هي:
- شركة إل كيه سي للتكنولوجيا
- شركة دياجنوسيس ذ.م.م
- التصوير التشخيصي الكهربائي، المحدودة
- شركة ديوبسيس
- شركة رولاند كونسلت ستاش آند فينجر المحدودة
إخلاء المسؤولية : الشركات المذكورة أعلاه ليست مرتبة بأي ترتيب معين.
- احصل على نظرة عامة على أهم اللاعبين الرئيسيين في سوق تخطيط كهربية الشبكية
السوق العالمية لتخطيط كهربية الشبكية – حسب المنتج
- تخطيط كهربية الشبكية الثابت
- تخطيط كهربية الشبكية المحمول
السوق العالمية لتخطيط كهربية الشبكية – حسب التطبيق
- سريري
- بحث
السوق العالمية لتخطيط كهربية الشبكية – حسب المنطقة الجغرافية
أمريكا الشمالية
- نحن
- كندا
- المكسيك
أوروبا
- فرنسا
- ألمانيا
- إيطاليا
- المملكة المتحدة
- إسبانيا
- بقية أوروبا
آسيا والمحيط الهادئ (APAC)
- الصين
- الهند
- كوريا الجنوبية
- اليابان
- أستراليا
- بقية منطقة آسيا والمحيط الهادئ
الشرق الأوسط وأفريقيا
- جنوب أفريقيا
- المملكة العربية السعودية
- الامارات العربية المتحدة
- باقي منطقة الشرق الأوسط وأفريقيا
أمريكا الجنوبية وأمريكا الوسطى (SCAM)
- البرازيل
- الأرجنتين
- بقية الاحتيال
نبذة عن الشركة
- شركة إل كيه سي للتكنولوجيا
- شركة دياجنوسيس ذ.م.م
- التصوير التشخيصي الكهربائي، المحدودة
- شركة ديوبسيس
- شركة رولاند كونسلت ستاش آند فينجر المحدودة
- ميتروفيجن
- تكلفة أدوات Oftalmici
- كونان ميديكال يو إس إيه، المحدودة
- ويلش ألين
- التحليل التاريخي (سنتان)، السنة الأساسية، التوقعات (7 سنوات) مع معدل النمو السنوي المركب
- تحليل PEST و SWOT
- حجم السوق والقيمة / الحجم - عالميًا وإقليميًا وقطريًا
- الصناعة والمنافسة
- مجموعة بيانات Excel


Report Coverage
Revenue forecast, Company Analysis, Industry landscape, Growth factors, and Trends

Segment Covered
This text is related
to segments covered.

Regional Scope
North America, Europe, Asia Pacific, Middle East & Africa, South & Central America

Country Scope
This text is related
to country scope.
The List of Companies
- LKC Technologies, Inc
- Diagnosys LLC
- Electro-Diagnostic Imaging, Inc.
- Diopsys, Inc.
- Roland Consult Stasche & Finger GmbH
- Metrovision
- Costruzione Strumenti Oftalmici
- Konan Medical USA, Inc.
- Welch Allyn
The Insight Partners performs research in 4 major stages: Data Collection & Secondary Research, Primary Research, Data Analysis and Data Triangulation & Final Review.
- Data Collection and Secondary Research:
As a market research and consulting firm operating from a decade, we have published and advised several client across the globe. First step for any study will start with an assessment of currently available data and insights from existing reports. Further, historical and current market information is collected from Investor Presentations, Annual Reports, SEC Filings, etc., and other information related to company’s performance and market positioning are gathered from Paid Databases (Factiva, Hoovers, and Reuters) and various other publications available in public domain.
Several associations trade associates, technical forums, institutes, societies and organization are accessed to gain technical as well as market related insights through their publications such as research papers, blogs and press releases related to the studies are referred to get cues about the market. Further, white papers, journals, magazines, and other news articles published in last 3 years are scrutinized and analyzed to understand the current market trends.
- Primary Research:
The primarily interview analysis comprise of data obtained from industry participants interview and answers to survey questions gathered by in-house primary team.
For primary research, interviews are conducted with industry experts/CEOs/Marketing Managers/VPs/Subject Matter Experts from both demand and supply side to get a 360-degree view of the market. The primary team conducts several interviews based on the complexity of the markets to understand the various market trends and dynamics which makes research more credible and precise.
A typical research interview fulfils the following functions:
- Provides first-hand information on the market size, market trends, growth trends, competitive landscape, and outlook
- Validates and strengthens in-house secondary research findings
- Develops the analysis team’s expertise and market understanding
Primary research involves email interactions and telephone interviews for each market, category, segment, and sub-segment across geographies. The participants who typically take part in such a process include, but are not limited to:
- Industry participants: VPs, business development managers, market intelligence managers and national sales managers
- Outside experts: Valuation experts, research analysts and key opinion leaders specializing in the electronics and semiconductor industry.
Below is the breakup of our primary respondents by company, designation, and region:

Once we receive the confirmation from primary research sources or primary respondents, we finalize the base year market estimation and forecast the data as per the macroeconomic and microeconomic factors assessed during data collection.
- Data Analysis:
Once data is validated through both secondary as well as primary respondents, we finalize the market estimations by hypothesis formulation and factor analysis at regional and country level.
- Macro-Economic Factor Analysis:
We analyse macroeconomic indicators such the gross domestic product (GDP), increase in the demand for goods and services across industries, technological advancement, regional economic growth, governmental policies, the influence of COVID-19, PEST analysis, and other aspects. This analysis aids in setting benchmarks for various nations/regions and approximating market splits. Additionally, the general trend of the aforementioned components aid in determining the market's development possibilities.
- Country Level Data:
Various factors that are especially aligned to the country are taken into account to determine the market size for a certain area and country, including the presence of vendors, such as headquarters and offices, the country's GDP, demand patterns, and industry growth. To comprehend the market dynamics for the nation, a number of growth variables, inhibitors, application areas, and current market trends are researched. The aforementioned elements aid in determining the country's overall market's growth potential.
- Company Profile:
The “Table of Contents” is formulated by listing and analyzing more than 25 - 30 companies operating in the market ecosystem across geographies. However, we profile only 10 companies as a standard practice in our syndicate reports. These 10 companies comprise leading, emerging, and regional players. Nonetheless, our analysis is not restricted to the 10 listed companies, we also analyze other companies present in the market to develop a holistic view and understand the prevailing trends. The “Company Profiles” section in the report covers key facts, business description, products & services, financial information, SWOT analysis, and key developments. The financial information presented is extracted from the annual reports and official documents of the publicly listed companies. Upon collecting the information for the sections of respective companies, we verify them via various primary sources and then compile the data in respective company profiles. The company level information helps us in deriving the base number as well as in forecasting the market size.
- Developing Base Number:
Aggregation of sales statistics (2020-2022) and macro-economic factor, and other secondary and primary research insights are utilized to arrive at base number and related market shares for 2022. The data gaps are identified in this step and relevant market data is analyzed, collected from paid primary interviews or databases. On finalizing the base year market size, forecasts are developed on the basis of macro-economic, industry and market growth factors and company level analysis.
- Data Triangulation and Final Review:
The market findings and base year market size calculations are validated from supply as well as demand side. Demand side validations are based on macro-economic factor analysis and benchmarks for respective regions and countries. In case of supply side validations, revenues of major companies are estimated (in case not available) based on industry benchmark, approximate number of employees, product portfolio, and primary interviews revenues are gathered. Further revenue from target product/service segment is assessed to avoid overshooting of market statistics. In case of heavy deviations between supply and demand side values, all thes steps are repeated to achieve synchronization.
We follow an iterative model, wherein we share our research findings with Subject Matter Experts (SME’s) and Key Opinion Leaders (KOLs) until consensus view of the market is not formulated – this model negates any drastic deviation in the opinions of experts. Only validated and universally acceptable research findings are quoted in our reports.
We have important check points that we use to validate our research findings – which we call – data triangulation, where we validate the information, we generate from secondary sources with primary interviews and then we re-validate with our internal data bases and Subject matter experts. This comprehensive model enables us to deliver high quality, reliable data in shortest possible time.
 احصل على عينة مجانية لهذا التقرير