نظرة عامة على سوق أجهزة استشعار الشبكة الذكية والنمو والاتجاهات والتحليل والتقرير البحثي (2023-2031)
البيانات التاريخية : 2021-2022 | سنة الأساس : 2023 | فترة التنبؤ : 2024-2031حجم سوق مستشعرات الشبكة الذكية وتوقعاته (2021-2031)، والحصة العالمية والإقليمية، والاتجاهات، وتحليل فرص النمو. يغطي التقرير: حسب نوع المستشعر (مستشعر الجهد والتيار، ومستشعر درجة الحرارة، وغيرها)، ونطاق الجهد (من المنخفض إلى المتوسط والعالي)، والتطبيق (أتمتة محطات التوزيع، والبنية التحتية المتقدمة للقياس، وشبكة توزيع الشبكة الذكية، وغيرها)، والجغرافيا.
- تاريخ التقرير : Mar 2026
- رمز التقرير : TIPRE00012739
- الفئة : الإلكترونيات وأشباه الموصلات
- الحالة : البيانات الصادرة
- تنسيقات التقارير المتاحة :


- عدد الصفحات : 150
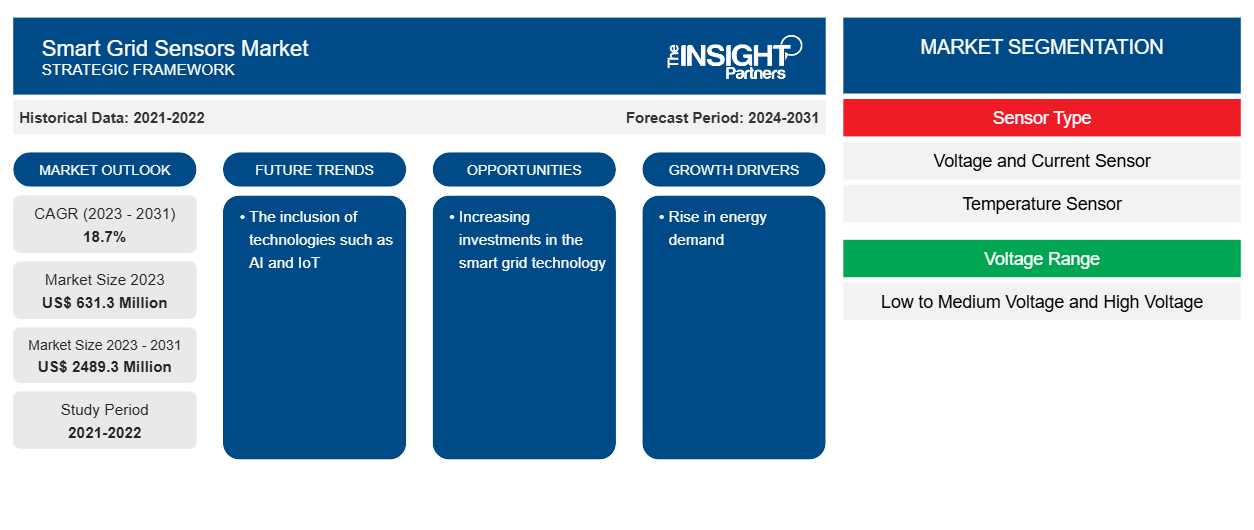
من المتوقع أن يصل حجم سوق أجهزة استشعار الشبكة الذكية إلى 2489.3 مليون دولار أمريكي بحلول عام 2031 من 631.3 مليون دولار أمريكي في عام 2023. ومن المتوقع أن يسجل السوق معدل نمو سنوي مركب بنسبة 18.7٪ في الفترة 2023-2031. ومن المرجح أن تظل التطورات في قطاع الطاقة والكهرباء والاستثمار الحكومي في تقنيات الشبكة الذكية من الاتجاهات الرئيسية لسوق أجهزة استشعار الشبكة الذكية.
تحليل سوق أجهزة استشعار الشبكة الذكية
اكتسب سوق أجهزة استشعار الشبكة الذكية زخمًا بسبب مشاريع المدن الذكية المتنامية التي تؤدي إلى تركيب شبكات ذكية. بالإضافة إلى ذلك، فإن الارتفاع في استبدال الشبكات التقليدية بالشبكات الذكية يغذي الطلب على أجهزة استشعار الشبكة الذكية. هناك حاجة إلى توليد الطاقة وتوزيعها ونقلها بكفاءة في جميع أنحاء العالم، مما يؤدي إلى اعتماد حلول أكثر ذكاءً. سيؤدي هذا إلى اعتماد تقنية الشبكة الذكية، مما يخلق فرصة لنمو سوق أجهزة استشعار الشبكة الذكية.
نظرة عامة على سوق أجهزة استشعار الشبكة الذكية
الشبكات الذكية هي شبكات طاقة كهربائية تستخدم المعلومات والشبكات المتقدمة وتقنيات المراقبة والتحكم في الوقت الفعلي لتقليل التكاليف والحفاظ على الطاقة وتحسين الأمان والتشغيل البيني والموثوقية. توفر المستشعرات المستخدمة في هذه الشبكات الذكية بيانات الشبكة وحالتها في الوقت الفعلي، مما يسمح بالمراقبة والحماية والتحكم في الوقت الفعلي. تُستخدم هذه المستشعرات لقياس مجموعة واسعة من المعلمات، والتي تشمل درجة الحرارة والجهد والتيار واستهلاك الطاقة. تستخدم هذه المستشعرات التحليلات المتقدمة وخوارزميات التعلم الآلي (ML) للكشف عن الأنماط والشذوذ في البيانات، مما يمكن أن يساعد شركات المرافق في تحديد ومنع المشكلات مثل أعطال المعدات وانقطاع التيار الكهربائي.
قم بتخصيص هذا التقرير ليناسب متطلباتك
ستحصل على تخصيص لأي تقرير - مجانًا - بما في ذلك أجزاء من هذا التقرير، أو تحليل على مستوى الدولة، وحزمة بيانات Excel، بالإضافة إلى الاستفادة من العروض والخصومات الرائعة للشركات الناشئة والجامعات
سوق أجهزة استشعار الشبكة الذكية: رؤى استراتيجية
-
احصل على أهم اتجاهات السوق الرئيسية لهذا التقرير.ستتضمن هذه العينة المجانية تحليلاً للبيانات، بدءًا من اتجاهات السوق وحتى التقديرات والتوقعات.
محركات وفرص سوق أجهزة استشعار الشبكة الذكية
ارتفاع الطلب على الطاقة يصب في صالح السوق
إن التوسع الحضري وارتفاع مستويات المعيشة والدخل المتاح واعتماد التقنيات المتقدمة تعمل على تغذية الطلب على الطاقة. أصبحت شبكات الطاقة أكثر تعقيدًا مع زيادة الطلب على الكهرباء من القطاعات السكنية والتجارية على مستوى العالم. ومع تزايد تعقيد شبكات الطاقة، أصبحت عملية توزيع وإنتاج الطاقة المستدامة والموثوقة والفعالة والآمنة أكثر أهمية. ومع ارتفاع استهلاك الكهرباء والطلب عليها، أصبح الإنتاج والتوزيع أكثر صعوبة. ومع تزايد ذكاء شبكات الطاقة واستخدامها على نطاق واسع، هناك طلب متزايد على أجهزة استشعار الشبكة الذكية.
زيادة الاستثمارات في تكنولوجيا الشبكة الذكية - فرصة في سوق أجهزة استشعار الشبكة الذكية
تتزايد المبادرة العالمية لاستخدام تكنولوجيا الشبكات الذكية لمعالجة المخاوف البيئية مثل انبعاثات ثاني أكسيد الكربون. ووفقًا لوكالة الطاقة الدولية في سبتمبر 2022، فإن الاستثمار في الشبكات الذكية يجب أن يتضاعف بحلول عام 2030 لتحقيق سيناريو الانبعاثات الصفرية الصافية بحلول عام 2050، وخاصة في الأسواق الناشئة والاقتصادات النامية. وبالتالي، فإن النمو في تركيبات تكنولوجيات الشبكات الذكية يطور الطلب على أجهزة استشعار الشبكات الذكية لبيئة عملها الفعالة.
تقرير تحليل تجزئة سوق أجهزة استشعار الشبكة الذكية
إن القطاعات الرئيسية التي ساهمت في اشتقاق تحليل سوق أجهزة استشعار الشبكة الذكية هي نوع المستشعر ونطاق الجهد والتطبيق.
- بناءً على نوع المستشعر، يتم تقسيم السوق إلى مستشعر الجهد والتيار ومستشعر درجة الحرارة وغيرها. احتلت شريحة مستشعر الجهد والتيار حصة سوقية أكبر في عام 2023.
- بحسب نطاق الجهد، يتم تقسيم السوق إلى جهد منخفض إلى متوسط وجهد عالي. احتلت شريحة الجهد المنخفض إلى المتوسط الحصة الأكبر من السوق في عام 2023.
- من حيث التطبيق، يتم تقسيم السوق إلى أتمتة محطات الطاقة الفرعية، والبنية التحتية المتقدمة للقياس، وشبكة توزيع الشبكة الذكية ، وغيرها. احتل قطاع أتمتة محطات الطاقة الفرعية الحصة الأكبر من السوق في عام 2023.
تحليل حصة سوق أجهزة استشعار الشبكة الذكية حسب المنطقة الجغرافية
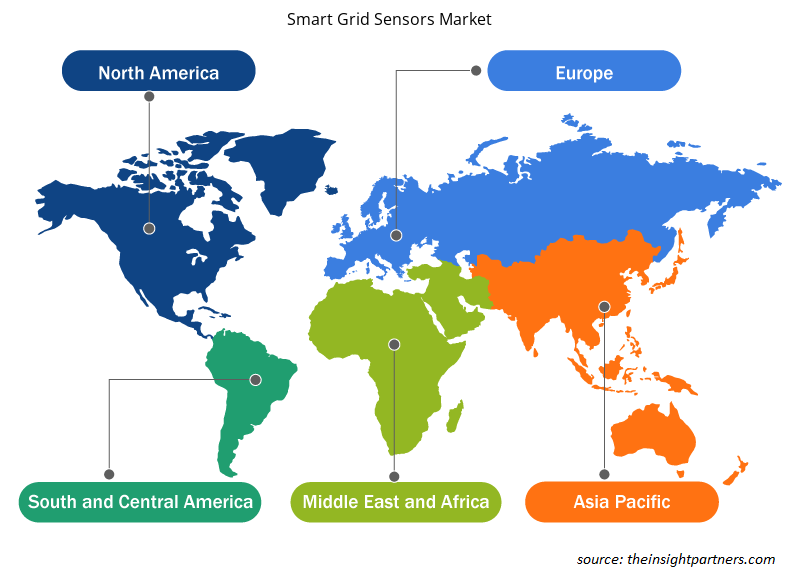
ينقسم النطاق الجغرافي لتقرير سوق أجهزة استشعار الشبكة الذكية بشكل أساسي إلى خمس مناطق: أمريكا الشمالية، ومنطقة آسيا والمحيط الهادئ، وأوروبا، والشرق الأوسط وأفريقيا، وأمريكا الجنوبية/أمريكا الجنوبية والوسطى.
من حيث الإيرادات، استحوذت أمريكا الشمالية على أكبر حصة في سوق أجهزة استشعار الشبكة الذكية في عام 2023. تتميز المنطقة بالتقدم التكنولوجي مقارنة بالمناطق الأخرى، وهو أحد العوامل البارزة التي تغذي حصة سوق أجهزة استشعار الشبكة الذكية في أمريكا الشمالية.
مع دمج المنازل والشركات الأمريكية لعدد متزايد من الأدوات الإلكترونية والقدرات التقنية، تزداد الحاجة إلى أن تتعلم المرافق عن الطلب المتغير على الكهرباء في الوقت الفعلي. في هذه الحالة، يمكن أن يساعد دمج الشبكات الذكية في منح جميع عملاء الشبكة كهرباء أكثر موثوقية. لتلبية هذا، تقوم حكومات مختلف البلدان في أمريكا الشمالية باستثمارات مختلفة في الشبكات الذكية. على سبيل المثال، في سبتمبر 2022، كانت وزارة الطاقة الأمريكية تعمل على طلب مدخلات بشأن برنامج بقيمة 10.5 مليار دولار أمريكي للشبكات الذكية والترقيات الأخرى لتعزيز شبكة الكهرباء في البلاد. يتم تخصيص هذا التمويل في ثلاثة أجزاء، حيث سيتم استخدام 2.5 مليار دولار أمريكي لمرونة الشبكة، و3 مليارات دولار أمريكي للشبكات الذكية، و5 مليارات دولار أمريكي لابتكار الشبكة. وبالتالي، فإن الاستثمار المتزايد في البنية التحتية للشبكة الذكية يؤدي إلى نمو سوق أجهزة استشعار الشبكة الذكية في أمريكا الشمالية.
رؤى إقليمية حول سوق أجهزة استشعار الشبكة الذكية
لقد قام المحللون في Insight Partners بشرح الاتجاهات والعوامل الإقليمية المؤثرة على سوق أجهزة استشعار الشبكة الذكية طوال فترة التوقعات بشكل شامل. يناقش هذا القسم أيضًا قطاعات سوق أجهزة استشعار الشبكة الذكية والجغرافيا في جميع أنحاء أمريكا الشمالية وأوروبا ومنطقة آسيا والمحيط الهادئ والشرق الأوسط وأفريقيا وأمريكا الجنوبية والوسطى.
- احصل على البيانات الإقليمية المحددة لسوق أجهزة استشعار الشبكة الذكية
نطاق تقرير سوق أجهزة استشعار الشبكة الذكية
| سمة التقرير | تفاصيل |
|---|---|
| حجم السوق في عام 2023 | 631.3 مليون دولار أمريكي |
| حجم السوق بحلول عام 2031 | 2489.3 مليون دولار أمريكي |
| معدل النمو السنوي المركب العالمي (2023 - 2031) | 18.7% |
| البيانات التاريخية | 2021-2022 |
| فترة التنبؤ | 2024-2031 |
| القطاعات المغطاة |
حسب نوع المستشعر
|
| المناطق والدول المغطاة |
أمريكا الشمالية
|
| قادة السوق وملفات تعريف الشركات الرئيسية |
|
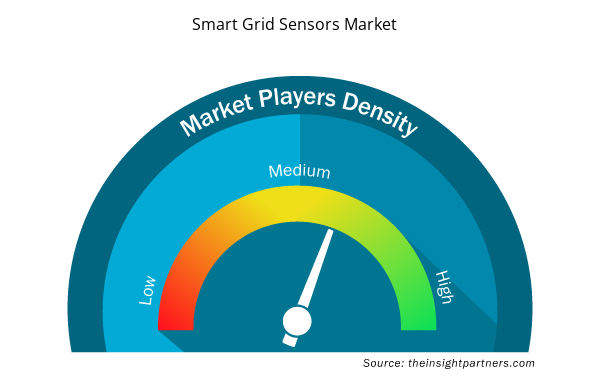
كثافة اللاعبين في سوق أجهزة استشعار الشبكة الذكية: فهم تأثيرها على ديناميكيات الأعمال
يشهد سوق أجهزة استشعار الشبكة الذكية نموًا سريعًا، مدفوعًا بالطلب المتزايد من المستخدم النهائي بسبب عوامل مثل تفضيلات المستهلكين المتطورة والتقدم التكنولوجي والوعي المتزايد بفوائد المنتج. ومع ارتفاع الطلب، تعمل الشركات على توسيع عروضها والابتكار لتلبية احتياجات المستهلكين والاستفادة من الاتجاهات الناشئة، مما يؤدي إلى زيادة نمو السوق.
تشير كثافة اللاعبين في السوق إلى توزيع الشركات أو المؤسسات العاملة في سوق أو صناعة معينة. وهي تشير إلى عدد المنافسين (اللاعبين في السوق) الموجودين في مساحة سوق معينة نسبة إلى حجمها أو قيمتها السوقية الإجمالية.
الشركات الرئيسية العاملة في سوق أجهزة استشعار الشبكة الذكية هي:
- شركة أيه بي بي المحدودة
- ليم
- شركة إيتون المحدودة
- شركة لترون
- كامستروب
- لانديس+جير
إخلاء المسؤولية : الشركات المذكورة أعلاه ليست مرتبة بأي ترتيب معين.
- احصل على نظرة عامة على أهم اللاعبين الرئيسيين في سوق أجهزة استشعار الشبكة الذكية
أخبار سوق أجهزة استشعار الشبكة الذكية والتطورات الأخيرة
سوق أجهزة استشعار الشبكة الذكية
يتم التقييم من خلال جمع البيانات النوعية والكمية بعد البحث الأولي والثانوي، والتي تتضمن منشورات الشركات المهمة وبيانات الجمعيات وقواعد البيانات. فيما يلي قائمة بالتطورات في السوق:
- في فبراير 2021، مكّنت TE Connectivity تطبيقات الشبكة الذكية من خلال موصل Raychem RSTI-VS القابل للفصل مع مستشعر الجهد، والمتوافق مع جهاز مراقبة الشبكة IKI-50 من Kries. أطلقت TE Connectivity، الشركة الرائدة عالميًا في مجال الاتصال وأجهزة الاستشعار، موصل Raychem الذكي القابل للفصل RSTI-VS مع مستشعر الجهد. يمكن استخدامه لمراقبة الشبكة والكشف المتقدم عن الأعطال الأرضية والدوائر القصيرة في أسواق IEC. (المصدر: TE Connectivity, Inc، بيان صحفي، 2021)
- في مارس 2023، شارك الباحثان يوجين سونغ وكانج لي من المعهد الوطني للمعايير والتكنولوجيا في مجموعة عمل IEEE P2681، والتي أدت إلى تطوير تقرير فني، PES-TR102، أجهزة استشعار الشبكة الذكية متوسطة الجهد وأنظمة الاستشعار: اعتبارات دقة القياس وعدم اليقين. تم رعاية التقرير من قبل فريق عمل أجهزة استشعار PSIM التابع لمعهد IEEE PES وتم نشره في يناير 2023. يدعم التقرير تطوير معيار IEEE P2681 المقترح "دليل اختبار أجهزة استشعار الشبكة الذكية متوسطة الجهد وأنظمة الأجهزة الإلكترونية الذكية". (المصدر: المعهد الوطني للمعايير والتكنولوجيا (NIST)، بيان صحفي، 2023)
تقرير سوق أجهزة استشعار الشبكة الذكية والتغطية والنتائج المتوقعة
يوفر تقرير "حجم سوق أجهزة استشعار الشبكة الذكية والتوقعات (2023-2031)" تحليلاً مفصلاً للسوق يغطي المجالات التالية:
- حجم السوق والتوقعات على المستويات العالمية والإقليمية والوطنية لجميع قطاعات السوق الرئيسية التي يغطيها النطاق
- ديناميكيات السوق مثل المحركات والقيود والفرص الرئيسية
- الاتجاهات المستقبلية الرئيسية
- تحليل مفصل لقوى PEST/Porter الخمس وSWOT
- تحليل السوق العالمي والإقليمي الذي يغطي اتجاهات السوق الرئيسية واللاعبين الرئيسيين واللوائح والتطورات الأخيرة في السوق
- تحليل المشهد الصناعي والمنافسة الذي يغطي تركيز السوق، وتحليل خريطة الحرارة، واللاعبين البارزين، والتطورات الأخيرة
- ملفات تعريف الشركة التفصيلية

نافين خبيرٌ متمرسٌ في أبحاث السوق والاستشارات، يتمتع بخبرةٍ تزيد عن 9 سنوات في مشاريع مُخصصة ومُشتركة واستشارية. يشغل حاليًا منصب نائب الرئيس المساعد، وقد نجح في إدارة أصحاب المصلحة عبر سلسلة قيمة المشاريع، وألّف أكثر من 100 تقرير بحثي وأكثر من 30 مهمة استشارية. يمتد نطاق عمله ليشمل مشاريع صناعية وحكومية، مساهمًا بشكل كبير في نجاح العملاء واتخاذ القرارات القائمة على البيانات.
نافين حاصلٌ على شهادة في هندسة الإلكترونيات والاتصالات من جامعة فرجينيا التقنية، كارناتاكا، وشهادة ماجستير في إدارة الأعمال في التسويق والعمليات من جامعة مانيبال. وهو عضوٌ نشطٌ في معهد مهندسي الكهرباء والإلكترونيات (IEEE) لمدة 9 سنوات، حيث شارك في مؤتمراتٍ وندواتٍ تقنية، وتطوّع على مستوى الأقسام والمناطق. قبل منصبه الحالي، عمل مستشارًا استراتيجيًا مساعدًا في IndustryARC، ومستشارًا للخوادم الصناعية في شركة هيوليت باكارد (HP Global).
- التحليل التاريخي (سنتان)، سنة الأساس، التوقعات (7 سنوات) مع معدل النمو السنوي المركب
- تحليل PEST و SWOT
- حجم السوق والقيمة / الحجم - عالمي، إقليمي، بلد
- الصناعة والمنافسة
- مجموعة بيانات إكسل
التقارير الحديثة
تقارير ذات صلة
شهادات العملاء
تقرير سوق أنظمة SCADA من Insight Partners شامل، ويقدم رؤى قيّمة حول الاتجاهات الحالية والتوقعات المستقبلية. تميّز الفريق باحترافية عالية وسرعة في الاستجابة ودعم مستمر طوال الوقت. نحن راضون جدًا ونوصي بشدة بخدماتهم.
ران كيديم شريك, شركة ريالي تكنولوجيز المحدودةطلبتُ تقريرًا عن سوق برمجيات محدد، وأعدّه الفريق في غضون أيام قليلة. كانت المعلومات ذات صلة وثيقة وعرضها جيد. ثم طلبتُ بعض التعديلات والإضافات على التقرير. وكان الفريق متجاوبًا للغاية، وحصلتُ على التقرير النهائي في أقل من أسبوع.
جان هيرفيه جين رئيس مجلس الإدارة, فيوتشر أناليتيكاعملنا مع شركة "إنسايت بارتنرز" لإجراء دراسة سوقية وتوقعات مهمة. زودونا برؤى واضحة حول الفرص والمخاطر، مما ساعدنا في صياغة خططنا. كانت أبحاثهم سهلة الاستخدام ومبنية على بيانات دقيقة، مما ساعدنا على اتخاذ قرارات ذكية وواثقة. نوصي بهم بشدة.
بيوش ناجبال نائب الرئيس الأول, شعاع عالي عالميقدّمت شركة Insight Partners أبحاثًا سوقية ثاقبة ومنظمة جيدًا بخبرة واسعة في هذا المجال. تميّز فريقهم بالاحترافية وسرعة الاستجابة طوال الوقت. وسهّل موقعهم الإلكتروني سهل الاستخدام الوصول إلى تقارير القطاع. نوصي بهم بشدة لخدمات بحثية موثوقة وعالية الجودة.
يوكيهيكو أداتشي المدير التنفيذي, ديب بلو، ذ.م.م.هذه أول مرة أشتري فيها تقرير سوق من The Insight Partners. رغم أنني كنت مترددًا في البداية، إلا أنني زرت موقعهم الإلكتروني وشعرت براحة أكبر للمخاطرة وشراء تقرير السوق. أنا راضٍ تمامًا عن جودة التقرير وخدمة العملاء. كانت لديّ عدة أسئلة وتعليقات حول التقرير الأولي، ولكن بعد بضع محادثات عبر البريد الإلكتروني مع محللهم، أعتقد أن لديّ تقريرًا يمكنني استخدامه كمدخل لعملية التخطيط الاستراتيجي لدينا. شكرًا جزيلاً لكم على تخصيص وقتكم الإضافي وجعل هذه التجربة إيجابية. سأوصي بخدماتكم للآخرين بالتأكيد، وستكونون أول من ألجأ إليه عندما نحتاج إلى المزيد من بيانات السوق.
جون سوزوكي الرئيس والرئيس التنفيذي وعضو مجلس الإدارة, بي كيه تكنولوجيزأود أن أقدّر دعمكم واحترافيتكم في الاستجابة لطلبي للحصول على معلومات بشأن سوق التشخيص المخبري للأمراض المعدية في نيجيريا. كما أُقدّر صبركم وتوجيهكم، واستعدادكم لتقديم خصم، مما مكّننا في النهاية من إتمام الصفقة. أتطلع إلى التعامل مع "ذا إنسايت بارتنرز" مستقبلًا، كل ذلك بفضل الانطباع الذي تركتموه لديّ نتيجةً لهذا اللقاء الأول.
الدكتور تشيجيوك أونيا المدير الإداري, شركة باينكريست للرعاية الصحية المحدودةسبب الشراء
- اتخاذ قرارات مدروسة
- فهم ديناميكيات السوق
- تحليل المنافسة
- رؤى العملاء
- توقعات السوق
- تخفيف المخاطر
- التخطيط الاستراتيجي
- مبررات الاستثمار
- تحديد الأسواق الناشئة
- تحسين استراتيجيات التسويق
- تعزيز الكفاءة التشغيلية
- مواكبة التوجهات التنظيمية


 احصل على عينة مجانية ل - سوق أجهزة استشعار الشبكة الذكية