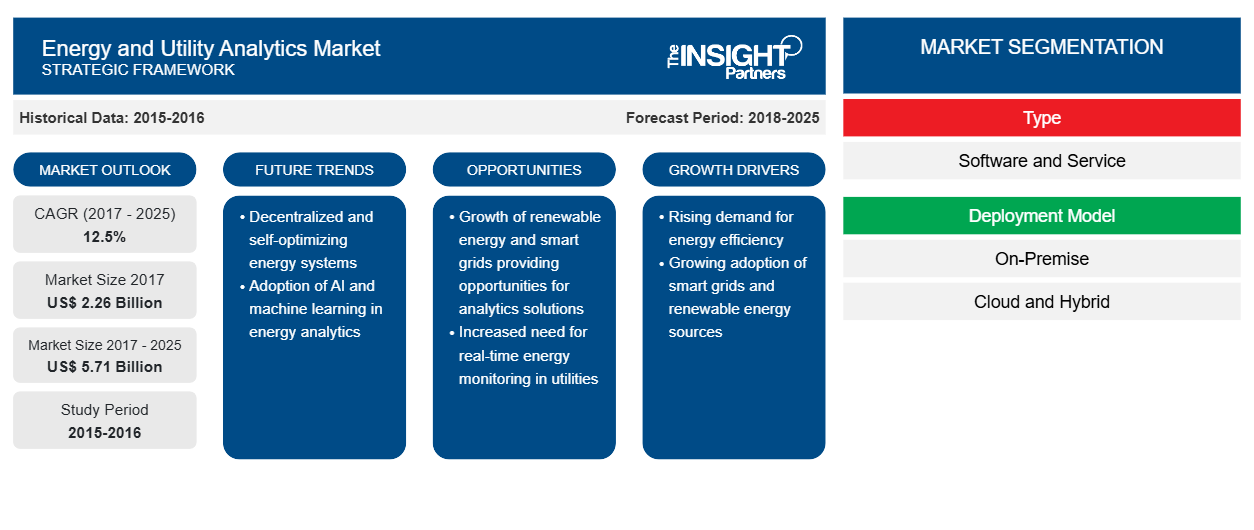
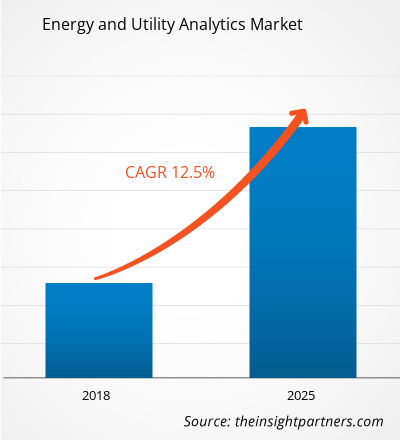
بلغت قيمة سوق تحليلات الطاقة والمرافق 2،260.0 مليون دولار أمريكي في عام 2017 ومن المتوقع أن تنمو بمعدل نمو سنوي مركب قدره 12.5٪ خلال الفترة المتوقعة 2017 - 2025، لتصل إلى 5،713.3 مليون دولار أمريكي في عام 2025.
بفضل ظهور العدادات الذكية وأجهزة الاستشعار الذكية وتقنيات إنترنت الأشياء، شهدت صناعة الطاقة والمرافق تحولاً كبيراً، وخاصة فيما يتعلق بتوليد البيانات. وقد دفع هذا التحول إلى تنفيذ حلول تحليلية للبيانات التي تولدها شبكات المرافق، وآبار النفط، ومحطات التوليد، وقطاعات إنتاج الطاقة. وبمساعدة هذه الحلول التحليلية، اكتسبت الأجيال الموزعة القدرة على استخلاص رؤى ذات مغزى يمكن استخدامها في اتخاذ القرارات التشغيلية. علاوة على ذلك، توفر التحليلات في صناعة الطاقة والمرافق معرفة غير مسبوقة بالفجوات في الطلب والعرض في الوقت الفعلي، واستخدام الأصول وأوقات التوقف.
وبما أن التحليلات تمكن صناعة الطاقة والمرافق من تحقيق الإمكانات الكاملة لشبكاتها الذكية وتحسين العائد الإجمالي على الاستثمارات الرأسمالية، فمن المتوقع أن يؤدي التبني والتنفيذ الواسع النطاق للأجهزة الذكية إلى دفع الطلب على التحليلات في صناعة الطاقة والمرافق العالمية.
بالإضافة إلى ذلك، تلعب التحليلات أيضًا دورًا حاسمًا في تحويل كمية هائلة من البيانات من أصول المعلومات، مثل العدادات وأجهزة الاستشعار وأنظمة التحكم الإشرافي وتحصيل البيانات (SCADA) إلى رؤى قابلة للتنفيذ، مما يسهل بشكل أكبر التنبؤ باتخاذ القرارات الحاسمة ووصفها، وخاصة لتحليل جودة الخدمة وإدارة الانقطاعات وأنشطة الصيانة الوقائية. ومن المتوقع أن تؤدي المزايا العديدة التي توفرها التحليلات إلى دفع سوق تحليلات الطاقة والمرافق بشكل كبير في السنوات القادمة.
رؤى السوق
قم بتخصيص هذا التقرير ليناسب متطلباتك
ستحصل على تخصيص لأي تقرير - مجانًا - بما في ذلك أجزاء من هذا التقرير، أو تحليل على مستوى الدولة، وحزمة بيانات Excel، بالإضافة إلى الاستفادة من العروض والخصومات الرائعة للشركات الناشئة والجامعات
سوق تحليلات الطاقة والمرافق:
- احصل على أهم اتجاهات السوق الرئيسية لهذا التقرير.ستتضمن هذه العينة المجانية تحليلاً للبيانات، بدءًا من اتجاهات السوق وحتى التقديرات والتوقعات.
سوف يصبح تبادل البيانات اتجاهًا واسع النطاق
حتى الآن كانت الشركات تعرقل مشاركة بياناتها، بسبب التهديد الأمني المستمر بين الصناعات الرئيسية في قطاع الطاقة والمرافق. وكانت صناعة النفط والغاز ، على وجه الخصوص، الأكثر تقييدًا فيما يتعلق بمشاركة البيانات، حيث يمكن أن يؤدي فقدان البيانات التشغيلية إلى تمكينها من إطلاق العنان لميزتها التنافسية، وهو ما قد يعيق نموها المستقبلي.
ومع ذلك، ومع قيام شركات التكنولوجيا برفع معاييرها للتخفيف من المخاطر الأمنية، فمن المتوقع أن تدرك مؤسسات الطاقة والمرافق المزايا العديدة التي توفرها مشاركة البيانات. وتشمل بعض هذه المزايا قدرات المراقبة التي اكتسبها مزودو المعدات، والتي ستمكنهم لاحقًا من تقييم مشكلات الصيانة في الوقت الفعلي. وعلاوة على ذلك، فإن مشاركة البيانات من شأنها أيضًا أن توفر الأساس لاتجاه المعدات كخدمات من شأنه أن يسمح لصناعات الطاقة والمرافق بالتحول من شراء المعدات إلى الاستثمار في تأجير المعدات.
إن ظهور تبادل البيانات من شأنه أيضاً أن يولّد فرصاً لتبني الحلول التحليلية مثل شبكات الاستجابة للطلب القوية، وتحسين سلسلة التوريد، وغير ذلك من البرامج التي من شأنها أن تساهم بشكل كبير في نمو المدن الذكية. ورغم أن تبادل البيانات يقتصر في الوقت الحاضر على بعض الاقتصادات المتقدمة في العالم، فمن المتوقع أن يتزايد هذا الاتجاه في المستقبل القريب. ومن شأن هذا التدفق الحر للمعلومات أن يعمل على تسريع الطلب على القدرات التحليلية من أجل تعزيز قدرات اتخاذ القرار بكفاءة أكبر.
نوع رؤى السوق
لقد أدت الثورة الذكية إلى زيادة التعقيدات التشغيلية لشركات الطاقة والمرافق في جميع أنحاء العالم. بالإضافة إلى ذلك، هناك نمو هائل في حجم وتنوع وتعقيد البيانات. مع تزايد المنافسة والبيئة شديدة التنظيم، تقوم الشركات العاملة في صناعة الطاقة والمرافق بتنفيذ قدرات تحليلية للتنافس بكفاءة في السوق. يتم تصنيف قطاع نوع سوق تحليلات الطاقة والمرافق إلى حلول وخدمات.
نظرة عامة على سوق الخدمات
ينقسم قطاع خدمات تحليلات الطاقة والمرافق إلى خدمات مُدارة وخدمات احترافية. وقد أكدت التطورات التكنولوجية السريعة على ضرورة فهم تعقيدات بيئة تكنولوجيا المعلومات والتأكد من مزامنة التكنولوجيا مع الأهداف التجارية لشركات الطاقة والمرافق. كان دمج أنظمة تكنولوجيا المعلومات المتعددة التي تخدم أقسامًا ووظائف ومراحل مختلفة في دورات حياة المنتج تحديًا رئيسيًا تواجهه المنظمات اليوم في مسار نموها. وبالتالي، تسعى المنظمات إلى تنفيذ نماذج أعمال مدفوعة بالتكنولوجيا لتحقيق ميزة تنافسية.
نظرة عامة على سوق نموذج النشر
يتم تقسيم سوق تحليلات الطاقة والمرافق العالمية على أساس نوع النشر إلى محلي وسحابي وهجين. في السيناريو الحالي، تزداد الحاجة إلى حلول التحليلات من قبل شركات الطاقة والمرافق. ومع ذلك، يظل تهديد الجرائم الإلكترونية دائمًا تحديًا للشركات التي تتبنى برامج التحليلات. وبالتالي، تختار العديد من الشركات نموذج النشر المحلي من أجل حماية بياناتها والحفاظ على بياناتها في متناول أيديها.
نظرة عامة على سوق التطبيقات
إن سوق الطاقة والمرافق العالمية مقسمة حسب التطبيق إلى التنبؤ بالحمل، وتحليلات العملاء، وتحليلات الشبكة، وإدارة الأصول، وتحليلات العدادات الذكية وغيرها. إن التنبؤ بالطلب على الكهرباء هو عملية متكاملة ومركزية لوضع استراتيجيات لتوسيع المرافق والعمليات الدورية في قطاع الطاقة والكهرباء. ونظرًا لأن أنماط الطلب في القطاعات المختلفة معقدة للغاية بسبب تحرير أسواق الطاقة، فقد أصبح اختيار نموذج تنبؤ مناسب لشبكة كهرباء معينة مهمة صعبة نسبيًا لصناعات الطاقة والمرافق. وعلى الرغم من وجود طرق تنبؤ مختلفة في السوق، إلا أنه لا يمكن تعميم أي منها على جميع أنماط الطلب.
نظرة عامة على السوق العمودية
ينقسم القطاع الرأسي للصناعة في سوق تحليلات الطاقة والمرافق العالمية إلى النفط والغاز والطاقة النووية والطاقة المتجددة والمرافق وغيرها. تتبنى شركات النفط والغاز حلول التحليلات بشكل صارم حيث تواصل الصناعة البحث عن إدارة المخاطر على عدة جبهات. بالإضافة إلى ذلك، من المتوقع أيضًا أن تخلق التكلفة المتزايدة للاستخراج والحفر تحديًا للشركات العاملة في صناعة النفط والغاز. وبالتالي، تقوم الشركات بتضمين التحليلات لتوصيف الخزانات، والتنبؤ بالإنتاج، وتحسين الحفر، وتحسين تعقيدات توصيف الخزانات من بين فوائد أخرى. علاوة على ذلك، مع المبادرات الحكومية نحو إنتاج الطاقة المتجددة، من المتوقع أيضًا أن تلاحظ منشآت الطاقة المتجددة نموًا كبيرًا على مستوى العالم.
يركز اللاعبون العاملون في سوق إدارة محتوى المؤسسات على استراتيجيات مثل عمليات الدمج والاستحواذ ومبادرات السوق للحفاظ على مواقعهم في السوق. فيما يلي قائمة ببعض التطورات التي قام بها اللاعبون الرئيسيون:
- في أبريل 2018، دخلت BuildingIQ في شراكة مع Cypress Envirosystems، لتعزيز الإنتاجية والخطوة نحو توفير الطاقة. ستجمع BuildingIQ بين تحسينها التنبئي مع ترموستات Envirosystems المتقدمة التي توفرها Cypress. تهدف الشراكة إلى تزويد المباني القديمة بحلول تعتمد على الذكاء الاصطناعي لتقديم رؤية أفضل للنظام. كما ستسمح أيضًا للمباني القديمة بخفض استخدام الطاقة الكهربائية بنسبة 30%.
- في فبراير 2018، قدمت شركة EnergySavvy ومنطقة المرافق العامة لمقاطعة سنوهوميش ملف تعريف الطاقة المنزلية الجديد الخاص بمنطقة المرافق العامة، وهو أداة تقييم عبر الإنترنت تمكن العملاء من توفير الطاقة في منازلهم.
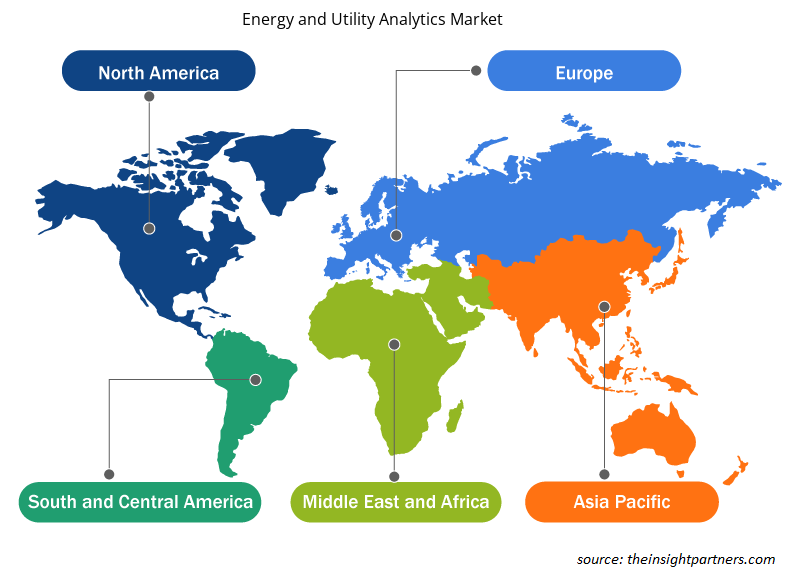
رؤى إقليمية حول سوق تحليلات الطاقة والمرافق
لقد قام المحللون في Insight Partners بشرح الاتجاهات والعوامل الإقليمية المؤثرة على سوق تحليلات الطاقة والمرافق طوال فترة التوقعات بشكل شامل. يناقش هذا القسم أيضًا قطاعات سوق تحليلات الطاقة والمرافق والجغرافيا في جميع أنحاء أمريكا الشمالية وأوروبا ومنطقة آسيا والمحيط الهادئ والشرق الأوسط وأفريقيا وأمريكا الجنوبية والوسطى.
- احصل على البيانات الإقليمية المحددة لسوق تحليلات الطاقة والمرافق
نطاق تقرير سوق تحليلات الطاقة والمرافق
| سمة التقرير | تفاصيل |
|---|---|
| حجم السوق في عام 2017 | 2.26 مليار دولار أمريكي |
| حجم السوق بحلول عام 2025 | 5.71 مليار دولار أمريكي |
| معدل النمو السنوي المركب العالمي (2017 - 2025) | 12.5% |
| البيانات التاريخية | 2015-2016 |
| فترة التنبؤ | 2018-2025 |
| القطاعات المغطاة | حسب النوع
|
| المناطق والدول المغطاة | أمريكا الشمالية
|
| قادة السوق وملفات تعريف الشركات الرئيسية |
|
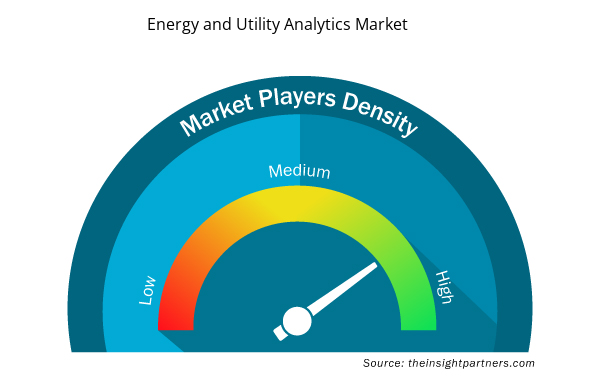
كثافة اللاعبين في السوق: فهم تأثيرها على ديناميكيات الأعمال
يشهد سوق تحليلات الطاقة والمرافق نموًا سريعًا، مدفوعًا بالطلب المتزايد من المستخدم النهائي بسبب عوامل مثل تفضيلات المستهلكين المتطورة والتقدم التكنولوجي والوعي المتزايد بفوائد المنتج. ومع ارتفاع الطلب، تعمل الشركات على توسيع عروضها والابتكار لتلبية احتياجات المستهلكين والاستفادة من الاتجاهات الناشئة، مما يؤدي إلى زيادة نمو السوق.
تشير كثافة اللاعبين في السوق إلى توزيع الشركات أو المؤسسات العاملة في سوق أو صناعة معينة. وهي تشير إلى عدد المنافسين (اللاعبين في السوق) الموجودين في مساحة سوق معينة نسبة إلى حجمها أو قيمتها السوقية الإجمالية.
الشركات الرئيسية العاملة في سوق تحليلات الطاقة والمرافق هي:
- أتوس إس إي
- بيلدينجيك، المحدودة
- كابجيميني إس إي
- شركة آي بي إم
- انفوسيس المحدودة
إخلاء المسؤولية : الشركات المذكورة أعلاه ليست مرتبة بأي ترتيب معين.
- احصل على نظرة عامة على أهم اللاعبين الرئيسيين في سوق تحليلات الطاقة والمرافق
قطاعات سوق تحليلات الطاقة والمرافق العالمية:
سوق تحليلات الطاقة والمرافق – النوع
- الحلول
- خدمات
سوق تحليلات الطاقة والمرافق – الخدمة
- الخدمات المهنية
- الخدمات المُدارة
نموذج نشر تحليلات سوق الطاقة والمرافق
- في الموقع
- سحاب
- هجين
سوق تحليلات الطاقة والمرافق – التطبيق
- التنبؤ بالحمل
- تحليلات العملاء
- تحليلات الشبكة
- إدارة الأصول
- تحليلات العدادات الذكية
- آحرون
سوق تحليلات الطاقة والمرافق – حسب القطاع
- النفط والغاز
- الطاقة المتجددة
- الطاقة النووية
- كهرباء
- ماء
- آحرون
سوق تحليلات الطاقة والمرافق – حسب المنطقة الجغرافية
أمريكا الشمالية
- نحن
- كندا
- المكسيك
أوروبا
- فرنسا
- ألمانيا
- إيطاليا
- إسبانيا
- المملكة المتحدة
- بقية أوروبا
آسيا والمحيط الهادئ (APAC)
- أستراليا
- الصين
- الهند
- اليابان
- بقية منطقة آسيا والمحيط الهادئ
الشرق الأوسط وأفريقيا
- المملكة العربية السعودية
- الامارات العربية المتحدة
- جنوب أفريقيا
- باقي منطقة الشرق الأوسط وأفريقيا
أمريكا الجنوبية (SAM)
- البرازيل
- بقية سام
شركات
- شركة الآلات التجارية الدولية
- شركة أوراكل
- شركة BuildingIQ
- كابجيميني إس إي
- شركة انيرجي سافي
- شركة انفوسيس المحدودة
- ساب اس اي
- معهد SAS
- ويجو وايز، المحدودة.
- شركة ويبرو المحدودة
- التحليل التاريخي (سنتان)، السنة الأساسية، التوقعات (7 سنوات) مع معدل النمو السنوي المركب
- تحليل PEST و SWOT
- حجم السوق والقيمة / الحجم - عالميًا وإقليميًا وقطريًا
- الصناعة والمنافسة
- مجموعة بيانات Excel


Report Coverage
Revenue forecast, Company Analysis, Industry landscape, Growth factors, and Trends

Segment Covered
This text is related
to segments covered.

Regional Scope
North America, Europe, Asia Pacific, Middle East & Africa, South & Central America

Country Scope
This text is related
to country scope.
الأسئلة الشائعة
The energy and utility analytics market is led by software segment with highest share in 2019, and service segment is expected to dominate the market on the basis of highest CAGR. The dominance of software segment is mainly because the energy and utility industry is still into implementation phase of the analytics, however in the coming years as the penetration of cloud based solutions increases majority of the solution providers would shift to analytics as a services, contributing to the services sector in energy and utility market.
The growth of the energy and utility analytics market growth is primarily attributed to the advanced decision making capabilities offered by analytics solutions. Moreover, the enhanced customer service capabilities and increasingly complicating oil & gas industry to drive the demand for robust analytical solutions, thereby substantially driving the energy and utility analytics market.
Increasing infrastructure development and smart cities is expected to create significant opportunity for the energy and utility analytics market growth. The emerging smart cities and infrastructural development across the developing countries such as India and China have been creating the excessive opportunities in the digital analytics market. Implementation of green industrialization and use of renewable energy has been promoted by developed countries. In this era of modernization, use of smart devices and IoT technology has been raising for the real-time accessibility, effectiveness, control and easy managing. Smart cites technologies has gained momentum around the globe and set for rapid transformation. It also includes intelligent transport systems, smart waste management and robust information technology that will improve the quality of living, employment opportunities and urban services. Thereby, analytics solutions would be used for analyzing the essential decision making for the smart cities and for industrial development, as there is the requirement for monitoring and analyzing the expensive assets, manage price fluctuations and reduced operational cost.
The List of Companies - Energy & Utility Analytics Market
- Atos SE
- BUILDINGIQ, INC.
- CAPGEMINI SE
- IBM Corporation
- Infosys Ltd.
- Oracle Corporation
- SAP SE
- SAS Institute Inc.
- WegoWise, Inc.
- Wipro Limited
The Insight Partners performs research in 4 major stages: Data Collection & Secondary Research, Primary Research, Data Analysis and Data Triangulation & Final Review.
- Data Collection and Secondary Research:
As a market research and consulting firm operating from a decade, we have published and advised several client across the globe. First step for any study will start with an assessment of currently available data and insights from existing reports. Further, historical and current market information is collected from Investor Presentations, Annual Reports, SEC Filings, etc., and other information related to company’s performance and market positioning are gathered from Paid Databases (Factiva, Hoovers, and Reuters) and various other publications available in public domain.
Several associations trade associates, technical forums, institutes, societies and organization are accessed to gain technical as well as market related insights through their publications such as research papers, blogs and press releases related to the studies are referred to get cues about the market. Further, white papers, journals, magazines, and other news articles published in last 3 years are scrutinized and analyzed to understand the current market trends.
- Primary Research:
The primarily interview analysis comprise of data obtained from industry participants interview and answers to survey questions gathered by in-house primary team.
For primary research, interviews are conducted with industry experts/CEOs/Marketing Managers/VPs/Subject Matter Experts from both demand and supply side to get a 360-degree view of the market. The primary team conducts several interviews based on the complexity of the markets to understand the various market trends and dynamics which makes research more credible and precise.
A typical research interview fulfils the following functions:
- Provides first-hand information on the market size, market trends, growth trends, competitive landscape, and outlook
- Validates and strengthens in-house secondary research findings
- Develops the analysis team’s expertise and market understanding
Primary research involves email interactions and telephone interviews for each market, category, segment, and sub-segment across geographies. The participants who typically take part in such a process include, but are not limited to:
- Industry participants: VPs, business development managers, market intelligence managers and national sales managers
- Outside experts: Valuation experts, research analysts and key opinion leaders specializing in the electronics and semiconductor industry.
Below is the breakup of our primary respondents by company, designation, and region:

Once we receive the confirmation from primary research sources or primary respondents, we finalize the base year market estimation and forecast the data as per the macroeconomic and microeconomic factors assessed during data collection.
- Data Analysis:
Once data is validated through both secondary as well as primary respondents, we finalize the market estimations by hypothesis formulation and factor analysis at regional and country level.
- Macro-Economic Factor Analysis:
We analyse macroeconomic indicators such the gross domestic product (GDP), increase in the demand for goods and services across industries, technological advancement, regional economic growth, governmental policies, the influence of COVID-19, PEST analysis, and other aspects. This analysis aids in setting benchmarks for various nations/regions and approximating market splits. Additionally, the general trend of the aforementioned components aid in determining the market's development possibilities.
- Country Level Data:
Various factors that are especially aligned to the country are taken into account to determine the market size for a certain area and country, including the presence of vendors, such as headquarters and offices, the country's GDP, demand patterns, and industry growth. To comprehend the market dynamics for the nation, a number of growth variables, inhibitors, application areas, and current market trends are researched. The aforementioned elements aid in determining the country's overall market's growth potential.
- Company Profile:
The “Table of Contents” is formulated by listing and analyzing more than 25 - 30 companies operating in the market ecosystem across geographies. However, we profile only 10 companies as a standard practice in our syndicate reports. These 10 companies comprise leading, emerging, and regional players. Nonetheless, our analysis is not restricted to the 10 listed companies, we also analyze other companies present in the market to develop a holistic view and understand the prevailing trends. The “Company Profiles” section in the report covers key facts, business description, products & services, financial information, SWOT analysis, and key developments. The financial information presented is extracted from the annual reports and official documents of the publicly listed companies. Upon collecting the information for the sections of respective companies, we verify them via various primary sources and then compile the data in respective company profiles. The company level information helps us in deriving the base number as well as in forecasting the market size.
- Developing Base Number:
Aggregation of sales statistics (2020-2022) and macro-economic factor, and other secondary and primary research insights are utilized to arrive at base number and related market shares for 2022. The data gaps are identified in this step and relevant market data is analyzed, collected from paid primary interviews or databases. On finalizing the base year market size, forecasts are developed on the basis of macro-economic, industry and market growth factors and company level analysis.
- Data Triangulation and Final Review:
The market findings and base year market size calculations are validated from supply as well as demand side. Demand side validations are based on macro-economic factor analysis and benchmarks for respective regions and countries. In case of supply side validations, revenues of major companies are estimated (in case not available) based on industry benchmark, approximate number of employees, product portfolio, and primary interviews revenues are gathered. Further revenue from target product/service segment is assessed to avoid overshooting of market statistics. In case of heavy deviations between supply and demand side values, all thes steps are repeated to achieve synchronization.
We follow an iterative model, wherein we share our research findings with Subject Matter Experts (SME’s) and Key Opinion Leaders (KOLs) until consensus view of the market is not formulated – this model negates any drastic deviation in the opinions of experts. Only validated and universally acceptable research findings are quoted in our reports.
We have important check points that we use to validate our research findings – which we call – data triangulation, where we validate the information, we generate from secondary sources with primary interviews and then we re-validate with our internal data bases and Subject matter experts. This comprehensive model enables us to deliver high quality, reliable data in shortest possible time.
 احصل على عينة مجانية لهذا التقرير