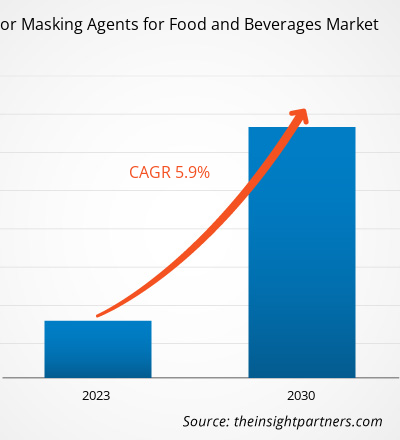
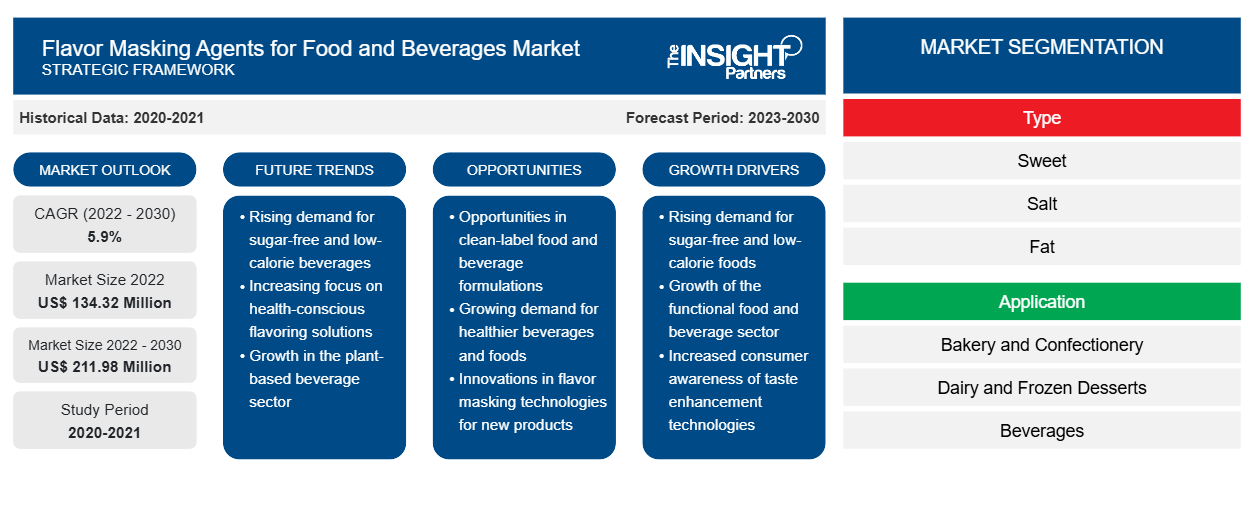
[تقرير بحثي] من المتوقع أن ينمو حجم سوق عوامل إخفاء النكهة للأغذية والمشروبات من 134.32 مليون دولار أمريكي في عام 2022 إلى 211.98 مليون دولار أمريكي بحلول عام 2030. ومن المتوقع أن يسجل السوق معدل نمو سنوي مركب بنسبة 5.9٪ من عام 2022 إلى عام 2030.
رؤى السوق ووجهة نظر المحلل:
عوامل إخفاء النكهة هي مكونات أو إضافات تستخدم لإخفاء النكهات غير المرغوب فيها في الأطعمة والمشروبات المختلفة مثل المخبوزات والحلويات ومنتجات الألبان والحلويات المجمدة وبدائل اللحوم وبدائل الألبان ومنتجات اللحوم والمأكولات البحرية والوجبات الخفيفة اللذيذة. تعمل العوامل على تحسين مذاق الطعام عن طريق إخفاء النكهات غير المرغوب فيها مثل المرارة والحلاوة والملوحة والحموضة ونكهة الدهون والنوتات غير المرغوب فيها المعدنية والطباشير والنكهات الفولية والعشبية وغيرها. تشمل عوامل إخفاء النكهة أيضًا أنظمة نكهة مختلفة، بما في ذلك منظمات التذوق ومثبطات المرارة ومثبطات الحلاوة ومنظمات الدهون.
محركات النمو والتحديات:
تحتوي العديد من الأطعمة المدعمة المصنعة مثل منتجات الألبان ومنتجات اللحوم ومنتجات المخابز والحلويات على فيتامينات وبروتينات ومكونات وظيفية أخرى ذات روائح ونكهات غير سارة. تُستخدم عوامل إخفاء النكهة على نطاق واسع في هذه المنتجات للحصول على النكهة والطعم المرغوبين. بالإضافة إلى ذلك، تسمح العوامل بتقليل محتوى السكر والملح والدهون في الأطعمة المصنعة. وبالتالي، فإن زيادة استهلاك الأطعمة المصنعة تدفع الحاجة إلى عوامل إخفاء النكهة. علاوة على ذلك، فإن الاهتمام المتزايد من جانب المستهلكين بأنماط حياة أكثر صحة يدفع الطلب على الأطعمة والمشروبات المدعمة والوظيفية وغيرها من الأطعمة والمشروبات المريحة والوظيفية، مثل المنتجات التي تحتوي على نسبة أقل من السكر. ومع ذلك، فإن الفوائد الوظيفية المعززة يمكن أن تعيق طعم ونكهات المنتج النهائي. وبالتالي، للحصول على النكهة المرغوبة، يستخدم مصنعو الأطعمة الوظيفية والمريحة عوامل إخفاء النكهة. على سبيل المثال، تُستخدم عوامل إخفاء النكهة بشكل كبير في المنتجات الغذائية القائمة على البروتين لإزالة أو تحييد النكهة غير المرغوبة أو النكهة غير المرغوبة للبروتين. وبالتالي، فإن مجموعة واسعة من تطبيقات عوامل إخفاء النكهة في مختلف الأطعمة والمشروبات تعزز نمو سوق عوامل إخفاء النكهة العالمية للأطعمة والمشروبات .
قم بتخصيص هذا التقرير ليناسب متطلباتك
ستحصل على تخصيص لأي تقرير - مجانًا - بما في ذلك أجزاء من هذا التقرير، أو تحليل على مستوى الدولة، وحزمة بيانات Excel، بالإضافة إلى الاستفادة من العروض والخصومات الرائعة للشركات الناشئة والجامعات
-
احصل على أهم اتجاهات السوق الرئيسية لهذا التقرير.ستتضمن هذه العينة المجانية تحليلاً للبيانات، بدءًا من اتجاهات السوق وحتى التقديرات والتوقعات.
تقسيم التقرير ونطاقه:
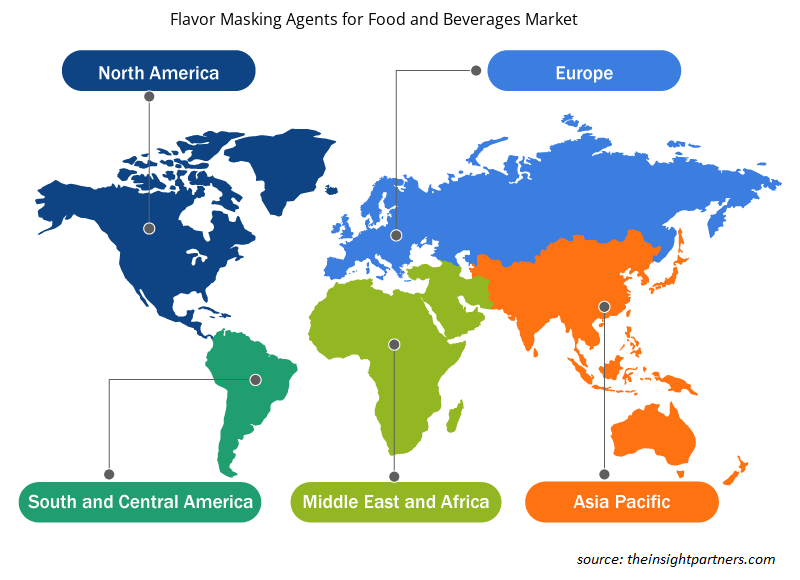
يتم تقسيم سوق عوامل إخفاء النكهة العالمية للأغذية والمشروبات على أساس النوع والتطبيق والجغرافيا. يتم تقسيم سوق عوامل إخفاء النكهة للأغذية والمشروبات، حسب النوع، إلى حلو ومالح ودهني ومر وغيرها. بناءً على التطبيق، يتم تقسيم السوق إلى المخابز والحلويات؛ والحلويات المجمدة ومنتجات الألبان ؛ والمشروبات؛ واللحوم والدواجن والمأكولات البحرية؛ وبدائل اللحوم؛ وبدائل الألبان ؛ والوجبات الجاهزة والجاهزة؛ وغيرها. يتم تقسيم سوق عوامل إخفاء النكهة للأغذية والمشروبات، بناءً على الجغرافيا، إلى أمريكا الشمالية (الولايات المتحدة وكندا والمكسيك) وأوروبا (ألمانيا وفرنسا وإيطاليا والمملكة المتحدة وروسيا وبقية أوروبا) وآسيا والمحيط الهادئ (أستراليا والصين واليابان والهند وكوريا الجنوبية وبقية آسيا والمحيط الهادئ) والشرق الأوسط وأفريقيا (جنوب أفريقيا والمملكة العربية السعودية والإمارات العربية المتحدة وبقية الشرق الأوسط وأفريقيا) وأمريكا الجنوبية والوسطى (البرازيل والأرجنتين وبقية أمريكا الجنوبية والوسطى).RTC meals; and others. The flavor masking agents for food and beverages market, based on geography, is segmented into North America (the US, Canada, and Mexico), Europe (Germany, France, Italy, the UK, Russia, and the Rest of Europe), Asia Pacific (Australia, China, Japan, India, South Korea, and the Rest of Asia Pacific), the Middle East & Africa (South Africa, Saudi Arabia, the UAE, and the Rest of Middle East & Africa), and South & Central America (Brazil, Argentina, and the Rest of South & Central America).
التحليل القطاعي:
بناءً على النوع، يتم تقسيم سوق عوامل إخفاء النكهة للأغذية والمشروبات إلى حلو ومالح ودهني ومر وغيرها. يحتل قطاع المر حصة كبيرة من السوق. ينمو الطلب على عوامل إخفاء النكهة المريرة في المقام الأول بسبب حساسية المستهلكين للمرارة وتوسع المنتجات ذات المكونات المريرة. مع تطور تفضيلات المستهلكين وتنوع السوق مع إدخال المشروبات الجديدة والأطعمة الوظيفية والأطعمة والمشروبات المدعمة والمنتجات التي تركز على الصحة، تزداد الحاجة إلى عوامل إخفاء النكهة المريرة الفعالة. تمكن هذه العوامل من إنشاء مجموعة أوسع من المنتجات اللذيذة التي تلبي احتياجات شرائح المستهلكين المختلفة، وتلبية الطلب على خيارات أفضل مذاقًا وصديقة للمرارة في السوق. تدفع هذه العوامل نمو السوق لقطاع المر.
التحليل الإقليمي:
بناءً على الجغرافيا، يتم تقسيم سوق عوامل إخفاء النكهة للأغذية والمشروبات إلى خمس مناطق رئيسية - أمريكا الشمالية وأوروبا وآسيا والمحيط الهادئ وأمريكا الجنوبية والوسطى والشرق الأوسط وأفريقيا. سيطرت منطقة آسيا والمحيط الهادئ على سوق عوامل إخفاء النكهة العالمية للأغذية والمشروبات؛ حيث بلغت قيمة السوق في هذه المنطقة 50.557 مليون دولار أمريكي في عام 2022. ومن المتوقع أن يسجل السوق في أوروبا معدل نمو سنوي مركب بنسبة 6.8٪ خلال الفترة المتوقعة. تشهد البلدان المتقدمة والنامية في منطقة آسيا والمحيط الهادئ نموًا في التحضر، إلى جانب ارتفاع عدد سكان الطبقة المتوسطة، مما يوفر العديد من الفرص للاعبين في السوق. أدت الطبيعة المتنوعة والمتعددة الثقافات لمنطقة آسيا والمحيط الهادئ إلى قيود وتفضيلات غذائية. تشير المنطقة إلى زيادة الطلب على المنتجات الغذائية النباتية إلى جانب زيادة في عدد السكان النباتيين. تلعب عوامل إخفاء النكهة دورًا حاسمًا في تمكين الشركات المصنعة من إنشاء منتجات غذائية نباتية بمجموعات نكهات مثيرة ومبتكرة، مما يعزز جاذبية منتجاتها لقاعدة أوسع من المستهلكين. وتدفع هذه العوامل نمو عوامل إخفاء النكهة في سوق الأغذية والمشروبات في منطقة آسيا والمحيط الهادئ.
تمثل أمريكا الشمالية ثاني أكبر حصة من عوامل إخفاء النكهة في سوق الأغذية والمشروبات، حيث تمثل ما يقرب من 25% من حصة السوق. يتزايد الطلب على عوامل إخفاء النكهة مع تزايد وعي المستهلكين بصحتهم والبحث بنشاط عن منتجات غذائية منخفضة السكر والدهون والصوديوم والملح. أدى هذا الارتفاع في الطلب على المنتجات منخفضة الملح والسكر إلى زيادة استخدام المحليات الصناعية وبدائل السكر، والتي يمكن أن يكون لها مذاق مميز بعد تناولها، مما يتطلب إخفاء النكهة. وبسبب هذا العامل، يتزايد الطلب على عوامل إخفاء النكهة في أمريكا الشمالية.
تطورات الصناعة والفرص المستقبلية:
فيما يلي قائمة بالمبادرات التي اتخذها اللاعبون الرئيسيون العاملون في سوق عوامل إخفاء النكهة للأغذية والمشروبات:
- في يونيو 2023، أعلنت كيري عن إطلاق مجموعة حلول Tastesense Advanced من الجيل التالي والتي تهدف إلى إعادة تعريف سوق المنتجات منخفضة السكر وخالية السكر من خلال تقديم حلاوة لا مثيل لها وشعور كامل الجسم في الفم، بالإضافة إلى فوائد الاستدامة.
تأثير جائحة كوفيد-19:
أثرت جائحة كوفيد-19 سلبًا على جميع الصناعات تقريبًا في مختلف البلدان. أعاقت عمليات الإغلاق والقيود المفروضة على السفر وإغلاق الأعمال في أمريكا الشمالية وأوروبا ومنطقة آسيا والمحيط الهادئ وأمريكا الجنوبية والوسطى والشرق الأوسط وأفريقيا نمو العديد من شركات تصنيع الأغذية والمشروبات العاملة في صناعات المخابز والحلويات ومنتجات الألبان والحلويات المجمدة واللحوم ومنتجات الألبان البديلة. أدى إغلاق وحدات التصنيع إلى اضطراب سلاسل التوريد العالمية وأنشطة الإنتاج وجداول التسليم ومبيعات المنتجات الأساسية وغير الأساسية. شهدت العديد من الشركات تأخيرات في تسليم المنتجات وانخفاضًا في مبيعات منتجاتها في عام 2020، مما أعاق عوامل إخفاء النكهة لسوق الأغذية والمشروبات. كما أدى نقص القوى العاملة والإمدادات المحدودة من المواد الخام إلى توقف العمليات والعمليات في جميع أنحاء العالم أثناء جائحة كوفيد-19. أثرت هذه العوامل سلبًا على نمو السوق في الجائحة.
مع تحول تركيز المستهلكين على تبني الأطعمة النباتية بسبب زيادة اتجاهات النظام النباتي وزيادة المخاوف الصحية والعافية خلال هذه الأزمة الصحية، زاد الطلب على عوامل إخفاء النكهة في السنوات القليلة الماضية. في عام 2021، استأنفت العديد من الاقتصادات عملياتها حيث ألغت العديد من الحكومات القيود المفروضة سابقًا، مما أثر بشكل إيجابي على السوق العالمية. علاوة على ذلك، سُمح للمصنعين بالعمل بكامل طاقتهم، مما ساعدهم على التغلب على فجوات الطلب والعرض.
رؤى إقليمية حول عوامل إخفاء النكهة في سوق الأغذية والمشروبات
لقد قام المحللون في Insight Partners بشرح الاتجاهات والعوامل الإقليمية المؤثرة على سوق عوامل إخفاء النكهة للأغذية والمشروبات طوال فترة التوقعات بشكل شامل. يناقش هذا القسم أيضًا قطاعات سوق عوامل إخفاء النكهة للأغذية والمشروبات والجغرافيا في جميع أنحاء أمريكا الشمالية وأوروبا ومنطقة آسيا والمحيط الهادئ والشرق الأوسط وأفريقيا وأمريكا الجنوبية والوسطى.

- احصل على البيانات الإقليمية المحددة لعوامل إخفاء النكهة لسوق الأغذية والمشروبات
نطاق تقرير سوق عوامل إخفاء النكهة للأغذية والمشروبات
| سمة التقرير | تفاصيل |
|---|---|
| حجم السوق في عام 2022 | 134.32 مليون دولار أمريكي |
| حجم السوق بحلول عام 2030 | 211.98 مليون دولار أمريكي |
| معدل النمو السنوي المركب العالمي (2022 - 2030) | 5.9% |
| البيانات التاريخية | 2020-2021 |
| فترة التنبؤ | 2023-2030 |
| القطاعات المغطاة |
حسب النوع
|
| المناطق والدول المغطاة |
أمريكا الشمالية
|
| قادة السوق وملفات تعريف الشركات الرئيسية |
|
كثافة اللاعبين في السوق: فهم تأثيرها على ديناميكيات الأعمال
يشهد سوق عوامل إخفاء النكهة في الأطعمة والمشروبات نموًا سريعًا، مدفوعًا بالطلب المتزايد من المستخدم النهائي بسبب عوامل مثل تفضيلات المستهلك المتطورة والتقدم التكنولوجي والوعي المتزايد بفوائد المنتج. ومع ارتفاع الطلب، تعمل الشركات على توسيع عروضها والابتكار لتلبية احتياجات المستهلكين والاستفادة من الاتجاهات الناشئة، مما يؤدي إلى زيادة نمو السوق.
تشير كثافة اللاعبين في السوق إلى توزيع الشركات أو المؤسسات العاملة في سوق أو صناعة معينة. وهي تشير إلى عدد المنافسين (اللاعبين في السوق) الموجودين في مساحة سوق معينة نسبة إلى حجمها أو قيمتها السوقية الإجمالية.
الشركات الرئيسية العاملة في سوق عوامل إخفاء النكهة للأغذية والمشروبات هي:
- شركة سينسينت تكنولوجيز
- شركة فيرمينيش الدولية
- شركة تيت آند لايل المحدودة
- شركة آرتشر دانييلز ميدلاند
- مجموعة كيري المحدودة
إخلاء المسؤولية : الشركات المذكورة أعلاه ليست مرتبة بأي ترتيب معين.

- احصل على نظرة عامة على أهم اللاعبين الرئيسيين في سوق عوامل إخفاء النكهة للأغذية والمشروبات
المنافسة والشركات الرئيسية:
تعد شركة Sensient Technologies Corp، وFirmenich International SA، وTate & Lyle Plc، وArcher-Daniels-Midland Co، وKerry Group Plc، وCarmi Flavor & Fragrance Co Inc، وSynergy Flavors Inc، وVirginia Dare Extract Co Inc، وGEO Specialty Chemicals Inc، وKoninklijke DSM NV من بين اللاعبين البارزين الذين يعملون في سوق عوامل إخفاء النكهة العالمية للأغذية والمشروبات. يتبنى هؤلاء اللاعبون في السوق مبادرات تطوير استراتيجية لتوسيع أعمالهم، مما يؤدي إلى زيادة نمو سوق عوامل إخفاء النكهة للأغذية والمشروبات.
- التحليل التاريخي (سنتان)، سنة الأساس، التوقعات (7 سنوات) مع معدل النمو السنوي المركب
- تحليل PEST و SWOT
- حجم السوق والقيمة / الحجم - عالمي، إقليمي، بلد
- الصناعة والمنافسة
- مجموعة بيانات إكسل
التقارير الحديثة
تقارير ذات صلة
شهادات العملاء
سبب الشراء
- اتخاذ قرارات مدروسة
- فهم ديناميكيات السوق
- تحليل المنافسة
- رؤى العملاء
- توقعات السوق
- تخفيف المخاطر
- التخطيط الاستراتيجي
- مبررات الاستثمار
- تحديد الأسواق الناشئة
- تحسين استراتيجيات التسويق
- تعزيز الكفاءة التشغيلية
- مواكبة التوجهات التنظيمية


 احصل على عينة مجانية ل - عوامل إخفاء النكهة في سوق الأغذية والمشروبات