نظرة عامة على سوق البنية التحتية لخطوط أنابيب الغاز والنمو والاتجاهات والتحليل وتقرير البحث (2022-2030)
البيانات التاريخية : 2020-2021 | سنة الأساس : 2022 | فترة التنبؤ : 2022-2030حجم سوق البنية التحتية لخطوط أنابيب الغاز وتوقعاته (2020-2030)، والحصة العالمية والإقليمية، والاتجاهات، وفرص النمو. يغطي التقرير: حسب التشغيل (النقل والتوزيع)، والمعدات (خطوط الأنابيب، ومحطات الضاغط، ومنصات القياس، وغيرها)، والتطبيق (برية وبحرية) والجغرافيا.
- تاريخ التقرير : Jan 2024
- رمز التقرير : TIPRE00029705
- الفئة : الطاقة والقوة
- الحالة : نُشرت
- تنسيقات التقارير المتاحة :


- عدد الصفحات : 177
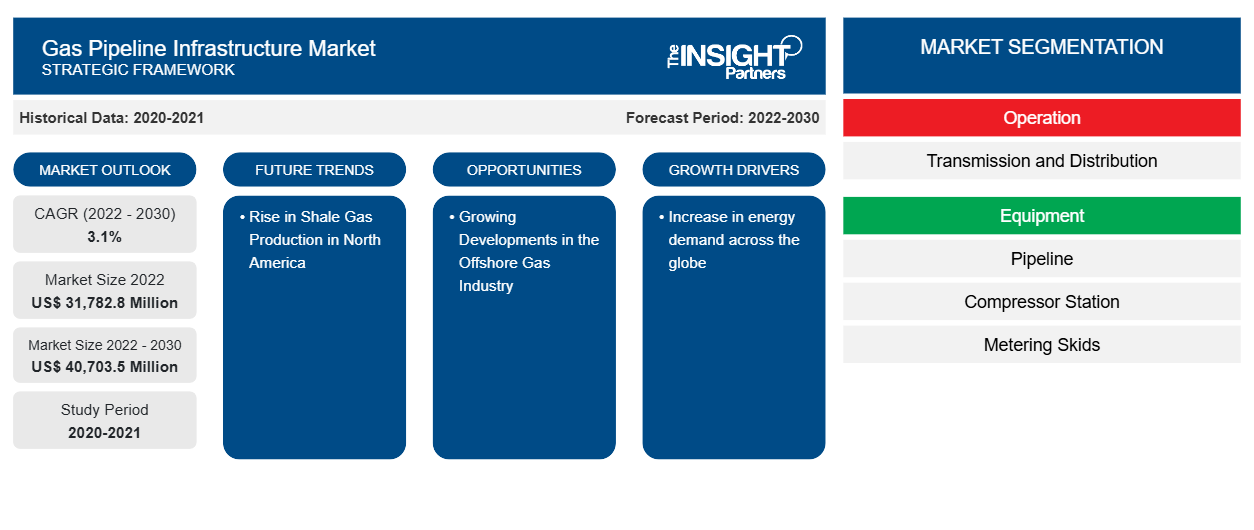
من المتوقع أن يصل حجم سوق البنية التحتية لخطوط أنابيب الغاز إلى 40،703.5 مليون دولار أمريكي بحلول عام 2030 من 31،782.8 مليون دولار أمريكي في عام 2022. ومن المتوقع أن يسجل السوق معدل نمو سنوي مركب بنسبة 3.1٪ في الفترة 2022-2030.
تحليل سوق البنية التحتية لخطوط أنابيب الغاز
إن سوق الغاز الطبيعي ديناميكي للغاية ويتطلب السيولة والمرونة والشفافية للعمل بشكل فعال. وبالتالي، هناك حاجة إلى مصادر متعددة للإمداد ومستخدمين متعددين وبنية أساسية شاملة للنقل والتوزيع. وقد تطورت سوق الغاز الطبيعي بشكل كبير في الولايات المتحدة وأوروبا ومنطقة آسيا والمحيط الهادئ، ومن المتوقع أن يدفع ذلك نمو البنية الأساسية لخطوط أنابيب الغاز مع ارتفاع الطلب على الغاز في المستقبل.
نظرة عامة على سوق البنية التحتية لخطوط أنابيب الغاز
يتضمن نظام البنية التحتية لخطوط أنابيب الغاز مرحلة الإنتاج، حيث يتم استخراج الغاز الطبيعي من الخزانات الجوفية. تستخدم شركات الاستكشاف والإنتاج تقنيات الحفر لاستخراج الغاز الطبيعي الخام. بمجرد استخراجه، تتم معالجة الغاز عادةً لإزالة الشوائب ثم ضغطه للنقل. تتضمن مرحلة الإنتاج اعتبارات العوامل الجيولوجية وتقنيات الاستخراج وتقييمات الأثر البيئي. اللاعبون الأساسيون المشاركون في إنتاج الغاز الطبيعي هم Royal Dutch Shell و ExxonMobil Corporation و Gazprom و ConocoPhillips و TotalEnergie . يشمل اللاعبون الرئيسيون في شبكة نقل خطوط أنابيب الغاز Kinder Morgan Inc. و Enbridge Inc. وTC Energy Corporation و Pembina Pipeline Corporation وTexas Gas Transmission LLC وغيرها.
قم بتخصيص هذا التقرير ليناسب متطلباتك
ستحصل على تخصيص لأي تقرير - مجانًا - بما في ذلك أجزاء من هذا التقرير، أو تحليل على مستوى الدولة، وحزمة بيانات Excel، بالإضافة إلى الاستفادة من العروض والخصومات الرائعة للشركات الناشئة والجامعات
سوق البنية التحتية لخطوط أنابيب الغاز: رؤى استراتيجية
-
احصل على أهم اتجاهات السوق الرئيسية لهذا التقرير.ستتضمن هذه العينة المجانية تحليلاً للبيانات، بدءًا من اتجاهات السوق وحتى التقديرات والتوقعات.
محركات وفرص سوق البنية التحتية لخطوط أنابيب الغاز
من المتوقع أن يكون ارتفاع الطلب على الطاقة في جميع أنحاء العالم هو المحرك الرئيسي لسوق البنية التحتية لخطوط أنابيب الغاز
إن الزيادة في عدد السكان والتوسع الحضري المتزايد من العوامل التي تعزز استهلاك الطاقة في جميع أنحاء العالم. يتمتع الغاز الطبيعي بإمكانات التطبيق في توليد الكهرباء، مما يعزز الطلب عليه. وعلاوة على ذلك، وبسبب عدم اليقين المتزايد بشأن الطاقة في أوروبا بسبب الحرب بين روسيا وأوكرانيا، تعمل حكومات العديد من البلدان أيضًا على تعزيز استخدام الغاز الطبيعي. وبالتالي، فإن الزيادة في الطلب على الطاقة تغذي نمو سوق البنية التحتية لخطوط أنابيب الغاز.
ارتفاع إنتاج الغاز الصخري في أميركا الشمالية
لقد نجحت أمريكا الشمالية في ترسيخ مكانتها كواحدة من أكبر منتجي الغاز الصخري في العالم. وتعد كندا خامس أكبر منتج ورابع أكبر مصدر للغاز الطبيعي في العالم. وتشمل حقول الغاز الصخري الرئيسية في كندا حوض هورن ريفر ومونتني في شمال شرق كولومبيا البريطانية، وزيت يوتيكا في كيبيك، ومجموعة كولورادو في ألبرتا وساسكاتشوان، وزيت هورتون بلاف في نيو برونزويك ونوفا سكوشا. وتعمل حالة عدم اليقين بشأن الطاقة بسبب الاضطرابات الجيوسياسية على تعزيز إنتاج الغاز الصخري في أمريكا الشمالية، وهو ما من المرجح أن يخلق فرصًا كبيرة لنمو سوق البنية التحتية لخطوط أنابيب الغاز في السنوات القادمة.
تقرير تحليل تجزئة سوق البنية التحتية لخطوط أنابيب الغاز
إن القطاعات الرئيسية التي ساهمت في اشتقاق تحليل سوق البنية التحتية لخطوط أنابيب الغاز هي التشغيل والمعدات والتطبيق.
- بناءً على التشغيل، تم تقسيم سوق البنية التحتية لخطوط أنابيب الغاز إلى النقل والتوزيع. احتل قطاع التوزيع حصة سوقية أكبر في عام 2022.
- من حيث المعدات، تم تقسيم السوق إلى خطوط الأنابيب ومحطات الضاغط ومنصات القياس وغيرها. وقد هيمن قطاع خطوط الأنابيب على السوق في عام 2022.
- من حيث التطبيق، تم تقسيم السوق إلى برية وبحرية. سيطر القطاع البري على السوق في عام 2022.
تحليل حصة سوق البنية التحتية لخطوط أنابيب الغاز حسب المنطقة الجغرافية
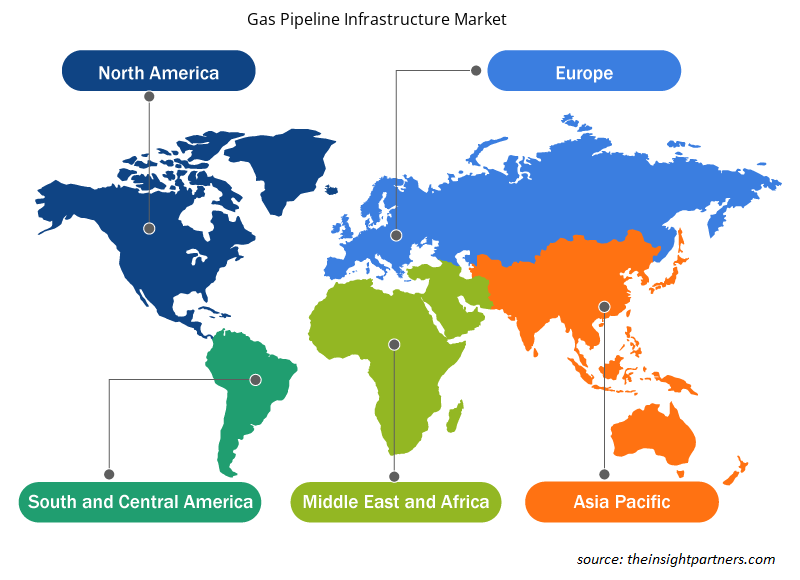
ينقسم النطاق الجغرافي لتقرير سوق البنية التحتية لخطوط أنابيب الغاز بشكل أساسي إلى خمس مناطق: أمريكا الشمالية وأوروبا وآسيا والمحيط الهادئ والشرق الأوسط وأفريقيا وأمريكا الجنوبية.
أمريكا الشمالية هي واحدة من أكبر الدول المصدرة للغاز. إن الطلب المتزايد على الطاقة والتطبيق المتزايد للغاز الطبيعي يعززان تطوير سوق البنية التحتية لخطوط أنابيب الغاز في أمريكا الشمالية. في عام 2022، أظهرت الولايات المتحدة أعلى قدرة على إنتاج الغاز الطبيعي، تليها كندا والمكسيك. تعد حقول Ixachi وCoulomb Phase 2 وQuesqui وNejo (IEPC) وLeo وMay وKoban وPowerball من بين حقول إنتاج الغاز الطبيعي في أمريكا الشمالية. يقع مصنع Ixachi في فيراكروز بالمكسيك، وقد أنتج 618.09 مليون قدم مكعب يوميًا في عام 2022. كما من المتوقع أن يعزز العدد المتزايد من المبادرات الحكومية والتمويل لتطوير البنية التحتية لخطوط أنابيب الغاز سوق البنية التحتية لخطوط أنابيب الغاز خلال الفترة المتوقعة.
رؤى إقليمية حول سوق البنية التحتية لخطوط أنابيب الغاز
لقد قام المحللون في Insight Partners بشرح الاتجاهات والعوامل الإقليمية المؤثرة على سوق البنية التحتية لخطوط أنابيب الغاز طوال فترة التوقعات بشكل شامل. يناقش هذا القسم أيضًا قطاعات سوق البنية التحتية لخطوط أنابيب الغاز والجغرافيا في جميع أنحاء أمريكا الشمالية وأوروبا ومنطقة آسيا والمحيط الهادئ والشرق الأوسط وأفريقيا وأمريكا الجنوبية والوسطى.
- احصل على البيانات الإقليمية المحددة لسوق البنية التحتية لخطوط أنابيب الغاز
نطاق تقرير سوق البنية التحتية لخطوط أنابيب الغاز
| سمة التقرير | تفاصيل |
|---|---|
| حجم السوق في عام 2022 | 31,782.8 مليون دولار أمريكي |
| حجم السوق بحلول عام 2030 | 40,703.5 مليون دولار أمريكي |
| معدل النمو السنوي المركب العالمي (2022 - 2030) | 3.1% |
| البيانات التاريخية | 2020-2021 |
| فترة التنبؤ | 2022-2030 |
| القطاعات المغطاة |
حسب العملية
|
| المناطق والدول المغطاة |
أمريكا الشمالية
|
| قادة السوق وملفات تعريف الشركات الرئيسية |
|
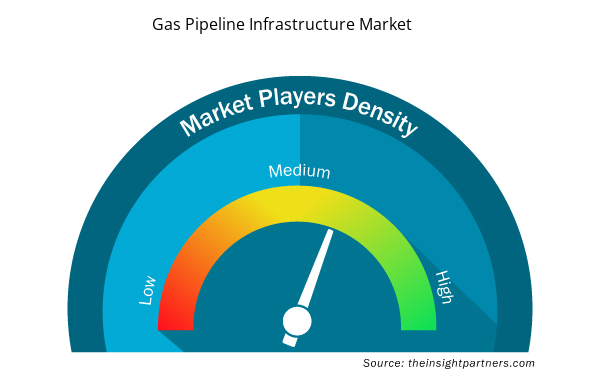
كثافة اللاعبين في سوق البنية التحتية لخطوط أنابيب الغاز: فهم تأثيرها على ديناميكيات الأعمال
يشهد سوق البنية التحتية لخطوط أنابيب الغاز نموًا سريعًا، مدفوعًا بالطلب المتزايد من المستخدم النهائي بسبب عوامل مثل تفضيلات المستهلكين المتطورة والتقدم التكنولوجي والوعي المتزايد بفوائد المنتج. ومع ارتفاع الطلب، تعمل الشركات على توسيع عروضها والابتكار لتلبية احتياجات المستهلكين والاستفادة من الاتجاهات الناشئة، مما يؤدي إلى زيادة نمو السوق.
تشير كثافة اللاعبين في السوق إلى توزيع الشركات أو المؤسسات العاملة في سوق أو صناعة معينة. وهي تشير إلى عدد المنافسين (اللاعبين في السوق) الموجودين في مساحة سوق معينة نسبة إلى حجمها أو قيمتها السوقية الإجمالية.
الشركات الرئيسية العاملة في سوق البنية التحتية لخطوط أنابيب الغاز هي:
- شركة إنبريدج
- شركة كيندر مورجان
- شركة تي سي للطاقة
- شركة بيمبينا لخطوط الأنابيب
- مجموعة سينوبيك
- البنية التحتية لخطوط الأنابيب المحدودة
إخلاء المسؤولية : الشركات المذكورة أعلاه ليست مرتبة بأي ترتيب معين.
- احصل على نظرة عامة على أهم اللاعبين الرئيسيين في سوق البنية التحتية لخطوط أنابيب الغاز
أخبار سوق البنية التحتية لخطوط أنابيب الغاز والتطورات الأخيرة
يتم تقييم سوق البنية التحتية لخطوط أنابيب الغاز من خلال جمع البيانات النوعية والكمية بعد البحث الأولي والثانوي، والذي يتضمن منشورات الشركات المهمة وبيانات الجمعيات وقواعد البيانات. فيما يلي قائمة بالتطورات في سوق البنية التحتية لخطوط أنابيب الغاز والاستراتيجيات:
- في فبراير 2023، وقعت شركة Enagas SA اتفاقية مع شركة Reganosa دفعت بموجبها شركة Enagas مبلغ 58.14 مليون دولار أمريكي لشركة Reganosa لشراء شبكة من خطوط أنابيب الغاز الطبيعي بطول 130 كيلومترًا. ويعتمد التشغيل الفعال لسوق الغاز الأيبيرية وأمن الإمدادات على هذه الشبكة. (المصدر: شركة Enagas SA، بيان صحفي/موقع الشركة على الويب/النشرة الإخبارية)
- في أغسطس 2022، تم الاتفاق على اتفاقية استراتيجية بين شركة TC Energy Corp وشركة CFE، وهي شركة المرافق الكهربائية المملوكة للدولة في المكسيك، بهدف تسريع تطوير البنية التحتية للغاز الطبيعي في الأجزاء الوسطى والجنوبية الشرقية من البلاد. وفيما يتعلق بأصول خط أنابيب الغاز الطبيعي في وسط المكسيك، قررت شركة TC Energy وشركة CFE دمج اتفاقيات الاستلام أو الدفع السابقة التي تعهدت بها شركة TGNH التابعة لشركة TC Energy ومقرها المكسيك وشركة CFE في اتفاقية استلام أو دفع واحدة بسعر الدولار الأمريكي والتي ستستمر حتى عام 2055. كما ستخضع مشاريع البنية التحتية الجديدة ذات الصلة التي يتم التخطيط لها بالتعاون مع شركة CFE لاتفاقية الاستلام أو الدفع الجديدة هذه. (المصدر: شركة TC Energy، بيان صحفي/موقع الشركة على الويب/النشرة الإخبارية)
تقرير سوق البنية التحتية لخطوط أنابيب الغاز - التغطية والنتائج المتوقعة
يوفر تقرير "حجم سوق البنية التحتية لخطوط أنابيب الغاز والتوقعات (2020-2030)" تحليلاً مفصلاً للسوق يغطي المجالات التالية:
- حجم السوق والتوقعات على المستويات العالمية والإقليمية والوطنية لجميع قطاعات السوق الرئيسية التي يغطيها النطاق
- ديناميكيات السوق مثل المحركات والقيود والفرص الرئيسية
- الاتجاهات المستقبلية الرئيسية
- تحليل مفصل لـ PEST
- تحليل السوق العالمي والإقليمي الذي يغطي اتجاهات السوق الرئيسية واللاعبين الرئيسيين واللوائح والتطورات الأخيرة في السوق
- تحليل المشهد الصناعي والمنافسة الذي يغطي تركيز السوق، وتحليل خريطة الحرارة، واللاعبين البارزين، والتطورات الأخيرة
- ملفات تعريف تفصيلية للشركة مع تحليل SWOT

نيفيديتا خبيرة أبحاث مُتميزة، تتمتع بخبرة تزيد عن 9 سنوات في أبحاث السوق واستشارات الأعمال. تشغل حاليًا منصب مديرة مشاريع في مجال تكنولوجيا المعلومات والاتصالات لدى شركة "ذا إنسايت بارتنرز"، وتتمتع بخبرة واسعة في إدارة وتنفيذ مهام الأبحاث المُجمعة والمُخصصة والقائمة على الاشتراكات والاستشارات في مختلف قطاعات التكنولوجيا.
بفضل سجلها الحافل في تقديم تحليلات قائمة على البيانات ورؤى عملية، ساهمت نيفيديتا بشكل رئيسي في العديد من المشاريع الحيوية. يشمل عملها تنفيذ المشاريع من البداية إلى النهاية، بدءًا من فهم أهداف العملاء، وتحليل اتجاهات السوق، وصولًا إلى استخلاص التوصيات الاستراتيجية. وقد تعاونت على نطاق واسع مع شركات رائدة في مجال تكنولوجيا المعلومات والاتصالات، مما ساعدها على تحديد فرص السوق ومواكبة تحولات القطاع.
تحمل نيفيديتا ماجستير إدارة أعمال في الإدارة من شركة "آي إم إس" في دهرادون. قبل انضمامها إلى "ذا إنسايت بارتنرز"، اكتسبت خبرة قيّمة في شركتي "ماركتس آند ماركتس" و"فيوتشر ماركت إنسايتس" في بونا، حيث شغلت مناصب بحثية مُختلفة وبنت أساسًا قويًا في تحليل القطاع والتفاعل مع العملاء.
- التحليل التاريخي (سنتان)، سنة الأساس، التوقعات (7 سنوات) مع معدل النمو السنوي المركب
- تحليل PEST و SWOT
- حجم السوق والقيمة / الحجم - عالمي، إقليمي، بلد
- الصناعة والمنافسة
- مجموعة بيانات إكسل
التقارير الحديثة
تقارير ذات صلة
شهادات العملاء
تقرير سوق أنظمة SCADA من Insight Partners شامل، ويقدم رؤى قيّمة حول الاتجاهات الحالية والتوقعات المستقبلية. تميّز الفريق باحترافية عالية وسرعة في الاستجابة ودعم مستمر طوال الوقت. نحن راضون جدًا ونوصي بشدة بخدماتهم.
ران كيديم شريك, شركة ريالي تكنولوجيز المحدودةطلبتُ تقريرًا عن سوق برمجيات محدد، وأعدّه الفريق في غضون أيام قليلة. كانت المعلومات ذات صلة وثيقة وعرضها جيد. ثم طلبتُ بعض التعديلات والإضافات على التقرير. وكان الفريق متجاوبًا للغاية، وحصلتُ على التقرير النهائي في أقل من أسبوع.
جان هيرفيه جين رئيس مجلس الإدارة, فيوتشر أناليتيكاعملنا مع شركة "إنسايت بارتنرز" لإجراء دراسة سوقية وتوقعات مهمة. زودونا برؤى واضحة حول الفرص والمخاطر، مما ساعدنا في صياغة خططنا. كانت أبحاثهم سهلة الاستخدام ومبنية على بيانات دقيقة، مما ساعدنا على اتخاذ قرارات ذكية وواثقة. نوصي بهم بشدة.
بيوش ناجبال نائب الرئيس الأول, شعاع عالي عالميقدّمت شركة Insight Partners أبحاثًا سوقية ثاقبة ومنظمة جيدًا بخبرة واسعة في هذا المجال. تميّز فريقهم بالاحترافية وسرعة الاستجابة طوال الوقت. وسهّل موقعهم الإلكتروني سهل الاستخدام الوصول إلى تقارير القطاع. نوصي بهم بشدة لخدمات بحثية موثوقة وعالية الجودة.
يوكيهيكو أداتشي المدير التنفيذي, ديب بلو، ذ.م.م.هذه أول مرة أشتري فيها تقرير سوق من The Insight Partners. رغم أنني كنت مترددًا في البداية، إلا أنني زرت موقعهم الإلكتروني وشعرت براحة أكبر للمخاطرة وشراء تقرير السوق. أنا راضٍ تمامًا عن جودة التقرير وخدمة العملاء. كانت لديّ عدة أسئلة وتعليقات حول التقرير الأولي، ولكن بعد بضع محادثات عبر البريد الإلكتروني مع محللهم، أعتقد أن لديّ تقريرًا يمكنني استخدامه كمدخل لعملية التخطيط الاستراتيجي لدينا. شكرًا جزيلاً لكم على تخصيص وقتكم الإضافي وجعل هذه التجربة إيجابية. سأوصي بخدماتكم للآخرين بالتأكيد، وستكونون أول من ألجأ إليه عندما نحتاج إلى المزيد من بيانات السوق.
جون سوزوكي الرئيس والرئيس التنفيذي وعضو مجلس الإدارة, بي كيه تكنولوجيزأود أن أقدّر دعمكم واحترافيتكم في الاستجابة لطلبي للحصول على معلومات بشأن سوق التشخيص المخبري للأمراض المعدية في نيجيريا. كما أُقدّر صبركم وتوجيهكم، واستعدادكم لتقديم خصم، مما مكّننا في النهاية من إتمام الصفقة. أتطلع إلى التعامل مع "ذا إنسايت بارتنرز" مستقبلًا، كل ذلك بفضل الانطباع الذي تركتموه لديّ نتيجةً لهذا اللقاء الأول.
الدكتور تشيجيوك أونيا المدير الإداري, شركة باينكريست للرعاية الصحية المحدودةسبب الشراء
- اتخاذ قرارات مدروسة
- فهم ديناميكيات السوق
- تحليل المنافسة
- رؤى العملاء
- توقعات السوق
- تخفيف المخاطر
- التخطيط الاستراتيجي
- مبررات الاستثمار
- تحديد الأسواق الناشئة
- تحسين استراتيجيات التسويق
- تعزيز الكفاءة التشغيلية
- مواكبة التوجهات التنظيمية


 احصل على عينة مجانية ل - سوق البنية التحتية لخطوط أنابيب الغاز