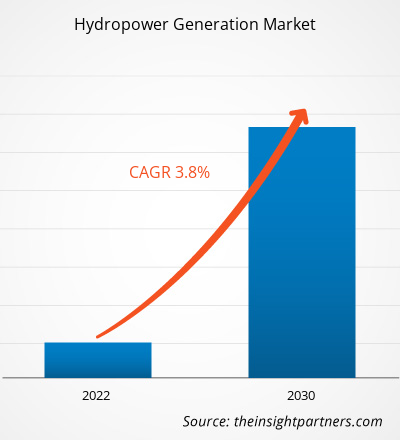
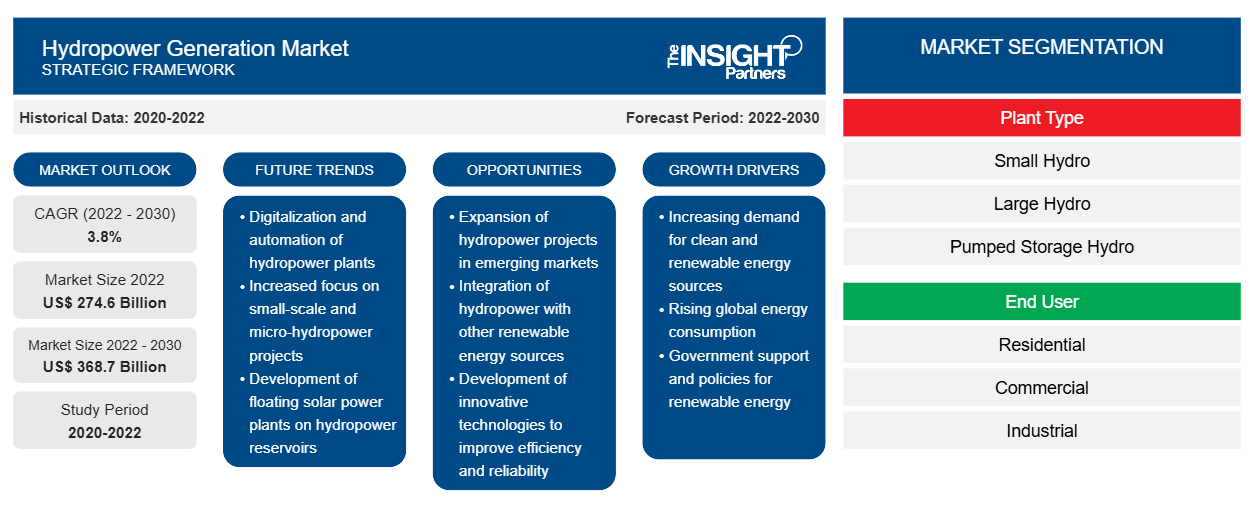
[تقرير بحثي] تم تقييم حجم سوق توليد الطاقة الكهرومائية بنحو 274.6 مليار دولار أمريكي في عام 2022 ومن المتوقع أن يصل إلى 368.7 مليار دولار أمريكي بحلول عام 2030؛ ومن المتوقع أن ينمو بمعدل نمو سنوي مركب قدره 3.8٪ خلال الفترة 2022-2030.
وجهة نظر المحلل:
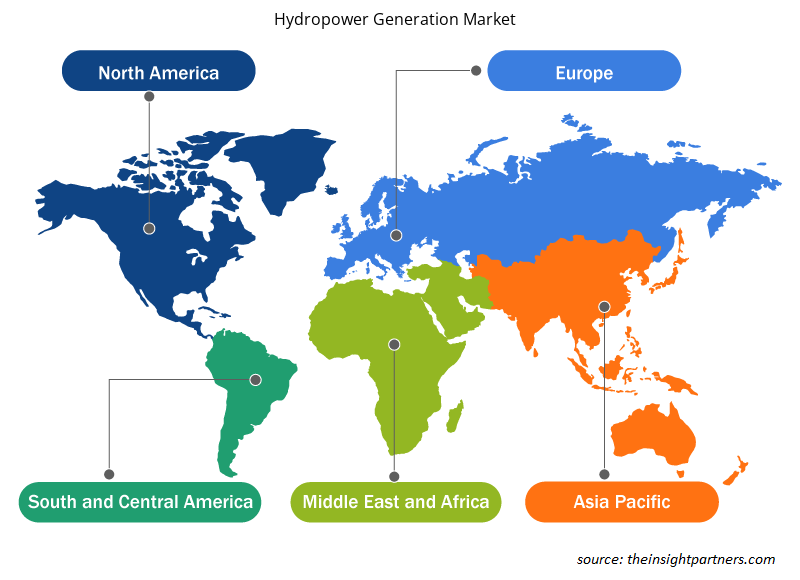
يركز نطاق تقرير سوق توليد الطاقة الكهرومائية العالمي على خمس مناطق رئيسية - أمريكا الشمالية وأوروبا وآسيا والمحيط الهادئ (APAC) والشرق الأوسط وأفريقيا (MEA) وأمريكا الجنوبية (SAM). يتضمن التقرير توقعات سوق توليد الطاقة الكهرومائية حسب نوع المحطة والمستخدم النهائي والمناطق / البلدان من عام 2022 إلى عام 2030. تعد الطاقة الكهرومائية حاليًا أكبر مصدر للطاقة المتجددة في العالم، لكن تغير المناخ يهدد إنتاج الطاقة من خلال الجفاف وتقلص الأنهار الجليدية والتبخر السريع. تعتمد أكثر من 35 دولة في العالم على الطاقة الكهرومائية لتلبية نصف احتياجاتها الوطنية من الكهرباء على الأقل. بالإضافة إلى ذلك، مع سعي العديد من البلدان إلى تقليل اعتمادها على الوقود الأحفوري، يتزايد استخدام الطاقة الكهرومائية بنسبة 2.1٪ كل عام. من المتوقع أن يؤدي ارتفاع الطلب على الكهرباء النظيفة، جنبًا إلى جنب مع أهداف خفض انبعاثات الكربون من قبل الحكومات الفردية في جميع أنحاء العالم، إلى تغذية نمو سوق توليد الطاقة الكهرومائية من عام 2022 إلى عام 2030.
نظرة عامة على السوق:
الطاقة الكهرومائية أو طاقة المياه هي شكل من أشكال الطاقة المتجددة التي تستخدم المياه المخزنة في السدود والتي تتدفق في الأنهار لتوليد الكهرباء في محطات الطاقة الكهرومائية. تدور المياه المتساقطة شفرات التوربين، والتي تقوم بعد ذلك بتشغيل مولد يحول الطاقة الميكانيكية للتوربين الدوار إلى طاقة كهربائية. الطاقة الكهرومائية هي جزء أساسي من توليد الكهرباء في جميع أنحاء العالم. الطاقة الكهرومائية هي واحدة من أكثر مصادر الطاقة المتجددة استخدامًا على نطاق واسع في العالم. وفقًا لوكالة الطاقة الدولية (IEA)، يمثل توليد الطاقة الكهرومائية 17٪ من إجمالي توليد الطاقة في العالم.
تختلف مرونة وسعة تخزين محطات الطاقة الكهرومائية التي تعمل بالضخ بشكل كبير عن أي تقنية أخرى. ستؤدي الحصص الأعلى من الطاقة المتجددة المتغيرة إلى تحويل وزيادة احتياجات مرونة نظام الكهرباء، وهو ما من المتوقع بدوره أن يزيد من أهمية الطاقة الكهرومائية. مع انخفاض تكاليف التشغيل وتوافر قدرات تخزين كبيرة، تعتبر محطات الطاقة الخزانية المصدر الأرخص لمرونة توليد الطاقة.
يمكن أن تكون محطات الطاقة الكهرومائية الجديدة مصدرًا حاسمًا للطاقة الفعالة من حيث التكلفة والفعالة التي توفر كهرباء مرنة منخفضة ثاني أكسيد الكربون. قبل الانخفاض الهائل في تكلفة الطاقة الشمسية الكهروضوئية وطاقة الرياح، كانت الطاقة الكهرومائية المصدر المتجدد الأكثر تنافسية للكهرباء في جميع أنحاء العالم لعقود من الزمان. وبالمقارنة مع خيارات الطاقة المتجددة الأخرى والوقود الأحفوري، يظل تطوير محطات الطاقة الكهرومائية الكبيرة الجديدة جذابًا للعديد من البلدان النامية والناشئة في آسيا وأفريقيا وأمريكا اللاتينية. لا تزال هناك إمكانات كبيرة غير مستغلة للطاقة الكهرومائية لتوفير الكهرباء المرنة وتلبية الطلب المتزايد. توفر محطات الطاقة الكهرومائية الجديدة الخيار الأكثر فعالية من حيث التكلفة لتخزين الكهرباء، وضمان أمن إمدادات الكهرباء والتكامل الموثوق والفعال من حيث التكلفة لمستويات زراعة الطاقة الشمسية الكهروضوئية وطاقة الرياح. تشمل اتجاهات سوق توليد الطاقة الكهرومائية الرئيسية تحديث محطات الطاقة الكهرومائية، والتحول في مجال الطاقة، ونشر محطات الطاقة الكهرومائية الصغيرة .
قم بتخصيص هذا التقرير ليناسب متطلباتك
ستحصل على تخصيص لأي تقرير - مجانًا - بما في ذلك أجزاء من هذا التقرير، أو تحليل على مستوى الدولة، وحزمة بيانات Excel، بالإضافة إلى الاستفادة من العروض والخصومات الرائعة للشركات الناشئة والجامعات
-
احصل على أهم اتجاهات السوق الرئيسية لهذا التقرير.ستتضمن هذه العينة المجانية تحليلاً للبيانات، بدءًا من اتجاهات السوق وحتى التقديرات والتوقعات.
محرك السوق:
تزايد إنشاء محطات الطاقة الكهرومائية
إن النمو العالمي في الطلب على الطاقة، مدفوعًا بالنمو السكاني والتصنيع، يتطلب توسيع إنتاج الطاقة. يمكن للطاقة الكهرومائية توفير جزء كبير من الكهرباء اللازمة لدعم هذا الطلب، مما يساهم في توفير إمدادات طاقة موثوقة. بالإضافة إلى ذلك، يعد أمن الطاقة عاملاً أساسيًا في دفع التوسع العالمي للطاقة الكهرومائية. تسعى الدول إلى مصادر طاقة متنوعة وموثوقة لتقليل اعتمادها على الوقود الأحفوري، وضمان إمدادات طاقة مستقرة للنمو الاقتصادي والأمن الوطني. توفر الطاقة الكهرومائية مصدرًا ثابتًا ومتسقًا للطاقة، وأقل عرضة لتقلبات الأسعار وانقطاعات العرض مقارنة بالوقود الأحفوري.
في أمريكا الشمالية والدول الأوروبية، كان النمو في توليد الكهرباء، وخاصة الطاقة الكهرومائية، محدودًا لسنوات عديدة. من ناحية أخرى، تخطط بعض الدول الآسيوية لبناء محطات طاقة كهرومائية جديدة لتلبية احتياجاتها المتزايدة من الكهرباء النظيفة. تشارك الصين والهند وباكستان ونيبال في بناء محطات الطاقة الكهرومائية، بما في ذلك محطات الطاقة الكهرومائية الصغيرة والكبيرة ومحطات الطاقة الكهرومائية المتراكمة، لضمان توفير الكهرباء الموثوقة للمستهلكين في المنطقة. بالإضافة إلى ذلك، تلعب الشركات الصينية مثل (شركة سينوهيدرو وشركة تشاينا ثري جورجيز وغيرها) دورًا مهمًا في بناء مشاريع الطاقة الكهرومائية في إفريقيا جنوب الصحراء الكبرى وأمريكا اللاتينية وجنوب شرق آسيا. إنها تمثل ما يقرب من أكثر من 50٪ من مشاريع الطاقة الكهرومائية الجديدة في المناطق المذكورة أعلاه بحلول عام 2030.hydropower energy, has been limited for many years. On the other hand, a few Asian countries are planning and constructing new hydropower plants to meet their increasing needs for clean electricity. China, India, Pakistan, and Nepal are engaged in the construction of hydropower plants, including small hydro, large hydro, and PSH, to ensure reliable electricity for the consumers in the region. In addition, the Chinese firm’s such as (Sinohydro Corporation, China Three Gorges Corporation, and others) role in the construction of hydropower projects in Sub-Saharan Africa, Latin America, and Southeast Asia plays an important role in the hydropower generation market. It accounts for approximately more than 50% of new hydropower projects in the above-mentioned regions by 2030.
التحليل القطاعي: Analysis:
بناءً على نوع المحطة، يتم تقسيم سوق توليد الطاقة الكهرومائية إلى محطات كهرومائية صغيرة ومحطات كهرومائية كبيرة ومحطات تخزين كهرومائية مضخوخة. ومن المتوقع أن تهيمن شريحة الطاقة الكهرومائية الكبيرة على سوق توليد الطاقة الكهرومائية خلال فترة التنبؤ. ومن المتوقع أن يعزز البناء الجاري لمشاريع الطاقة الكهرومائية واسعة النطاق في مناطق مثل منطقة آسيا والمحيط الهادئ وأمريكا اللاتينية نمو سوق توليد الطاقة الكهرومائية خلال فترة التنبؤ. بالإضافة إلى ذلك، من المتوقع أن تعزز الزيادة في الاستثمار والدعم الحكومي لبناء محطات الطاقة الكهرومائية في الهند السوق في السنوات القادمة. كما تدعم الولايات الهندية مثل أوتاراخاند والبنجاب والبنغال الغربية وغيرها توسع الطاقة الكهرومائية. بالإضافة إلى ذلك، تنطبق اللوائح على حل النزاعات في الوقت المناسب لمعالجة قضايا الوصول إلى الأراضي والتصاريح.hydropower generation market is segmented into small hydro, large hydro, and pumped storage hydro plants. The Large hydro segment is expected to dominate the hydropower generation market during the forecast period. The ongoing construction of large-scale hydropower projects in regions such as Asia Pacific and Latin America is anticipated to boost the hydropower generation market growth during the forecast period. In addition, an increase in investment and government support toward the construction of hydropower plants in India is anticipated to bolster the market in the coming years. Financial support, such as grants to enable this infrastructure and flood protection and policies that allow cross-border trade. The Indian states such as Uttarakhand, Punjab, West Bengal, and others also support the expansion of hydropower. In addition, regulations apply for timely dispute resolution to address land access and permitting issues.
التحليل الإقليمي:
وفقًا لتحليل سوق توليد الطاقة الكهرومائية لشركة Insight Partners، في عام 2022، سجلت منطقة آسيا والمحيط الهادئ أعلى حصة سوقية لتوليد الطاقة الكهرومائية بنسبة 38.5% ومن المتوقع أن تنمو بمعدل نمو سنوي مركب بنسبة 3.7% خلال الفترة المتوقعة، وذلك بسبب الإضافات المخطط لها والمستمرة لمحطات الطاقة الكهرومائية في السنوات القادمة. علاوة على ذلك، شكلت أوروبا وأمريكا الجنوبية 24.8% و16.8% من إجمالي حصة سوق توليد الطاقة الكهرومائية في عام 2022. تشارك البلدان في منطقة آسيا والمحيط الهادئ في تبني استراتيجيات رئيسية نحو أهداف الحد من الكربون وأمن الطاقة. لتحقيق أهداف الحد من انبعاثات الكربون لعام 2050، تتجه العديد من البلدان في المنطقة نحو توليد الطاقة الخالية من الكربون والاستفادة منها. تعد الهند ثاني أكبر دولة في سوق توليد الطاقة الكهرومائية في منطقة آسيا والمحيط الهادئ، بإجمالي تركيب يزيد عن 47 جيجاوات في عام 2022. ومن المتوقع أن يؤدي الطلب المتزايد على توليد الطاقة النظيفة في البلاد إلى تغذية نمو السوق في السنوات القادمة.
مع النمو السريع للطاقة المتجددة في منطقة آسيا والمحيط الهادئ، ستلعب الطاقة الكهرومائية وطاقة التخزين بالضخ دورًا متزايد الأهمية في دمج الطاقة المتجددة المتغيرة وضمان موثوقية نظام الطاقة. في العديد من البلدان النامية في المنطقة، لا تزال أسواق تخزين الطاقة ناشئة، ولكن هناك إمكانات هائلة للتطوير. ومن المتوقع أن تستمر سعة الطاقة الكهرومائية المركبة في تلبية الطلب المتزايد على الكهرباء في المنطقة، واستكشاف فرص تصدير الكهرباء وتعظيم فوائد مصدر الطاقة المنخفض الكربون والفعال من حيث التكلفة والمرن.
رؤى إقليمية حول سوق توليد الطاقة الكهرومائية
لقد قام المحللون في Insight Partners بشرح الاتجاهات والعوامل الإقليمية المؤثرة على سوق توليد الطاقة الكهرومائية طوال فترة التوقعات بشكل شامل. يناقش هذا القسم أيضًا قطاعات سوق توليد الطاقة الكهرومائية والجغرافيا في جميع أنحاء أمريكا الشمالية وأوروبا ومنطقة آسيا والمحيط الهادئ والشرق الأوسط وأفريقيا وأمريكا الجنوبية والوسطى.

- احصل على البيانات الإقليمية المحددة لسوق توليد الطاقة الكهرومائية
نطاق تقرير سوق توليد الطاقة الكهرومائية
| سمة التقرير | تفاصيل |
|---|---|
| حجم السوق في عام 2022 | 274.6 مليار دولار أمريكي |
| حجم السوق بحلول عام 2030 | 368.7 مليار دولار أمريكي |
| معدل النمو السنوي المركب العالمي (2022 - 2030) | 3.8% |
| البيانات التاريخية | 2020-2022 |
| فترة التنبؤ | 2022-2030 |
| القطاعات المغطاة |
حسب نوع النبات
|
| المناطق والدول المغطاة |
أمريكا الشمالية
|
| قادة السوق وملفات تعريف الشركات الرئيسية |
|
كثافة اللاعبين في سوق توليد الطاقة الكهرومائية: فهم تأثيرها على ديناميكيات الأعمال
يشهد سوق توليد الطاقة الكهرومائية نموًا سريعًا، مدفوعًا بالطلب المتزايد من المستخدم النهائي بسبب عوامل مثل تفضيلات المستهلكين المتطورة والتقدم التكنولوجي والوعي المتزايد بفوائد المنتج. ومع ارتفاع الطلب، تعمل الشركات على توسيع عروضها والابتكار لتلبية احتياجات المستهلكين والاستفادة من الاتجاهات الناشئة، مما يؤدي إلى زيادة نمو السوق.
تشير كثافة اللاعبين في السوق إلى توزيع الشركات أو المؤسسات العاملة في سوق أو صناعة معينة. وهي تشير إلى عدد المنافسين (اللاعبين في السوق) الموجودين في مساحة سوق معينة نسبة إلى حجمها أو قيمتها السوقية الإجمالية.
الشركات الرئيسية العاملة في سوق توليد الطاقة الكهرومائية هي:
- أندريتز هيدرو
- شركة جنرال إلكتريك للطاقة
- شركة سي بي اف ال للطاقة
- شركة سينوهيدرو
- شركة IHI
إخلاء المسؤولية : الشركات المذكورة أعلاه ليست مرتبة بأي ترتيب معين.

- احصل على نظرة عامة على أهم اللاعبين الرئيسيين في سوق توليد الطاقة الكهرومائية
تحليل اللاعب الرئيسي:
ومن بين اللاعبين الرئيسيين الذين تم عرضهم في هذا التقرير: RusHydro، وHydro-Quebec، وBC Hydro، وStatKraft، وNHPC، وEDF SA، وChina Yangtze Power، وA Energi، وEnel SpA، وCentrais Eletricas Brasileiras SA، وAndritz Hydro USA Inc، وGE Energy، وCPFL Energia SA، وSinohydro Corporation، وIHI Corporation، وAlstom Hydro، وChina Hydroelectric Corporation، وChina Three Gorges Corporation، وABB Ltd، وTata Power Corporation.تقرير سوق توليد الطاقة الكهرومائية.
التطورات الأخيرة:
تتبنى الشركات في سوق توليد الطاقة الكهرومائية العالمية بشكل كبير الاستراتيجيات غير العضوية والعضوية مثل عمليات الدمج والاستحواذ. وفيما يلي قائمة ببعض التطورات الأخيرة التي قام بها كبار اللاعبين في سوق توليد الطاقة الكهرومائية:
سنة |
أخبار |
دولة |
|
2022 |
وقع بنك الأراضي الفلبيني اتفاقية قرض مع شركة كابانجلاسان للطاقة الكهرومائية بقيمة 47.2 مليون دولار أمريكي. تهدف اتفاقية القرض هذه إلى تمويل جزئي لبناء محطة طاقة كهرومائية صغيرة بقدرة 15 ميجاوات في مقاطعة بوكيدنون. |
آسيا والمحيط الهادئ |
|
2020 |
تعاونت شركة مصدر مع الوكالة الدولية للطاقة المتجددة (آيرينا) لمضاعفة الطاقة المتجددة بحلول عام 2030. ويتمثل الهدف الرئيسي للمشروع في إنشاء قاعدة أساسية لمصادر الطاقة المتجددة مثل الطاقة الشمسية وطاقة الرياح والطاقة الكهرومائية وما إلى ذلك. |
الشرق الأوسط |
- التحليل التاريخي (سنتان)، سنة الأساس، التوقعات (7 سنوات) مع معدل النمو السنوي المركب
- تحليل PEST و SWOT
- حجم السوق والقيمة / الحجم - عالمي، إقليمي، بلد
- الصناعة والمنافسة
- مجموعة بيانات إكسل
التقارير الحديثة
تقارير ذات صلة
شهادات العملاء
سبب الشراء
- اتخاذ قرارات مدروسة
- فهم ديناميكيات السوق
- تحليل المنافسة
- رؤى العملاء
- توقعات السوق
- تخفيف المخاطر
- التخطيط الاستراتيجي
- مبررات الاستثمار
- تحديد الأسواق الناشئة
- تحسين استراتيجيات التسويق
- تعزيز الكفاءة التشغيلية
- مواكبة التوجهات التنظيمية


 احصل على عينة مجانية ل - سوق توليد الطاقة الكهرومائية