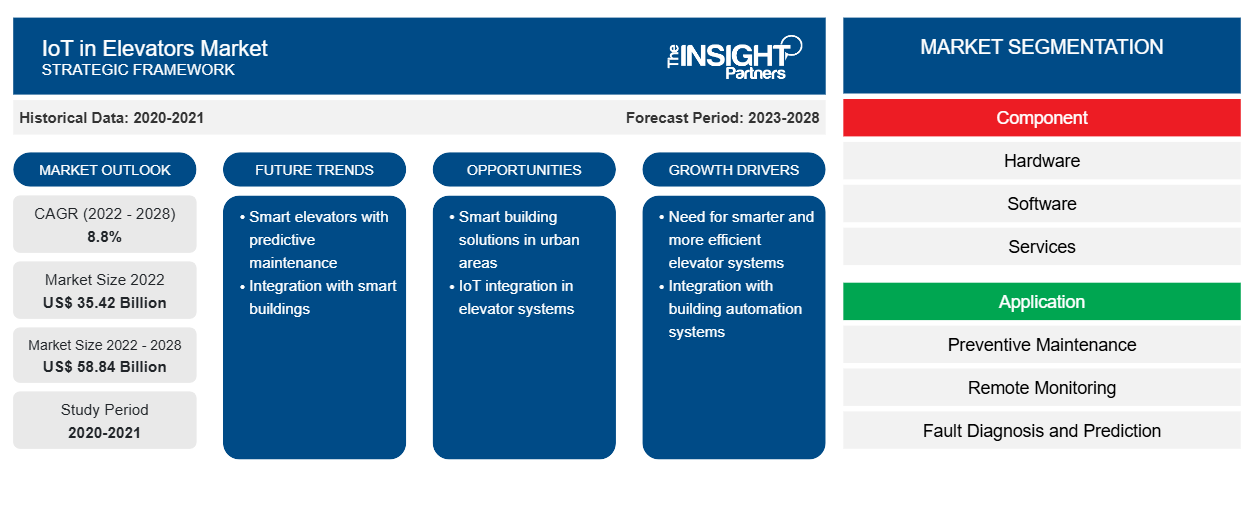
[تقرير بحثي] من المتوقع أن ينمو حجم سوق إنترنت الأشياء في المصاعد من 35،415.87 مليون دولار أمريكي في عام 2022 إلى 58،843.69 مليون دولار أمريكي بحلول عام 2028؛ ومن المتوقع أن ينمو بمعدل نمو سنوي مركب قدره 8.8٪ من عام 2022 إلى عام 2028.
تعتمد الشركات الصغيرة والمتوسطة الحجم والشركات الكبيرة بشكل كبير على الحلول الذكية. أصبح تبني إنترنت الأشياء في هذه الشركات شائعًا، مما يدفع نمو سوق إنترنت الأشياء في المصاعد . بالإضافة إلى ذلك، مع المنافسة المتزايدة، تستثمر العديد من الشركات بشكل كبير في الحلول والخدمات الذكية. وبالتالي، هناك فرص مربحة للبائعين الرئيسيين لإنترنت الأشياء في المصاعد حيث اعتمدت هذه الشركات بشكل متزايد على تأمين وحماية ممتلكاتها من التهديدات الداخلية أو الخارجية. كما تستثمر العديد من الحكومات في مشاريع التنمية الحضرية. وفقًا لوزارة الإسكان والشؤون الحضرية، استثمرت حكومة الهند 160 مليار دولار أمريكي في تطوير وتحسين البنية التحتية الحضرية منذ عام 2014. وبالمقارنة مع الفترة 2004-2014، زاد استثمار الهند في القطاع الحضري بأكثر من 600٪ من عام 2014 إلى عام 2021. أنشأت الحكومة الهندية خط أنابيب البنية التحتية الوطنية (NIP) بقيمة 1.5 تريليون دولار أمريكي لمشاريع البنية التحتية التي من المتوقع أن تكتمل بين عامي 2020 و 2025.
لقد خلقت السياسات والمبادرات والاستثمارات الضخمة في المدن الذكية ومشاريع التنمية الحضرية من قبل الحكومة والمنظمات الخاصة فرصًا مربحة للاعبين الرئيسيين العاملين في سوق إنترنت الأشياء في المصاعد. علاوة على ذلك، خلال فترة التنبؤ، من المتوقع أن يؤدي التوسع الاقتصادي والاهتمام المتزايد بتطوير القطاعات الصناعية الرائدة إلى رفع الطلب على إنترنت الأشياء في المصاعد. ومع ذلك، فإن الاستثمارات الأولية المرتفعة اللازمة لتحديث المصاعد وتكامل إنترنت الأشياء تحد من نمو سوق إنترنت الأشياء في المصاعد.
قم بتخصيص هذا التقرير ليناسب متطلباتك
ستحصل على تخصيص لأي تقرير - مجانًا - بما في ذلك أجزاء من هذا التقرير، أو تحليل على مستوى الدولة، وحزمة بيانات Excel، بالإضافة إلى الاستفادة من العروض والخصومات الرائعة للشركات الناشئة والجامعات
إنترنت الأشياء في سوق المصاعد:
- احصل على أهم اتجاهات السوق الرئيسية لهذا التقرير.ستتضمن هذه العينة المجانية تحليلاً للبيانات، بدءًا من اتجاهات السوق وحتى التقديرات والتوقعات.
تأثير جائحة كوفيد-19 على نمو سوق إنترنت الأشياء في المصاعد في أوروبا
لقد أثر جائحة كوفيد-19 بشدة على الدول الأوروبية، بما في ذلك ألمانيا وفرنسا وإسبانيا وإيطاليا. وكانت إيطاليا الدولة الأكثر تضررًا خلال فترة ما بعد الوباء. قبل الوباء، كان من المتوقع أن يرتفع سوق إنترنت الأشياء في المصاعد بشكل كبير بسبب الطلب المتزايد على المنتجات والخدمات الموفرة للطاقة؛ وزيادة اعتماد المنصات القائمة على إنترنت الأشياء، والحلول القائمة على السحابة، والذكاء الاصطناعي؛ والطلب المتزايد على التصنيع في كل قطاع صناعي.
تعد صناعة الإلكترونيات من بين الصناعات التي تضررت بشدة في بعض دول أوروبا. ومع ذلك، في الموجة الثانية من تفشي فيروس كورونا المستجد، تأثر قطاع الإلكترونيات وأشباه الموصلات سلبًا بالجائحة. في عام 2021، مع تخفيف إجراءات الإغلاق، بدأت أعمال التصنيع مرة أخرى. وبالتالي، اكتسبت آفاق سوق إنترنت الأشياء في المصاعد زخمًا. بالإضافة إلى ذلك، في عام 2022، من المتوقع أن ينمو الطلب على إنترنت الأشياء بسبب زيادة تشييد المباني التجارية والصناعية. وبالتالي، استفادت أعمال إنترنت الأشياء في المصاعد من الجائحة. في سيناريو ما بعد الجائحة، فإن تبني إنترنت الأشياء من أجل الاستدامة، والتحول إلى منصات سحابية، والإعفاء الضريبي المتزايد للمواطنين والقطاعات الصناعية المختلفة، والوصول عن بعد الآمن من شأنه أن يعزز توسع سوق إنترنت الأشياء في المصاعد.
رؤى السوق – إنترنت الأشياء في سوق المصاعد
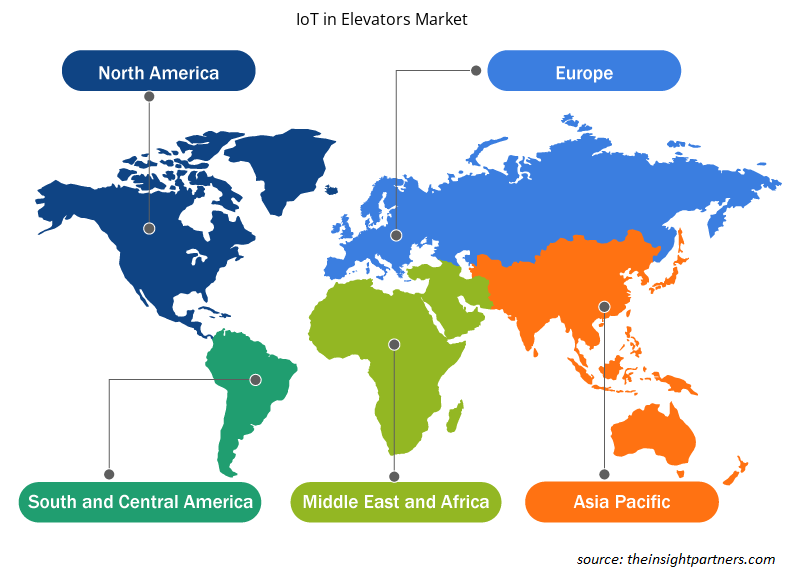
يتم تقسيم سوق إنترنت الأشياء العالمي في المصاعد، على أساس المنطقة، إلى أمريكا الشمالية وأوروبا وآسيا والمحيط الهادئ (APAC) والشرق الأوسط وأفريقيا (MEA) وأمريكا الجنوبية (SAM).
احتلت أوروبا أكبر حصة في سوق إنترنت الأشياء في المصاعد في عام 2021 ومن المتوقع أيضًا أن تهيمن على السوق خلال فترة التنبؤ. إن اعتماد 5G والاستثمارات من قبل الشركات في تحسين البنية التحتية لـ 5G يدفع نمو السوق في المنطقة. تتمتع ألمانيا بتاريخ طويل في الاستثمار والابتكار في إنترنت الأشياء الصناعي على مر السنين. تعد البلاد أيضًا رائدة في استخدام 5G لتوسيع استخدام إنترنت الأشياء الصناعي. يؤثر الطلب المتزايد على أنظمة التصوير الصناعي في جميع أنحاء قطاع التصنيع الصناعي وعلى أجزاء المعلومات والترفيه المتقدمة للسيارات وأجهزة مراقبة السائق ووحدات التحكم في السائق من قطاعات السيارات بشكل أكبر على الطلب على إنترنت الأشياء في المصاعد من قطاعي التصنيع والسيارات. كما أن البناء السريع النمو في القطاع التجاري في جميع أنحاء البلاد يزيد أيضًا من الطلب على أنظمة المصاعد القائمة على إنترنت الأشياء. تعمل هذه العوامل على تعزيز نمو سوق إنترنت الأشياء في المصاعد في أوروبا.
احتلت أمريكا الشمالية ثاني أكبر حصة في سوق إنترنت الأشياء في المصاعد في عام 2020. ومن المتوقع أن يحتفظ السوق في الولايات المتحدة بتوقعات نموه القوية خلال فترة التوقعات. في الولايات المتحدة، يدفع ارتفاع الدخل المتاح وتحسين مستوى المعيشة الطلب على الإلكترونيات الذكية. الطلب على الأجهزة المصغرة مرتفع بسبب الشعبية المتزايدة للذكاء الاصطناعي والثورة الصناعية 4.0. أيضًا، يستثمر العديد من الشركات المصنعة رأس مال ضخم في تطوير أنظمة رقمنة الإلكترونيات الذكية مثل تطبيقات أتمتة البنية التحتية. اتخذت حكومة الولايات المتحدة العديد من المبادرات لتعزيز صناعة الإلكترونيات. في 6 مايو 2022، اقترحت الحكومة اقتراحًا جديدًا ثنائي الحزب في الولايات المتحدة لتغذية قطاع لوحات الدوائر المطبوعة (PCB) في البلاد. رحبت العديد من شركات صناعة الإلكترونيات الراسخة في البلاد بالاقتراح. سيدعم مشروع القانون قانون CHIPS لعام 2021 وقانون لوحات الدوائر المطبوعة الأمريكية لعام 2022. ونتيجة لذلك، هناك العديد من الفرص المربحة للعمل الرئيسي في سوق إنترنت الأشياء في المصاعد.
رؤى مبنية على المكونات
بناءً على المكون، يتم تقسيم سوق إنترنت الأشياء في المصاعد إلى أجهزة وبرامج وخدمات. شكلت شريحة الأجهزة أكبر سوق في عام 2021. زاد الطلب على الأجهزة بشكل كبير في السنوات الأخيرة. يتم استخدام الذكاء الاصطناعي لمساعدة المشغلين والمقاولين الميكانيكيين على مواكبة روتينهم اليومي وإيجاد طرق لإدارة حركة المصاعد ومنع المشكلات قبل حدوثها، بناءً على البيانات التي تم جمعها من الاستخدام اليومي للمصاعد.
بناءً على التطبيق، يتم تقسيم سوق إنترنت الأشياء في المصاعد إلى الصيانة الوقائية والمراقبة عن بعد وتشخيص الأعطال والتنبؤ بها وإعداد التقارير المتقدمة وإدارة الاتصال. يتم تقسيم سوق إنترنت الأشياء في المصاعد، حسب المستخدم النهائي، إلى سكني وتجاري وصناعي. من حيث الجغرافيا، يتم تقسيم السوق بشكل أساسي إلى أمريكا الشمالية وأوروبا وآسيا والمحيط الهادئ (APAC) والشرق الأوسط وأفريقيا (MEA) وأمريكا الجنوبية.
تعد كل من OTIS وSchindler Group وKONE Corporation وHyundai Elevator Co., Ltd. وFujitec من أبرز الشركات الرائدة في سوق إنترنت الأشياء في المصاعد. السوق مجزأة للغاية مع وجود العديد من الشركات المحلية في منطقة محددة لتلبية الطلب المحلي.
رؤى إقليمية حول سوق إنترنت الأشياء في المصاعد
لقد قام المحللون في Insight Partners بشرح الاتجاهات والعوامل الإقليمية المؤثرة على سوق إنترنت الأشياء في المصاعد طوال فترة التوقعات بشكل شامل. يناقش هذا القسم أيضًا قطاعات سوق إنترنت الأشياء في المصاعد والجغرافيا في جميع أنحاء أمريكا الشمالية وأوروبا ومنطقة آسيا والمحيط الهادئ والشرق الأوسط وأفريقيا وأمريكا الجنوبية والوسطى.
- احصل على البيانات الإقليمية المحددة لسوق إنترنت الأشياء في المصاعد
نطاق تقرير سوق إنترنت الأشياء في المصاعد
| سمة التقرير | تفاصيل |
|---|---|
| حجم السوق في عام 2022 | 35.42 مليار دولار أمريكي |
| حجم السوق بحلول عام 2028 | 58.84 مليار دولار أمريكي |
| معدل النمو السنوي المركب العالمي (2022 - 2028) | 8.8% |
| البيانات التاريخية | 2020-2021 |
| فترة التنبؤ | 2023-2028 |
| القطاعات المغطاة | حسب المكون
|
| المناطق والدول المغطاة | أمريكا الشمالية
|
| قادة السوق وملفات تعريف الشركات الرئيسية |
|
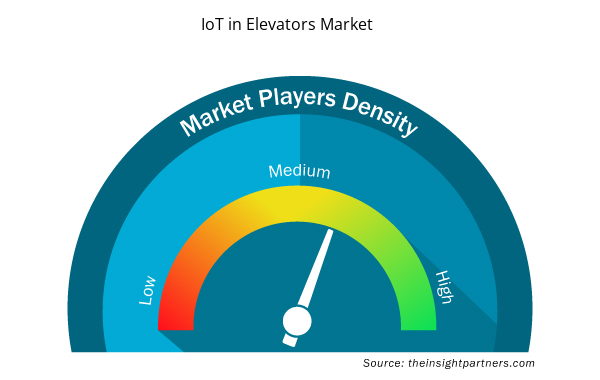
كثافة اللاعبين في السوق: فهم تأثيرها على ديناميكيات الأعمال
يشهد سوق إنترنت الأشياء في المصاعد نموًا سريعًا، مدفوعًا بالطلب المتزايد من المستخدم النهائي بسبب عوامل مثل تفضيلات المستهلكين المتطورة والتقدم التكنولوجي والوعي الأكبر بفوائد المنتج. ومع ارتفاع الطلب، تعمل الشركات على توسيع عروضها والابتكار لتلبية احتياجات المستهلكين والاستفادة من الاتجاهات الناشئة، مما يؤدي إلى زيادة نمو السوق.
تشير كثافة اللاعبين في السوق إلى توزيع الشركات أو المؤسسات العاملة في سوق أو صناعة معينة. وهي تشير إلى عدد المنافسين (اللاعبين في السوق) الموجودين في مساحة سوق معينة نسبة إلى حجمها أو قيمتها السوقية الإجمالية.
الشركات الرئيسية العاملة في سوق إنترنت الأشياء في المصاعد هي:
- شركة فوجيتيك المحدودة
- شركة هيتاشي المحدودة
- شركة كوني
- شركة ميتسوبيشي الكتريك
- شركة مصاعد أوتيس المحدودة
إخلاء المسؤولية : الشركات المذكورة أعلاه ليست مرتبة بأي ترتيب معين.
- احصل على نظرة عامة على أهم اللاعبين الرئيسيين في سوق إنترنت الأشياء في المصاعد
يركز اللاعبون العاملون في مجال تحليل سوق إنترنت الأشياء في المصاعد بشكل أساسي على تطوير المنتجات المتقدمة والفعالة.
- في ديسمبر 2021، دخلت شركة KONE، وهي شركة متعددة الجنسيات لتصنيع المصاعد والسلالم المتحركة، في شراكة مع Amazon Web Services (AWS)، منصة الحوسبة السحابية الأكثر شمولاً واستخدامًا على مستوى العالم. ستوفر AWS قدرات الحوسبة السحابية العالمية لشركة KONE، بما في ذلك إنترنت الأشياء (IoT) والتحليلات. بالإضافة إلى ذلك، ستتعاون الشركتان لإنشاء تقنيات جديدة من شأنها تحسين قابلية التوسع والأداء لخدمات وحلول KONE المتصلة.
- في أبريل 2021، أعلنت شركة ميتسوبيشي إلكتريك كوربوريشن أن شركتها التابعة ميتسوبيشي إليفيتور إنديا برايفت ليميتد (IMEC) حصلت على عقد موقع لتسليم المصاعد إلى المجمعين الفاخرين Commerzone Madhapur و Altimus المملوكين لشركة K RAHEJA CORP، وهي شركة تطوير مشهورة في الهند.
- التحليل التاريخي (سنتان)، السنة الأساسية، التوقعات (7 سنوات) مع معدل النمو السنوي المركب
- تحليل PEST و SWOT
- حجم السوق والقيمة / الحجم - عالميًا وإقليميًا وقطريًا
- الصناعة والمنافسة
- مجموعة بيانات Excel


Report Coverage
Revenue forecast, Company Analysis, Industry landscape, Growth factors, and Trends

Segment Covered
This text is related
to segments covered.

Regional Scope
North America, Europe, Asia Pacific, Middle East & Africa, South & Central America

Country Scope
This text is related
to country scope.
الأسئلة الشائعة
IoT in elevator company expansion and initiatives taken by these companies for developments in IoT in an elevator are supporting the market growth. Moreover, rising trends toward energy-efficient products & services are further supporting the growth of IoT in elevators market.
Residential is the leading end-user segment in the IoT in elevators market. With increasing projects in residential sector, will help in boosting the demand for advanced elevators.
The IoT in elevators market is estimated to grow at US$ 58,843.69 Million by 2028 at a CAGR of 8.8% during the forecast period.
Europe is holding major market share of IoT in elevators market.
OTIS, Schindler Group, Fujitec Co., Ltd., Hitachi, Ltd, Ltd., and KONE Corporation are the five key players holding the major market share in the IoT in elevators market.
The IoT in elevators market is primarily driven by the integration of elevator systems with smart technologies and the rise in the number of construction projects in urban areas across the world. Elevator's functions have changed significantly over the last decade owing to the advances in IoT and AI.
The List of Companies - IoT in Elevator Market
- Fujitec Co., Ltd.
- Hitachi, Ltd.
- KONE Corporation
- Mitsubishi Electric Corporation
- Otis Elevator Company Ltd.
- Bosch GmbH
- Schindler Group
- Schneider Electric SE
- Toshiba Elevators and Building Systems Corporation
- Hyundai Elevator Co., Ltd.


The Insight Partners performs research in 4 major stages: Data Collection & Secondary Research, Primary Research, Data Analysis and Data Triangulation & Final Review.
- Data Collection and Secondary Research:
As a market research and consulting firm operating from a decade, we have published and advised several client across the globe. First step for any study will start with an assessment of currently available data and insights from existing reports. Further, historical and current market information is collected from Investor Presentations, Annual Reports, SEC Filings, etc., and other information related to company’s performance and market positioning are gathered from Paid Databases (Factiva, Hoovers, and Reuters) and various other publications available in public domain.
Several associations trade associates, technical forums, institutes, societies and organization are accessed to gain technical as well as market related insights through their publications such as research papers, blogs and press releases related to the studies are referred to get cues about the market. Further, white papers, journals, magazines, and other news articles published in last 3 years are scrutinized and analyzed to understand the current market trends.
- Primary Research:
The primarily interview analysis comprise of data obtained from industry participants interview and answers to survey questions gathered by in-house primary team.
For primary research, interviews are conducted with industry experts/CEOs/Marketing Managers/VPs/Subject Matter Experts from both demand and supply side to get a 360-degree view of the market. The primary team conducts several interviews based on the complexity of the markets to understand the various market trends and dynamics which makes research more credible and precise.
A typical research interview fulfils the following functions:
- Provides first-hand information on the market size, market trends, growth trends, competitive landscape, and outlook
- Validates and strengthens in-house secondary research findings
- Develops the analysis team’s expertise and market understanding
Primary research involves email interactions and telephone interviews for each market, category, segment, and sub-segment across geographies. The participants who typically take part in such a process include, but are not limited to:
- Industry participants: VPs, business development managers, market intelligence managers and national sales managers
- Outside experts: Valuation experts, research analysts and key opinion leaders specializing in the electronics and semiconductor industry.
Below is the breakup of our primary respondents by company, designation, and region:

Once we receive the confirmation from primary research sources or primary respondents, we finalize the base year market estimation and forecast the data as per the macroeconomic and microeconomic factors assessed during data collection.
- Data Analysis:
Once data is validated through both secondary as well as primary respondents, we finalize the market estimations by hypothesis formulation and factor analysis at regional and country level.
- Macro-Economic Factor Analysis:
We analyse macroeconomic indicators such the gross domestic product (GDP), increase in the demand for goods and services across industries, technological advancement, regional economic growth, governmental policies, the influence of COVID-19, PEST analysis, and other aspects. This analysis aids in setting benchmarks for various nations/regions and approximating market splits. Additionally, the general trend of the aforementioned components aid in determining the market's development possibilities.
- Country Level Data:
Various factors that are especially aligned to the country are taken into account to determine the market size for a certain area and country, including the presence of vendors, such as headquarters and offices, the country's GDP, demand patterns, and industry growth. To comprehend the market dynamics for the nation, a number of growth variables, inhibitors, application areas, and current market trends are researched. The aforementioned elements aid in determining the country's overall market's growth potential.
- Company Profile:
The “Table of Contents” is formulated by listing and analyzing more than 25 - 30 companies operating in the market ecosystem across geographies. However, we profile only 10 companies as a standard practice in our syndicate reports. These 10 companies comprise leading, emerging, and regional players. Nonetheless, our analysis is not restricted to the 10 listed companies, we also analyze other companies present in the market to develop a holistic view and understand the prevailing trends. The “Company Profiles” section in the report covers key facts, business description, products & services, financial information, SWOT analysis, and key developments. The financial information presented is extracted from the annual reports and official documents of the publicly listed companies. Upon collecting the information for the sections of respective companies, we verify them via various primary sources and then compile the data in respective company profiles. The company level information helps us in deriving the base number as well as in forecasting the market size.
- Developing Base Number:
Aggregation of sales statistics (2020-2022) and macro-economic factor, and other secondary and primary research insights are utilized to arrive at base number and related market shares for 2022. The data gaps are identified in this step and relevant market data is analyzed, collected from paid primary interviews or databases. On finalizing the base year market size, forecasts are developed on the basis of macro-economic, industry and market growth factors and company level analysis.
- Data Triangulation and Final Review:
The market findings and base year market size calculations are validated from supply as well as demand side. Demand side validations are based on macro-economic factor analysis and benchmarks for respective regions and countries. In case of supply side validations, revenues of major companies are estimated (in case not available) based on industry benchmark, approximate number of employees, product portfolio, and primary interviews revenues are gathered. Further revenue from target product/service segment is assessed to avoid overshooting of market statistics. In case of heavy deviations between supply and demand side values, all thes steps are repeated to achieve synchronization.
We follow an iterative model, wherein we share our research findings with Subject Matter Experts (SME’s) and Key Opinion Leaders (KOLs) until consensus view of the market is not formulated – this model negates any drastic deviation in the opinions of experts. Only validated and universally acceptable research findings are quoted in our reports.
We have important check points that we use to validate our research findings – which we call – data triangulation, where we validate the information, we generate from secondary sources with primary interviews and then we re-validate with our internal data bases and Subject matter experts. This comprehensive model enables us to deliver high quality, reliable data in shortest possible time.
 احصل على عينة مجانية لهذا التقرير