استراتيجيات سوق أجهزة قياس التدفق بالموجات فوق الصوتية الطبية، وأفضل اللاعبين، وفرص النمو، والتحليل والتنبؤ بحلول عام 2030
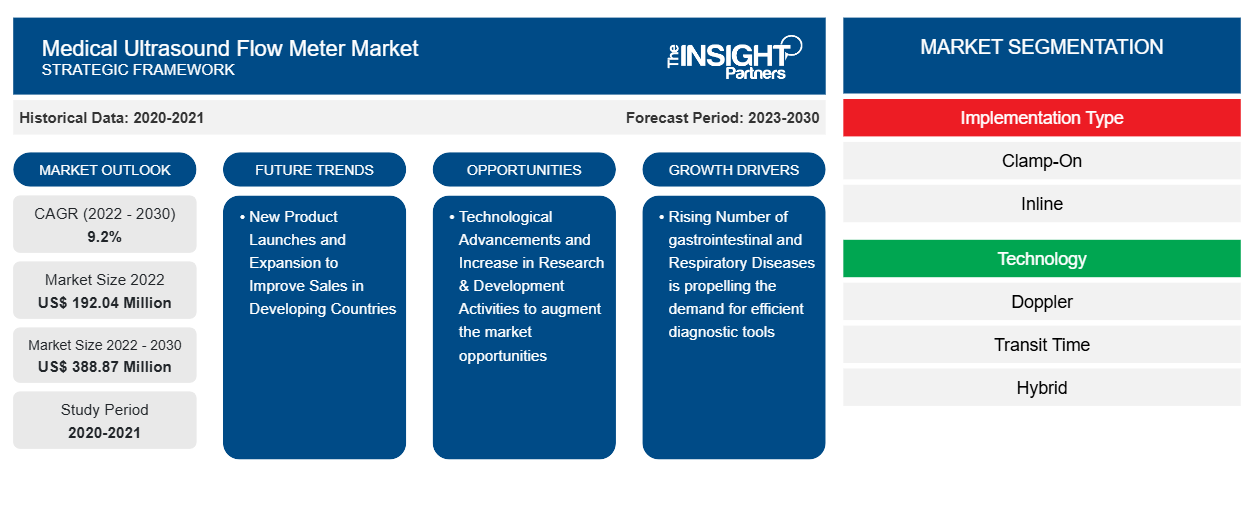
البيانات التاريخية : 2020-2021 | سنة الأساس : 2022 | فترة التنبؤ : 2023-2030حجم سوق أجهزة قياس تدفق الموجات فوق الصوتية الطبية وتوقعاتها (2020-2030)، والحصة العالمية والإقليمية، والاتجاهات، وفرص النمو. يغطي التقرير: حسب نوع التنفيذ (المثبت بالمشبك، والمضمن، وغيرها)، والتكنولوجيا (دوبلر، ووقت النقل، والهجين)، والتطبيق (أجهزة القلب والرئة، وأكسجة الأغشية خارج الجسم، والتروية، وأنظمة نقل الأعضاء، وغيرها)، والمستخدم النهائي (المستشفيات والعيادات، ومراكز الجراحة الخارجية، ومختبرات الأبحاث، وغيرها)، والجغرافيا.
- تاريخ التقرير : Mar 2024
- رمز التقرير : TIPRE00038992
- الفئة : علوم الحياة
- الحالة : نُشرت
- تنسيقات التقارير المتاحة :


- عدد الصفحات : 289
من المتوقع أن يصل حجم سوق مقياس تدفق الموجات فوق الصوتية الطبية إلى 388.87 مليون دولار أمريكي بحلول عام 2030 من 192.04 مليون دولار أمريكي في عام 2022. ومن المتوقع أن يسجل السوق معدل نمو سنوي مركب بنسبة 9.2٪ في الفترة 2022-2030. إن العدد المتزايد من أمراض القلب والأوعية الدموية وأمراض الجهاز التنفسي والحاجة المتزايدة لإجراءات زرع الأعضاء هي العوامل الدافعة الرئيسية لتطوير السوق. ومع ذلك، فإن التكلفة العالية وانخفاض دقة مقياس تدفق الموجات فوق الصوتية يعوقان نمو السوق.
تحليل سوق مقياس تدفق الموجات فوق الصوتية الطبية
على مدار السنوات الأخيرة، كان قياس تدفق الموجات فوق الصوتية واعدًا في التطبيقات الطبية. ومن المرجح أن يؤدي ارتفاع حالات اضطرابات الأوعية الدموية الطرفية ، جنبًا إلى جنب مع قاعدة متنامية من السكان المسنين، إلى توسع سوق مقياس تدفق الموجات فوق الصوتية الطبية العالمية
نظرة عامة على سوق مقياس تدفق الموجات فوق الصوتية الطبية
تُسجَّل ملايين الوفيات بسبب أمراض القلب والأوعية الدموية سنويًا في جميع أنحاء العالم. على سبيل المثال، شكلت أمراض القلب والأوعية الدموية 45% من الوفيات في أوروبا و37% في الاتحاد الأوروبي. ووفقًا لورقة حقائق التحديث الإحصائي لأمراض القلب والسكتة الدماغية لعام 2022، العبء العالمي للأمراض، توفي 119.1 مليون مريض على مستوى العالم بسبب أمراض القلب والأوعية الدموية في عام 2020. كما ذكرت أن معدل انتشار السكتة الدماغية والسكتة الدماغية الإقفارية على مستوى العالم في عام 2020 بلغ 89.1 مليون و68.2 مليون على التوالي. وفقًا للمركز الوطني للوقاية من الأمراض المزمنة وتعزيز الصحة، قسم الوقاية من أمراض القلب والسكتات الدماغية، تم الإبلاغ عن إصابة حوالي 697000 شخص بأمراض القلب في الولايات المتحدة في عام 2022. ووفقًا لجمعية القلب الأمريكية، من المرجح أن يتأثر حوالي 130 مليون شخص في الولايات المتحدة (يمثلون حوالي 45.1٪ من إجمالي السكان) بنوع من أمراض القلب والأوعية الدموية بحلول عام 2035. علاوة على ذلك، وفقًا للمكتبة الوطنية للطب، تم إجراء حوالي 400000 عملية جراحية لتطعيم الشريان التاجي (CABG) في عام 2022.
مرض الانسداد الرئوي المزمن يعيق تدفق الهواء من الرئتين، مما قد يؤدي إلى فشل تنفسي مختلف. إنه أحد الأمراض المهددة للحياة التي تسبب ملايين الوفيات في جميع أنحاء العالم. وفقًا لمنظمة الصحة العالمية، كان مرض الانسداد الرئوي المزمن ثالث سبب رئيسي للوفاة في عام 2022. في عام 2020، حدثت حوالي 90٪ من وفيات مرض الانسداد الرئوي المزمن في البلدان المنخفضة والمتوسطة الدخل. وفقًا لمراكز السيطرة على الأمراض والوقاية منها، في عام 2020، كان مرض الانسداد الرئوي المزمن سادس سبب رئيسي للوفاة في الولايات المتحدة. وبالتالي، أدى العدد المتزايد من أمراض القلب والأوعية الدموية وأمراض الجهاز التنفسي إلى تعزيز الاستخدام المتزايد لأجهزة الدعم الخارجية المدمجة مع أجهزة قياس تدفق الموجات فوق الصوتية. على سبيل المثال، يتم دمج الأكسجين الغشائي خارج الجسم (ECMO) - وهو نظام دعم الحياة الذي يوفر حلاً مؤقتًا لضخ السوائل في جسم المريض من خلال الأنابيب الطبية - مع أجهزة قياس تدفق الموجات فوق الصوتية للعمل بدلاً من القلب أو الرئتين من أجل ضمان التدفق الدقيق للدم المؤكسج أثناء العمليات الجراحية.
قم بتخصيص هذا التقرير ليناسب متطلباتك
ستحصل على تخصيص لأي تقرير - مجانًا - بما في ذلك أجزاء من هذا التقرير، أو تحليل على مستوى الدولة، وحزمة بيانات Excel، بالإضافة إلى الاستفادة من العروض والخصومات الرائعة للشركات الناشئة والجامعات
سوق مقياس تدفق الموجات فوق الصوتية الطبية: رؤى استراتيجية
-
احصل على أهم اتجاهات السوق الرئيسية لهذا التقرير.ستتضمن هذه العينة المجانية تحليلاً للبيانات، بدءًا من اتجاهات السوق وحتى التقديرات والتوقعات.
محركات وفرص سوق أجهزة قياس تدفق الموجات فوق الصوتية الطبية
ارتفاع حالات فشل الأعضاء يزيد الطلب على أجهزة قياس تدفق الموجات فوق الصوتية الطبية
أدى تزايد حالات فشل الأعضاء في جميع أنحاء العالم بسبب العديد من الحالات الصحية المزمنة مثل اضطرابات القلب والأوعية الدموية والحالات الوراثية والسكري إلى زيادة الطلب على عمليات زرع الأعضاء. وفقًا لتقرير إدارة الموارد والخدمات الصحية لعام 2020، يوجد حوالي 106247 شخصًا في قائمة انتظار زرع الأعضاء الوطنية في الولايات المتحدة. كل 9 دقائق، يُضاف شخص إلى قائمة الزرع. وفقًا للمرصد العالمي للتبرع وزرع الأعضاء، تم إجراء حوالي 129681 عملية زرع أعضاء في عام 2020 على مستوى العالم. بالإضافة إلى ذلك، أدى التطور في المرافق الطبية لتعزيز معدلات نجاح إجراءات الزرع وتقليل معدلات رفض الأعضاء أيضًا إلى زيادة الطلب على أنظمة نقل الأعضاء المتقدمة، مما ساهم لاحقًا في الطلب على أجهزة قياس تدفق الموجات فوق الصوتية الطبية - المكونات الأساسية لأنظمة نقل الأعضاء. يؤكد دمج أجهزة قياس التدفق بالموجات فوق الصوتية في أنظمة نقل الأعضاء على الأهمية المتزايدة للتكنولوجيا في التطبيقات الطبية والجراحية لتعزيز معدلات نجاح عمليات زرع الأعضاء. تُستخدم أجهزة قياس التدفق بالموجات فوق الصوتية في أنظمة نقل الأعضاء بشكل أساسي للمراقبة المتقدمة والحفظ، مما يؤدي بدوره إلى زيادة قابلية الأعضاء للحياة وتحسين نتائج الزرع.
إطلاق منتجات جديدة والتوسع لتحسين المبيعات – فرصة في سوق أجهزة قياس تدفق الموجات فوق الصوتية الطبية
تركز الشركات العاملة في سوق أجهزة قياس تدفق الموجات فوق الصوتية الطبية باستمرار على إطلاق منتجات جديدة والتوسع لتحسين مبيعاتها. فيما يلي بعض التطورات الجديرة بالملاحظة في سوق أجهزة قياس تدفق الموجات فوق الصوتية الطبية.
- في أبريل 2021، أطلقت شركة NovaSignal Corp. منصة NovaGuide 2 التي تزود الفرق السريرية بمعلومات بالغة الأهمية في الوقت الفعلي حول تدفق الدم الدماغي لتوجيه التشخيص وتعزيز نتائج المرضى. يهدف الجهاز إلى التكامل مع الممارسة السريرية الحالية؛ تحتوي المنصة على الموجات فوق الصوتية الذكية NovaGuide 2. يلتقط الجهاز بشكل مستقل بيانات تدفق الدم لتحديد أمراض الدماغ. ينفذ NovaGuide View وصولاً آمنًا قائمًا على السحابة إلى بيانات الفحص الفعالة.
وبالتالي، فمن المتوقع أن تولد التطورات في أجهزة قياس التدفق بالموجات فوق الصوتية فرصًا مربحة لنمو السوق خلال الفترة المتوقعة.
تقرير تحليلي لتجزئة سوق مقياس تدفق الموجات فوق الصوتية الطبية
إن القطاعات الرئيسية التي ساهمت في اشتقاق تحليل سوق مقياس تدفق الموجات فوق الصوتية الطبية هي نوع التنفيذ والتكنولوجيا والتطبيق والمستخدم النهائي.
- وفقًا لنوع التنفيذ، ينقسم سوق مقياس تدفق الموجات فوق الصوتية الطبية إلى مقياس مثبت ومقياس خطي وآخرين. احتلت شريحة مقياس المثبت حصة سوقية أعلى في عام 2022.
- بناءً على التكنولوجيا، يتم تقسيم السوق إلى دوبلر، ووقت العبور، والهجين.
- من حيث التطبيق، يتم تقسيم السوق إلى أجهزة القلب والرئة، والأكسجة الغشائية خارج الجسم، والتروية، وأنظمة نقل الأعضاء، وغيرها.
- بناءً على المستخدم النهائي، يتم تقسيم السوق إلى المستشفيات والعيادات ومراكز الجراحة الخارجية ومختبرات الأبحاث وغيرها.
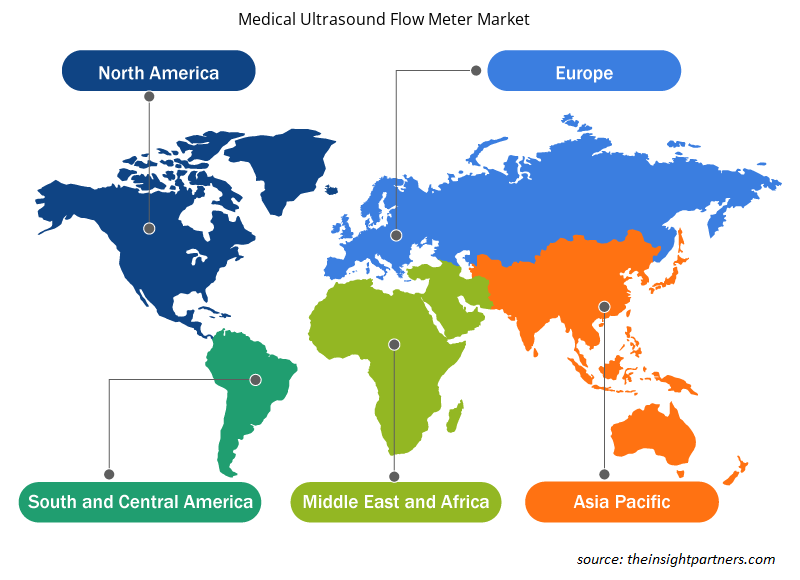
تحليل حصة سوق أجهزة قياس تدفق الموجات فوق الصوتية الطبية حسب المنطقة الجغرافية
ينقسم النطاق الجغرافي لتقرير سوق مقياس تدفق الموجات فوق الصوتية الطبية بشكل أساسي إلى خمس مناطق: أمريكا الشمالية، وآسيا والمحيط الهادئ، وأوروبا، والشرق الأوسط وأفريقيا، وأمريكا الجنوبية/أمريكا الجنوبية والوسطى.
ينقسم سوق أجهزة قياس تدفق الموجات فوق الصوتية الطبية في أمريكا الشمالية إلى الولايات المتحدة وكندا والمكسيك. يساهم الانتشار المتزايد لأمراض القلب والأوعية الدموية وأمراض الجهاز التنفسي والتطورات الاستراتيجية المتنامية من قبل اللاعبين في السوق في تطوير السوق في المنطقة. تحتل الولايات المتحدة الحصة الأكبر في سوق أجهزة قياس تدفق الموجات فوق الصوتية الطبية.
من المتوقع أن يؤدي تزايد أمراض الكلى المزمنة وانتشار السكان المسنين في الولايات المتحدة إلى دفع سوق مقياس تدفق الموجات فوق الصوتية الطبية. على سبيل المثال، وفقًا لورقة حقائق أمراض الكلى المزمنة الوطنية، في عام 2020، عانى حوالي 30 مليون شخص من أمراض الكلى المزمنة في الولايات المتحدة. وفقًا لجمعية القلب الأمريكية، في يناير 2019، تم الإبلاغ عن أنه بحلول عام 2035، من المرجح أن يعاني أكثر من 130 مليونًا، أو 45.1٪ من الأشخاص، من نوع ما من أمراض القلب والأوعية الدموية. لذلك، فإن تزايد حالات الأمراض المزمنة وأمراض القلب والأوعية الدموية يزيد من الطلب على أكسجة الأغشية خارج الجسم (ECMO) وأنظمة نقل الأعضاء. وبالتالي، فإن كل هذه العوامل تدعم نمو سوق مقياس تدفق الموجات فوق الصوتية الطبية في الولايات المتحدة
رؤى إقليمية حول سوق أجهزة قياس تدفق الموجات فوق الصوتية الطبية
لقد قام المحللون في Insight Partners بشرح الاتجاهات والعوامل الإقليمية المؤثرة على سوق مقياس تدفق الموجات فوق الصوتية الطبية طوال فترة التوقعات بشكل شامل. يناقش هذا القسم أيضًا قطاعات سوق مقياس تدفق الموجات فوق الصوتية الطبية والجغرافيا في جميع أنحاء أمريكا الشمالية وأوروبا ومنطقة آسيا والمحيط الهادئ والشرق الأوسط وأفريقيا وأمريكا الجنوبية والوسطى.
- احصل على البيانات الإقليمية المحددة لسوق مقياس تدفق الموجات فوق الصوتية الطبية
نطاق تقرير سوق مقياس تدفق الموجات فوق الصوتية الطبية
| سمة التقرير | تفاصيل |
|---|---|
| حجم السوق في عام 2022 | 192.04 مليون دولار أمريكي |
| حجم السوق بحلول عام 2030 | 388.87 مليون دولار أمريكي |
| معدل النمو السنوي المركب العالمي (2022 - 2030) | 9.2% |
| البيانات التاريخية | 2020-2021 |
| فترة التنبؤ | 2023-2030 |
| القطاعات المغطاة |
حسب نوع التنفيذ
|
| المناطق والدول المغطاة |
أمريكا الشمالية
|
| قادة السوق وملفات تعريف الشركات الرئيسية |
|
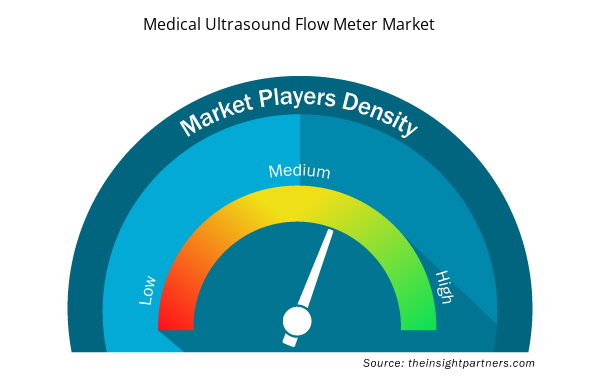
كثافة اللاعبين في سوق أجهزة قياس تدفق الموجات فوق الصوتية الطبية: فهم تأثيرها على ديناميكيات الأعمال
يشهد سوق أجهزة قياس تدفق الموجات فوق الصوتية الطبية نموًا سريعًا، مدفوعًا بالطلب المتزايد من المستخدم النهائي بسبب عوامل مثل تفضيلات المستهلكين المتطورة والتقدم التكنولوجي والوعي المتزايد بفوائد المنتج. ومع ارتفاع الطلب، تعمل الشركات على توسيع عروضها والابتكار لتلبية احتياجات المستهلكين والاستفادة من الاتجاهات الناشئة، مما يؤدي إلى زيادة نمو السوق.
تشير كثافة اللاعبين في السوق إلى توزيع الشركات أو المؤسسات العاملة في سوق أو صناعة معينة. وهي تشير إلى عدد المنافسين (اللاعبين في السوق) الموجودين في مساحة سوق معينة نسبة إلى حجمها أو قيمتها السوقية الإجمالية.
الشركات الرئيسية العاملة في سوق مقياس تدفق الموجات فوق الصوتية الطبية هي:
- أرجو ايه بي
- PSG دوفر، مور إنسترومنتس المحدودة
- شركة ترانسونيك سيستمز
- شركة كومبوميديكس المحدودة
- شركة كوك الطبية القابضة المحدودة
- شركة جي اف للمنتجات الصحية
إخلاء المسؤولية : الشركات المذكورة أعلاه ليست مرتبة بأي ترتيب معين.
- احصل على نظرة عامة على أهم اللاعبين الرئيسيين في سوق مقياس تدفق الموجات فوق الصوتية الطبية
أخبار سوق أجهزة قياس تدفق الموجات فوق الصوتية الطبية والتطورات الأخيرة
يتم تقييم سوق مقياس تدفق الموجات فوق الصوتية الطبية من خلال جمع البيانات النوعية والكمية بعد البحث الأولي والثانوي، والذي يتضمن منشورات الشركات المهمة وبيانات الجمعيات وقواعد البيانات. فيما يلي قائمة بالتطورات في السوق فيما يتعلق بالابتكارات وتوسيع الأعمال والاستراتيجيات:
- في يونيو 2022، قامت شركة Sonotec GmbH بتحسين مقياس التدفق غير التلامسي SONOFLOW CO.55 لزيادة الكفاءة في جميع العمليات السابقة واللاحقة المتعلقة بـ PAT في تطبيقات التكنولوجيا الحيوية. يجمع مستشعر SONOFLOW CO.55 V3.0 الجديد بين دقة القياس المتميزة وأعلى قدر من تكرار المشبك إلى المشبك. (المصدر: بيان صحفي لشركة Sonotec GmbH)
تقرير سوق أجهزة قياس تدفق الموجات فوق الصوتية الطبية والتغطية والنتائج
يوفر تقرير "حجم سوق مقياس تدفق الموجات فوق الصوتية الطبية والتوقعات (2020-2030)" تحليلاً مفصلاً للسوق يغطي المجالات التالية:
- حجم سوق مقياس تدفق الموجات فوق الصوتية الطبية وتوقعاته على المستويات العالمية والإقليمية والوطنية لجميع قطاعات السوق الرئيسية المغطاة ضمن النطاق
- ديناميكيات السوق مثل المحركات والقيود والفرص الرئيسية
- اتجاهات سوق أجهزة قياس تدفق الموجات فوق الصوتية الطبية
- تحليل مفصل لقوى PEST/Porter الخمس وSWOT
- تحليل سوق مقياس تدفق الموجات فوق الصوتية الطبية يغطي اتجاهات السوق الرئيسية والإطار العالمي والإقليمي واللاعبين الرئيسيين واللوائح والتطورات الأخيرة في السوق
- تحليل المشهد الصناعي والمنافسة في مجال أجهزة قياس تدفق الموجات فوق الصوتية الطبية، والذي يغطي تركيز السوق، وتحليل خريطة الحرارة، واللاعبين البارزين، والتطورات الأخيرة
- ملفات تعريف الشركة التفصيلية

مرينال محللة أبحاث مخضرمة، تتمتع بخبرة تزيد عن 8 سنوات في مجال استخبارات واستشارات سوق علوم الحياة. بفضل عقليتها الاستراتيجية والتزامها الراسخ بالتميز، اكتسبت خبرة واسعة في التنبؤ بالصناعات الدوائية، وتقييم فرص السوق، وتطوير معايير الصناعة. يرتكز عملها على تقديم رؤى عملية تُمكّن العملاء من اتخاذ قرارات استراتيجية مدروسة.
تكمن قوة مرينال الأساسية في ترجمة مجموعات البيانات الكمية المعقدة إلى معلومات استخباراتية قيّمة. وتُعدّ براعتها التحليلية ركيزةً أساسيةً في صياغة استراتيجيات دخول السوق (GTM) واكتشاف فرص النمو في قطاعي الأدوية والأجهزة الطبية. وبصفتها مستشارةً موثوقةً، تُركز مرينال باستمرار على تبسيط إجراءات سير العمل وترسيخ أفضل الممارسات، مما يُعزز الابتكار والكفاءة التشغيلية لعملائها.
- التحليل التاريخي (سنتان)، سنة الأساس، التوقعات (7 سنوات) مع معدل النمو السنوي المركب
- تحليل PEST و SWOT
- حجم السوق والقيمة / الحجم - عالمي، إقليمي، بلد
- الصناعة والمنافسة
- مجموعة بيانات إكسل
التقارير الحديثة
تقارير ذات صلة
شهادات العملاء
تقرير سوق أنظمة SCADA من Insight Partners شامل، ويقدم رؤى قيّمة حول الاتجاهات الحالية والتوقعات المستقبلية. تميّز الفريق باحترافية عالية وسرعة في الاستجابة ودعم مستمر طوال الوقت. نحن راضون جدًا ونوصي بشدة بخدماتهم.
ران كيديم شريك, شركة ريالي تكنولوجيز المحدودةطلبتُ تقريرًا عن سوق برمجيات محدد، وأعدّه الفريق في غضون أيام قليلة. كانت المعلومات ذات صلة وثيقة وعرضها جيد. ثم طلبتُ بعض التعديلات والإضافات على التقرير. وكان الفريق متجاوبًا للغاية، وحصلتُ على التقرير النهائي في أقل من أسبوع.
جان هيرفيه جين رئيس مجلس الإدارة, فيوتشر أناليتيكاعملنا مع شركة "إنسايت بارتنرز" لإجراء دراسة سوقية وتوقعات مهمة. زودونا برؤى واضحة حول الفرص والمخاطر، مما ساعدنا في صياغة خططنا. كانت أبحاثهم سهلة الاستخدام ومبنية على بيانات دقيقة، مما ساعدنا على اتخاذ قرارات ذكية وواثقة. نوصي بهم بشدة.
بيوش ناجبال نائب الرئيس الأول, شعاع عالي عالميقدّمت شركة Insight Partners أبحاثًا سوقية ثاقبة ومنظمة جيدًا بخبرة واسعة في هذا المجال. تميّز فريقهم بالاحترافية وسرعة الاستجابة طوال الوقت. وسهّل موقعهم الإلكتروني سهل الاستخدام الوصول إلى تقارير القطاع. نوصي بهم بشدة لخدمات بحثية موثوقة وعالية الجودة.
يوكيهيكو أداتشي المدير التنفيذي, ديب بلو، ذ.م.م.هذه أول مرة أشتري فيها تقرير سوق من The Insight Partners. رغم أنني كنت مترددًا في البداية، إلا أنني زرت موقعهم الإلكتروني وشعرت براحة أكبر للمخاطرة وشراء تقرير السوق. أنا راضٍ تمامًا عن جودة التقرير وخدمة العملاء. كانت لديّ عدة أسئلة وتعليقات حول التقرير الأولي، ولكن بعد بضع محادثات عبر البريد الإلكتروني مع محللهم، أعتقد أن لديّ تقريرًا يمكنني استخدامه كمدخل لعملية التخطيط الاستراتيجي لدينا. شكرًا جزيلاً لكم على تخصيص وقتكم الإضافي وجعل هذه التجربة إيجابية. سأوصي بخدماتكم للآخرين بالتأكيد، وستكونون أول من ألجأ إليه عندما نحتاج إلى المزيد من بيانات السوق.
جون سوزوكي الرئيس والرئيس التنفيذي وعضو مجلس الإدارة, بي كيه تكنولوجيزأود أن أقدّر دعمكم واحترافيتكم في الاستجابة لطلبي للحصول على معلومات بشأن سوق التشخيص المخبري للأمراض المعدية في نيجيريا. كما أُقدّر صبركم وتوجيهكم، واستعدادكم لتقديم خصم، مما مكّننا في النهاية من إتمام الصفقة. أتطلع إلى التعامل مع "ذا إنسايت بارتنرز" مستقبلًا، كل ذلك بفضل الانطباع الذي تركتموه لديّ نتيجةً لهذا اللقاء الأول.
الدكتور تشيجيوك أونيا المدير الإداري, شركة باينكريست للرعاية الصحية المحدودةسبب الشراء
- اتخاذ قرارات مدروسة
- فهم ديناميكيات السوق
- تحليل المنافسة
- رؤى العملاء
- توقعات السوق
- تخفيف المخاطر
- التخطيط الاستراتيجي
- مبررات الاستثمار
- تحديد الأسواق الناشئة
- تحسين استراتيجيات التسويق
- تعزيز الكفاءة التشغيلية
- مواكبة التوجهات التنظيمية


 احصل على عينة مجانية ل - سوق أجهزة قياس تدفق الموجات فوق الصوتية الطبية