نمو سوق الشاحنات العسكرية وحجمها ومشاركتها واتجاهاتها وتحليل اللاعبين الرئيسيين والتوقعات حتى عام 2031
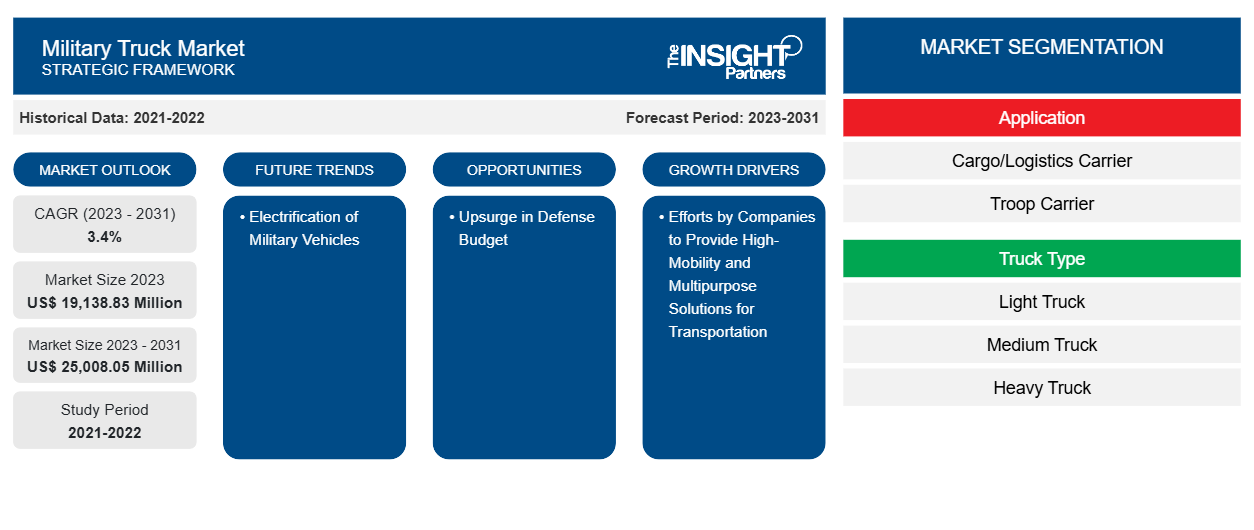
البيانات التاريخية : 2021-2022 | سنة الأساس : 2023 | فترة التنبؤ : 2023-2031حجم سوق الشاحنات العسكرية وتوقعاته (2021-2031)، والحصة العالمية والإقليمية، والاتجاهات، وتحليل فرص النمو. يغطي التقرير: حسب التطبيق (ناقلات البضائع/اللوجستيات وناقلات الجنود)، ونوع الشاحنة (شاحنة خفيفة، وشاحنة متوسطة، وشاحنة ثقيلة)، ونوع الدفع (كهربائي/هجين وديزل)، ونوع ناقل الحركة (ناقل حركة أوتوماتيكي ويدوي)، والموقع الجغرافي.
- تاريخ التقرير : Feb 2026
- رمز التقرير : TIPRE00007100
- الفئة : الفضاء والدفاع
- الحالة : البيانات الصادرة
- تنسيقات التقارير المتاحة :


- عدد الصفحات : 150
من المتوقع أن يصل حجم سوق الشاحنات العسكرية إلى 25008.05 مليون دولار أمريكي بحلول عام 2031 من 19138.83 مليون دولار أمريكي في عام 2023. ومن المتوقع أن يسجل السوق معدل نمو سنوي مركب بنسبة 3.4٪ في الفترة 2023-2031. تعمل حكومات مختلف البلدان على توسيع قواتها العسكرية لتعزيز قدراتها. في يناير 2021، أعلنت حكومة الصين أنها ستبدأ في إجراء حملات تجنيد مرتين في السنة اعتبارًا من عام 2021 فصاعدًا. تمت الموافقة على هذا الاقتراح من قبل مجلس الدولة واللجنة العسكرية المركزية. ستتم المرحلة الأولى من التجنيد من فبراير إلى مارس، وستتم المرحلة الثانية من أغسطس إلى سبتمبر. وبالمثل، تعمل الحكومة الهندية أيضًا على توسيع قواتها العسكرية لحماية حدودها من غزو الصين وباكستان. وبالتالي، تشير مثل هذه التجنيدات المتزايدة في القوات العسكرية إلى الحاجة إلى الشاحنات العسكرية لنقل القوات والوقود والمعدات على طول الطرق المعبدة والطرق الترابية غير المعبدة، وبالتالي دفع نمو سوق الشاحنات العسكرية.
تحليل سوق الشاحنات العسكرية
إن استخدام المركبات العسكرية التي تعمل بالوقود قد يكون مكلفًا للقوات المسلحة. كان الجيش الأمريكي أحد أكبر مستهلكي البترول، حيث يستخدم حوالي 4.2 مليار جالون من الوقود سنويًا. كان على وكالات اللوجستيات الدفاعية أن تنفق أكثر من 9 مليارات دولار أمريكي على الوقود في عام 2019. وبالتالي، لتقليل الإنفاق على الوقود، يقود الجيش الأمريكي الطريق ويستثمر في برامج تجريبية للمركبات الكهربائية والهجينة. حددت استراتيجية المناخ الجديدة للجيش الأمريكي هدفًا لعام 2027 لنشر أسطول كهربائي بالكامل وخفيف الوزن وغير تكتيكي. بالإضافة إلى ذلك، فقد حددوا أيضًا هدفًا لعام 2035 لنشر أسطول غير تكتيكي كهربائي بالكامل ومركبات تكتيكية هجينة.
نظرة عامة على سوق الشاحنات العسكرية
تستثمر القطاعات العسكرية والدفاعية بشكل كبير في التقنيات المتقدمة لتعزيز قدراتها بآلات الحرب المتقدمة ومعدات النقل . تعمل دول مثل روسيا والولايات المتحدة وفرنسا وغيرها على تطوير شاحنات عسكرية متقدمة للسوق العالمية. تقود شركات تصنيع الشاحنات العسكرية مثل Volvo Defense AB و Tata Motors Ltd و Rheinmetall AG و Oshkosh Corporation و General Dynamics European Land Systems SLU نمو السوق. تعمل الدول النامية مثل الهند والصين وإندونيسيا وغيرها على تعزيز قوتها العسكرية بسبب تصاعد الاشتباكات الحدودية مع الدول المجاورة. تعد الشاحنات العسكرية أجزاء مهمة من النقل العسكري ويتزايد الطلب عليها مع زيادة القوات العسكرية وشراء المعدات. الاستثمار الضخم من الحكومات والتطورات التكنولوجية من الشركة المصنعة للشاحنات يزيد من نمو السوق. على سبيل المثال، وفقًا لشركة Oshkosh، أصدر الجيش الأمريكي مسودة متطلباته للشاحنة التكتيكية المشتركة (CTT) في عام 2021 لشراء 7000 إلى 10000 مركبة بقيمة 5.1 مليار دولار أمريكي. إن مثل هذه المشتريات من الحكومات للمركبات الأرضية تدعم في نهاية المطاف نمو السوق وتعزز من عروض المنتجات في السوق. بالإضافة إلى ذلك، تركز شركة Oshkosh Defense التي يقع مقرها في الولايات المتحدة بشكل أكبر على مثل هذا العقد أو المتطلب من خلال تطوير نظام الدفع المتقدم. على سبيل المثال، قدمت الشركة نظام ProPulse Hybrid Diesel-Electric System لمركبات HEMTT A3 والمركبات التكتيكية المتوسطة لتحسين الاقتصاد في استهلاك الوقود.
قم بتخصيص هذا التقرير ليناسب متطلباتك
ستحصل على تخصيص لأي تقرير - مجانًا - بما في ذلك أجزاء من هذا التقرير، أو تحليل على مستوى الدولة، وحزمة بيانات Excel، بالإضافة إلى الاستفادة من العروض والخصومات الرائعة للشركات الناشئة والجامعات
سوق الشاحنات العسكرية: رؤى استراتيجية
-
احصل على أهم اتجاهات السوق الرئيسية لهذا التقرير.ستتضمن هذه العينة المجانية تحليلاً للبيانات، بدءًا من اتجاهات السوق وحتى التقديرات والتوقعات.
محركات وفرص سوق الشاحنات العسكرية
جهود الشركات لتوفير حلول متعددة الأغراض وعالية التنقل للنقل
تلعب القوات الحديثة أدوارًا مختلفة تتراوح من تقديم الدعم للمهمة في ساحات القتال إلى تنفيذ المهام اللوجستية في الوطن. تُستخدم الشاحنات العسكرية أيضًا لنقل القوات والموظفين والأسلحة (المحمولة) والإمدادات وإجلاء الجنود الجرحى وما إلى ذلك. علاوة على ذلك، فهي مطلوبة لنشر وحدات عسكرية في مواقع مختلفة لتعزيز الحماية الوطنية. وبالتالي، فإن الطلب على الشاحنات العسكرية يتزايد مع العدد المتزايد من المهام العسكرية حيث يتم نشرها لنقل الأفراد والمعدات والبضائع العسكرية، وكذلك لنقل المركبات والأسلحة المستردة من مواقع المهمة. بالنظر إلى هذه الاحتياجات، يعمل مصنعو الشاحنات العسكرية باستمرار على جلب الشاحنات المتقدمة إلى السوق. في نوفمبر 2019، قدمت شركة ARQUUS حاملة 8 × 8 الجديدة في منتدى Entreprise Défense. تم تجهيز شاحنة Arquus 8 × 8 الجديدة بنظام إدارة مجموعة نقل الحركة الإلكتروني للتحكم التلقائي في الجر (ATC)، مما يوفر أقصى قدر من الحركة على جميع أنواع التضاريس. كما يساعد الفرق على توفير استهلاك الوقود ويمنح الحماية ضد تآكل الإطارات والمحاور. في مايو 2021، أطلقت شركة Rheinmetall AG أحدث جيل من عائلة HX من الشاحنات التكتيكية الثقيلة للاستخدام العسكري. تم إعادة تصميم الشاحنة بالكامل بتقنيات جديدة ومنتجات عسكرية جاهزة (MOTS). تتميز بقدرة القيادة الذاتية، والتي يمكن أن تكون بمثابة الأساس للعديد من أنظمة المدفعية. علاوة على ذلك، توفر الشاحنة حماية وموثوقية ومرونة محسنة وراحة في القيادة وهندسة واجهة رقمية. وبفضل هذه الميزات، يمكن استخدام هذه الشاحنة لتنفيذ مهام تكتيكية وفنية. وبالتالي، فإن الجهود التي تبذلها شركات تصنيع الشاحنات العسكرية لتوفير حلول عالية الحركة ومتعددة الأغراض للنقل تعزز نمو سوق الشاحنات العسكرية.
ارتفاع في ميزانية الدفاع
تركز حكومات مختلف البلدان باستمرار على تعزيز قدراتها العسكرية من خلال إنفاق المزيد على تحديث عملياتها. وفقًا لـ Global Firepower، فإن الولايات المتحدة والصين وروسيا والهند وألمانيا هي أكبر 5 دول لديها أكبر ميزانية دفاع في عام 2023. في مارس 2023، اقترحت وزارة الدفاع الأمريكية طلبًا لتوفير 842 مليار دولار أمريكي لوزارة الدفاع في ميزانية الدفاع للسنة المالية 2024، وهو أعلى بمقدار 26 مليار دولار أمريكي عن السنة المالية 2023 و 100 مليار دولار أمريكي عن السنة المالية 2022. ومن هذا المبلغ، خصصت الحكومة الأمريكية 13.9 مليار دولار أمريكي لتحديث المعدات القتالية التي يستخدمها الجيش الأمريكي وسلاح مشاة البحرية، والتي تشمل المركبات المدرعة متعددة الأغراض ومركبات القتال البرمائية ومركبات القتال المأهولة اختياريًا. بالإضافة إلى ذلك، تم تخصيص 271 مليون دولار أمريكي للجيش لتحديث مركبات قتالية من الجيل التالي بميزات المراقبة الصامتة والتنقل، ومدة تشغيلية متزايدة، والمزيد من الطاقة الكهربائية على متنها.
في فبراير 2023، أعلنت حكومة الهند عن تخصيص ميزانية إجمالية قدرها 72.64 مليار دولار أمريكي (593،537.64 كرور روبية هندية) لوزارة الدفاع، بزيادة قدرها 13.0٪ مقارنة بالمبلغ المخصص في عام 2022. ومن هذا المبلغ، فإن مخصصات رأس المال البالغة 19.9 مليار دولار أمريكي (162،600 كرور روبية هندية) مخصصة لتحديث وتطوير البنية التحتية للخدمات الدفاعية، مما يشير إلى ارتفاع بنسبة 6.7٪ مقارنة بعام 2022. ومن إجمالي الميزانية المخصصة لوزارة الدفاع، سيكون حوالي 57٪ للجيش. علاوة على ذلك، في عام 2023، تلقى الجيش الهندي 23٪ من إجمالي أموال التحديث بين الخدمات الدفاعية. علاوة على ذلك، أعلنت حكومة الصين في مارس 2023 عن ميزانيتها الدفاعية الرسمية البالغة حوالي 224.8 مليار دولار أمريكي للسنة المالية 2023، مما يمثل زيادة بنسبة 7.2٪ مقارنة بعام 2022. ووفقًا لوزارة الدفاع في البلاد، فإن زيادة الإنفاق الدفاعي تساعد في تزويد القوات الصينية بتدريب أفضل ومعدات أكثر تقدمًا. وبالتالي، فإن الإنفاق الدفاعي المتزايد من قبل حكومات البلدان المختلفة من شأنه أن يخلق فرصًا كبيرة لنمو سوق الشاحنات العسكرية خلال الفترة المتوقعة.
تقرير تحليل تجزئة سوق الشاحنات العسكرية
إن القطاعات الرئيسية التي ساهمت في اشتقاق تحليل سوق الشاحنات العسكرية هي التطبيق ونوع السيارة ونوع الدفع ونوع ناقل الحركة.
- بناءً على التطبيق، تم تصنيف سوق الشاحنات العسكرية إلى شاحنات نقل البضائع/الخدمات اللوجستية وشاحنات نقل الجنود. احتلت شريحة شاحنات نقل الجنود حصة سوقية أكبر في عام 2023.
- بناءً على نوع المركبة، يتم تصنيف سوق الشاحنات العسكرية إلى شاحنات خفيفة ومتوسطة وشاحنات ثقيلة. علاوة على ذلك، فإن الميل المتزايد نحو الشاحنات الثقيلة يعمل على تسريع نمو القطاع بأعلى معدل نمو سنوي مركب.
- بناءً على نوع الدفع، يمكن تقسيم سوق الشاحنات العسكرية إلى شاحنات كهربائية/هجينة وشاحنات ديزل. وقد استحوذت شريحة الشاحنات الكهربائية/الهجينة على حصة سوقية أكبر في عام 2023.
- بناءً على مستوى نوع ناقل الحركة، يتم تصنيف سوق الشاحنات العسكرية إلى ناقل حركة أوتوماتيكي وناقل حركة يدوي. احتلت شريحة ناقل الحركة الأوتوماتيكي حصة سوقية أكبر في عام 2023.
تحليل حصة سوق الشاحنات العسكرية حسب المنطقة الجغرافية
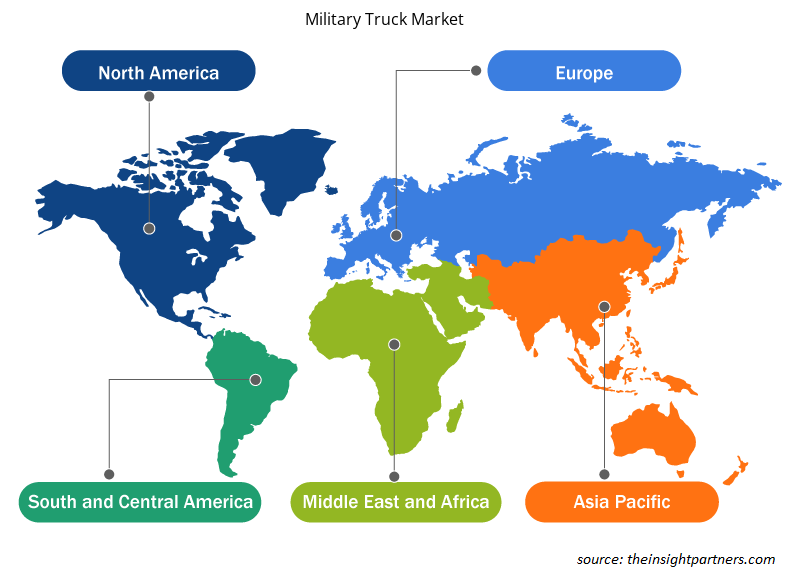
تم تقسيم سوق الشاحنات العسكرية إلى خمس مناطق رئيسية هي أمريكا الشمالية وأوروبا ومنطقة آسيا والمحيط الهادئ والشرق الأوسط وأفريقيا وجنوب أمريكا.
وفقًا لتصنيف Global Firepower، تحتل الولايات المتحدة المرتبة الأولى من بين 145 دولة من حيث القوة العسكرية في عام 2023. وتستثمر الدولة باستمرار في ترقية قدراتها العسكرية وتبني التكنولوجيا الجديدة. إلى جانب الولايات المتحدة، تستثمر دول أخرى في أمريكا الشمالية أيضًا في توسيع أسطول مركباتها العسكرية. على سبيل المثال، في أبريل 2020، تلقت حكومة كندا 1587 شاحنة و 322 مقطورة من Mack Defense كجزء أخير من برنامج النمط العسكري القياسي لنظام مركبات الدعم المتوسطة (MSVS). تم شراء هذه الشاحنات الجديدة لتحل محل الشاحنات التي كانت في الخدمة منذ الثمانينيات.
يوجد عدد كبير من اللاعبين في السوق، بما في ذلك Arquus SAS وRheinmetall AG وTATRA TRUCKS AS وGeneral Dynamics European Land Systems SLU وAB Volvo وIveco Group NV، في أوروبا. يعمل هؤلاء اللاعبون في السوق باستمرار على تطوير الشاحنات العسكرية بناءً على متطلبات القوات المسلحة في مختلف البلدان. على سبيل المثال، في يناير 2023، حصلت Rheinmetall AG، بالتعاون مع GM Defense، على عقود النماذج الأولية من الجيش الأمريكي. وبالتالي، فإن جهود التوسع المتزايدة من قبل بائعي الشاحنات العسكرية في أوروبا تصب في صالح نمو السوق في المنطقة.
رؤى إقليمية حول سوق الشاحنات العسكرية
لقد قام المحللون في Insight Partners بشرح الاتجاهات والعوامل الإقليمية المؤثرة على سوق الشاحنات العسكرية طوال فترة التوقعات بشكل شامل. يناقش هذا القسم أيضًا قطاعات سوق الشاحنات العسكرية والجغرافيا في جميع أنحاء أمريكا الشمالية وأوروبا ومنطقة آسيا والمحيط الهادئ والشرق الأوسط وأفريقيا وأمريكا الجنوبية والوسطى.
- احصل على البيانات الإقليمية المحددة لسوق الشاحنات العسكرية
نطاق تقرير سوق الشاحنات العسكرية
| سمة التقرير | تفاصيل |
|---|---|
| حجم السوق في عام 2023 | 19,138.83 مليون دولار أمريكي |
| حجم السوق بحلول عام 2031 | 25,008.05 مليون دولار أمريكي |
| معدل النمو السنوي المركب العالمي (2023 - 2031) | 3.4% |
| البيانات التاريخية | 2021-2022 |
| فترة التنبؤ | 2023-2031 |
| القطاعات المغطاة |
حسب الطلب
|
| المناطق والدول المغطاة |
أمريكا الشمالية
|
| قادة السوق وملفات تعريف الشركات الرئيسية |
|
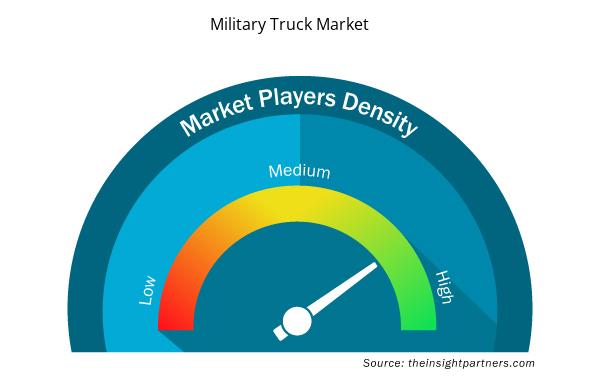
كثافة اللاعبين في سوق الشاحنات العسكرية: فهم تأثيرها على ديناميكيات الأعمال
يشهد سوق الشاحنات العسكرية نموًا سريعًا، مدفوعًا بالطلب المتزايد من المستخدم النهائي بسبب عوامل مثل تفضيلات المستهلكين المتطورة والتقدم التكنولوجي والوعي المتزايد بفوائد المنتج. ومع ارتفاع الطلب، تعمل الشركات على توسيع عروضها والابتكار لتلبية احتياجات المستهلكين والاستفادة من الاتجاهات الناشئة، مما يؤدي إلى زيادة نمو السوق.
تشير كثافة اللاعبين في السوق إلى توزيع الشركات أو المؤسسات العاملة في سوق أو صناعة معينة. وهي تشير إلى عدد المنافسين (اللاعبين في السوق) الموجودين في مساحة سوق معينة نسبة إلى حجمها أو قيمتها السوقية الإجمالية.
الشركات الرئيسية العاملة في سوق الشاحنات العسكرية هي:
- شركة فولفو للدفاع
- شركة تاتا موتورز المحدودة
- شركة راينميتال ايه جي
- شركة أوشكوش
- شركة جنرال ديناميكس الأوروبية لأنظمة الأراضي المحدودة
- مجموعة ايفيكو NV
إخلاء المسؤولية : الشركات المذكورة أعلاه ليست مرتبة بأي ترتيب معين.
- احصل على نظرة عامة على أهم اللاعبين الرئيسيين في سوق الشاحنات العسكرية
أخبار سوق الشاحنات العسكرية والتطورات الأخيرة
يتم تقييم سوق الشاحنات العسكرية من خلال جمع البيانات النوعية والكمية بعد البحث الأولي والثانوي، والتي تتضمن منشورات الشركات المهمة وبيانات الجمعيات وقواعد البيانات. فيما يلي قائمة بالتطورات في السوق فيما يتعلق بالابتكارات وتوسيع الأعمال والاستراتيجيات:
- في فبراير 2023، تجاوزت شركة تاترا للشاحنات، وهي شركة صناعة شاحنات مقرها جمهورية التشيك، مبيعاتها المتوقعة لعام 2022، حيث أنتجت وبيعت 1326 مركبة. وحققت مبيعات بلغت 7.12 مليار كرونة تشيكية (325.6 مليون دولار)، بزيادة 10% عن المخطط. وذهب معظم الإنتاج إلى السوق المحلية، مع تصنيع أقل من النصف للقطاعات المدنية مثل البناء والتعدين والزراعة، وكذلك لعملاء الإطفاء والإنقاذ. كما أنتجت تاترا مركبات لقطاع الدفاع، والتي سادت قليلاً بسبب المخاوف الأمنية الدولية واحتياجات الجيش التشيكي. وتخطط تاترا لزيادة أخرى في الإنتاج لعام 2023. (المصدر: تاترا للشاحنات، بيان صحفي)
- في نوفمبر 2022، أعلنت شركة Oshkosh Corporation عن الاستحواذ على شركة Hinowa SpA. تنتج هذه الشركة الدولية المملوكة للقطاع الخاص منصات العمل الجوية القائمة على المسارات، والشاحنات القلابة الصغيرة، وشاحنات الرفع، وعربات الهبوط. تشتهر شركة Hinowa بتصميماتها المتقدمة للمسارات وخبرتها في مجال الكهربة، مما يجعلها إضافة مثالية لقطاع معدات الوصول لدى شركة Oshkosh. ومن المتوقع أن يعمل الاستحواذ على تسريع قدرات شركة Oshkosh في مجال الكهربة وتوفير فرص النمو في الأسواق الأساسية والمجاورة. (المصدر: شركة Oshkosh Corporation، بيان صحفي)
تقرير سوق الشاحنات العسكرية: التغطية والنتائج المتوقعة
يوفر تقرير "حجم سوق الشاحنات العسكرية والتوقعات (2021-2031)" تحليلاً مفصلاً للسوق يغطي المجالات التالية:
- حجم سوق الشاحنات العسكرية وتوقعاته على المستويات العالمية والإقليمية والوطنية لجميع قطاعات السوق الرئيسية المشمولة بالنطاق.
- ديناميكيات السوق مثل المحركات والقيود والفرص الرئيسية
- اتجاهات سوق الشاحنات العسكرية
- تحليل مفصل لقوى PEST/Porter الخمس وSWOT
- تحليل سوق الشاحنات العسكرية يغطي اتجاهات السوق الرئيسية والإطار العالمي والإقليمي واللاعبين الرئيسيين واللوائح والتطورات الأخيرة في السوق
- تحليل المشهد التنافسي لسوق الشاحنات العسكرية والذي يغطي تركيز السوق، وتحليل خريطة الحرارة، واللاعبين البارزين، والتطورات الأخيرة.
- ملفات تعريف الشركة التفصيلية

نافين خبيرٌ متمرسٌ في أبحاث السوق والاستشارات، يتمتع بخبرةٍ تزيد عن 9 سنوات في مشاريع مُخصصة ومُشتركة واستشارية. يشغل حاليًا منصب نائب الرئيس المساعد، وقد نجح في إدارة أصحاب المصلحة عبر سلسلة قيمة المشاريع، وألّف أكثر من 100 تقرير بحثي وأكثر من 30 مهمة استشارية. يمتد نطاق عمله ليشمل مشاريع صناعية وحكومية، مساهمًا بشكل كبير في نجاح العملاء واتخاذ القرارات القائمة على البيانات.
نافين حاصلٌ على شهادة في هندسة الإلكترونيات والاتصالات من جامعة فرجينيا التقنية، كارناتاكا، وشهادة ماجستير في إدارة الأعمال في التسويق والعمليات من جامعة مانيبال. وهو عضوٌ نشطٌ في معهد مهندسي الكهرباء والإلكترونيات (IEEE) لمدة 9 سنوات، حيث شارك في مؤتمراتٍ وندواتٍ تقنية، وتطوّع على مستوى الأقسام والمناطق. قبل منصبه الحالي، عمل مستشارًا استراتيجيًا مساعدًا في IndustryARC، ومستشارًا للخوادم الصناعية في شركة هيوليت باكارد (HP Global).
- التحليل التاريخي (سنتان)، سنة الأساس، التوقعات (7 سنوات) مع معدل النمو السنوي المركب
- تحليل PEST و SWOT
- حجم السوق والقيمة / الحجم - عالمي، إقليمي، بلد
- الصناعة والمنافسة
- مجموعة بيانات إكسل
التقارير الحديثة
تقارير ذات صلة
شهادات العملاء
تقرير سوق أنظمة SCADA من Insight Partners شامل، ويقدم رؤى قيّمة حول الاتجاهات الحالية والتوقعات المستقبلية. تميّز الفريق باحترافية عالية وسرعة في الاستجابة ودعم مستمر طوال الوقت. نحن راضون جدًا ونوصي بشدة بخدماتهم.
ران كيديم شريك, شركة ريالي تكنولوجيز المحدودةطلبتُ تقريرًا عن سوق برمجيات محدد، وأعدّه الفريق في غضون أيام قليلة. كانت المعلومات ذات صلة وثيقة وعرضها جيد. ثم طلبتُ بعض التعديلات والإضافات على التقرير. وكان الفريق متجاوبًا للغاية، وحصلتُ على التقرير النهائي في أقل من أسبوع.
جان هيرفيه جين رئيس مجلس الإدارة, فيوتشر أناليتيكاعملنا مع شركة "إنسايت بارتنرز" لإجراء دراسة سوقية وتوقعات مهمة. زودونا برؤى واضحة حول الفرص والمخاطر، مما ساعدنا في صياغة خططنا. كانت أبحاثهم سهلة الاستخدام ومبنية على بيانات دقيقة، مما ساعدنا على اتخاذ قرارات ذكية وواثقة. نوصي بهم بشدة.
بيوش ناجبال نائب الرئيس الأول, شعاع عالي عالميقدّمت شركة Insight Partners أبحاثًا سوقية ثاقبة ومنظمة جيدًا بخبرة واسعة في هذا المجال. تميّز فريقهم بالاحترافية وسرعة الاستجابة طوال الوقت. وسهّل موقعهم الإلكتروني سهل الاستخدام الوصول إلى تقارير القطاع. نوصي بهم بشدة لخدمات بحثية موثوقة وعالية الجودة.
يوكيهيكو أداتشي المدير التنفيذي, ديب بلو، ذ.م.م.هذه أول مرة أشتري فيها تقرير سوق من The Insight Partners. رغم أنني كنت مترددًا في البداية، إلا أنني زرت موقعهم الإلكتروني وشعرت براحة أكبر للمخاطرة وشراء تقرير السوق. أنا راضٍ تمامًا عن جودة التقرير وخدمة العملاء. كانت لديّ عدة أسئلة وتعليقات حول التقرير الأولي، ولكن بعد بضع محادثات عبر البريد الإلكتروني مع محللهم، أعتقد أن لديّ تقريرًا يمكنني استخدامه كمدخل لعملية التخطيط الاستراتيجي لدينا. شكرًا جزيلاً لكم على تخصيص وقتكم الإضافي وجعل هذه التجربة إيجابية. سأوصي بخدماتكم للآخرين بالتأكيد، وستكونون أول من ألجأ إليه عندما نحتاج إلى المزيد من بيانات السوق.
جون سوزوكي الرئيس والرئيس التنفيذي وعضو مجلس الإدارة, بي كيه تكنولوجيزأود أن أقدّر دعمكم واحترافيتكم في الاستجابة لطلبي للحصول على معلومات بشأن سوق التشخيص المخبري للأمراض المعدية في نيجيريا. كما أُقدّر صبركم وتوجيهكم، واستعدادكم لتقديم خصم، مما مكّننا في النهاية من إتمام الصفقة. أتطلع إلى التعامل مع "ذا إنسايت بارتنرز" مستقبلًا، كل ذلك بفضل الانطباع الذي تركتموه لديّ نتيجةً لهذا اللقاء الأول.
الدكتور تشيجيوك أونيا المدير الإداري, شركة باينكريست للرعاية الصحية المحدودةسبب الشراء
- اتخاذ قرارات مدروسة
- فهم ديناميكيات السوق
- تحليل المنافسة
- رؤى العملاء
- توقعات السوق
- تخفيف المخاطر
- التخطيط الاستراتيجي
- مبررات الاستثمار
- تحديد الأسواق الناشئة
- تحسين استراتيجيات التسويق
- تعزيز الكفاءة التشغيلية
- مواكبة التوجهات التنظيمية


 احصل على عينة مجانية ل - سوق الشاحنات العسكرية