تقرير سوق الخرائط المحمولة 2031 حسب القطاعات والجغرافيا والديناميكيات والتطورات الأخيرة والرؤى الاستراتيجية
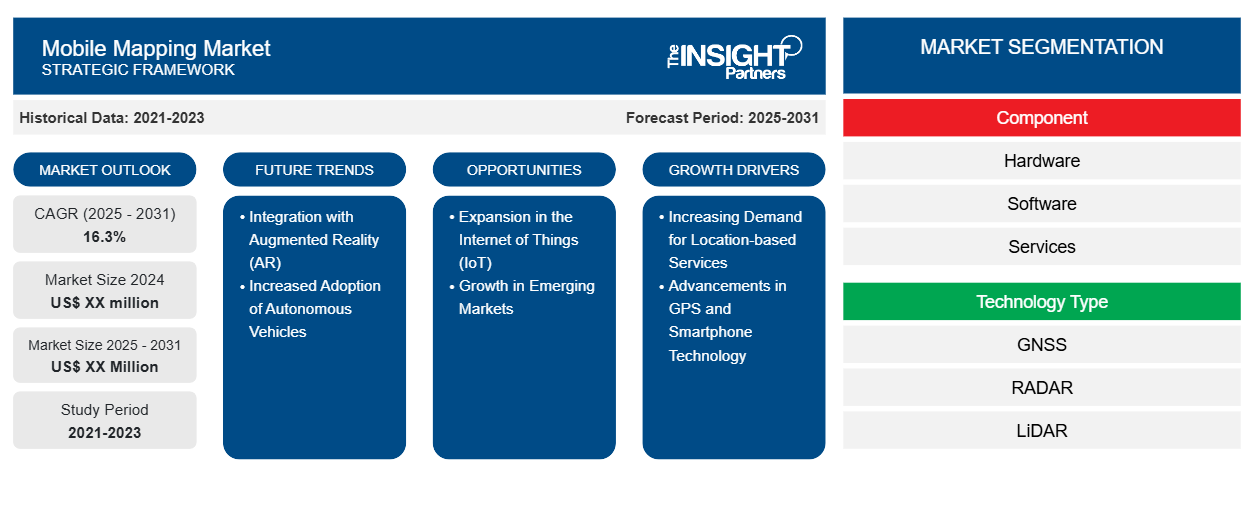
البيانات التاريخية : 2021-2023 | سنة الأساس : 2024 | فترة التنبؤ : 2025-2031حجم سوق الخرائط المتنقلة وتوقعاته (2021-2031)، والحصة العالمية والإقليمية، والاتجاهات، وفرص النمو. يغطي التقرير تحليلًا حسب المكونات (الأجهزة، والبرمجيات، والخدمات)، ونوع التكنولوجيا (GNSS، والرادار، والليدار)، والقطاعات الصناعية (الزراعة، والنفط والغاز، والاتصالات، والطاقة والمرافق، وغيرها).
- تاريخ التقرير : Mar 2026
- رمز التقرير : TIPRE00039537
- الفئة : التكنولوجيا والإعلام والاتصالات
- الحالة : قادم
- تنسيقات التقارير المتاحة :


- عدد الصفحات : 150
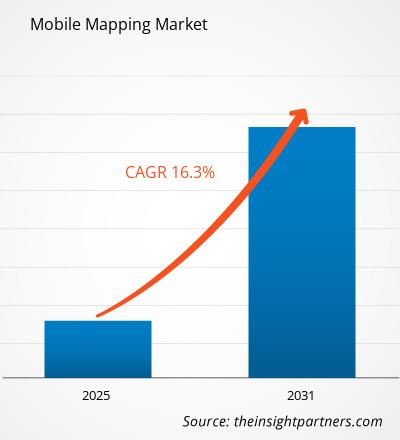
من المتوقع أن يسجل سوق رسم الخرائط عبر الهاتف المحمول معدل نمو سنوي مركب بنسبة 16.3٪ من عام 2025 إلى عام 2031، مع توسع حجم السوق من XX مليون دولار أمريكي في عام 2024 إلى XX مليون دولار أمريكي بحلول عام 2031.
يُقسّم التقرير حسب المكونات (الأجهزة، البرمجيات، الخدمات)، ونوع التكنولوجيا (النظام العالمي للملاحة عبر الأقمار الصناعية، الرادار، الليدار)، والقطاعات الصناعية (الزراعة، النفط والغاز، الاتصالات، الطاقة والمرافق، وغيرها). ويُفصّل التحليل العالمي على المستوى الإقليمي والدول الرئيسية. ويُقدّم التقرير القيمة بالدولار الأمريكي للتحليل والقطاعات المذكورة أعلاه.
غرض التقرير
يهدف تقرير "سوق خرائط الهاتف المحمول" الصادر عن شركة "إنسايت بارتنرز" إلى وصف المشهد الحالي والنمو المستقبلي، وأهم العوامل المحفزة، والتحديات، والفرص المتاحة. وسيوفر هذا التقرير رؤى ثاقبة لمختلف أصحاب المصلحة في قطاع الأعمال، مثل:
- مزودي التكنولوجيا/المصنعين: لفهم ديناميكيات السوق المتطورة ومعرفة فرص النمو المحتملة، وتمكينهم من اتخاذ قرارات استراتيجية مستنيرة.
- المستثمرون: إجراء تحليل شامل للاتجاهات فيما يتعلق بمعدل نمو السوق، والتوقعات المالية للسوق، والفرص المتاحة عبر سلسلة القيمة.
- الهيئات التنظيمية: لتنظيم السياسات ومراقبة الأنشطة في السوق بهدف تقليل الانتهاكات والحفاظ على ثقة المستثمرين ودعم سلامة السوق واستقرارها.
تجزئة سوق الخرائط المحمولة
عنصر
- الأجهزة
- برمجة
- خدمات
نوع التكنولوجيا
- نظام الملاحة العالمي عبر الأقمار الصناعية
- رادار
- ليدار
الصناعة العمودية
- زراعة
- النفط والغاز
- اتصالات
- الطاقة والمرافق
الجغرافيا
- أمريكا الشمالية
- أوروبا
- آسيا والمحيط الهادئ
- الشرق الأوسط وأفريقيا
- أمريكا الجنوبية والوسطى
قم بتخصيص هذا التقرير ليناسب متطلباتك
ستحصل على تخصيص لأي تقرير - مجانًا - بما في ذلك أجزاء من هذا التقرير، أو تحليل على مستوى الدولة، وحزمة بيانات Excel، بالإضافة إلى الاستفادة من العروض والخصومات الرائعة للشركات الناشئة والجامعات
سوق الخرائط المحمولة: رؤى استراتيجية
-
احصل على أهم اتجاهات السوق الرئيسية لهذا التقرير.ستتضمن هذه العينة المجانية تحليل البيانات، بدءًا من اتجاهات السوق وحتى التقديرات والتوقعات.
عوامل نمو سوق الخرائط المحمولة
- تزايد الطلب على الخدمات القائمة على الموقع: يُعدّ النمو السريع في اعتماد الخدمات القائمة على الموقع (LBS) محركًا رئيسيًا لسوق خرائط الهاتف المحمول. ومع سعي الشركات والمستهلكين للحصول على خدمات الملاحة الفورية، والتحليلات الجغرافية المكانية، والتسويق القائم على الموقع، أصبحت تطبيقات خرائط الهاتف المحمول ضرورية. سواءً لخدمات التوصيل، أو تطبيقات الملاحة، أو بيانات الموقع الشخصية، فإن الحاجة إلى حلول خرائط دقيقة وموثوقة للهاتف المحمول آخذة في الازدياد، مما يؤدي إلى زيادة الطلب على هذه التقنيات في مختلف القطاعات، مثل النقل، وتجارة التجزئة، والخدمات اللوجستية.
- التطورات في تقنية نظام تحديد المواقع العالمي (GPS) والهواتف الذكية: تُسهم التطورات المستمرة في تقنية نظام تحديد المواقع العالمي (GPS) وقدرات الهواتف الذكية في نمو سوق الخرائط المحمولة. وتُحسّن الدقة والسرعة وتكامل أجهزة الاستشعار، مثل مقاييس التسارع والجيروسكوبات والكاميرات، وظائف تطبيقات الخرائط المحمولة. وتُتيح هذه الابتكارات تحديد المواقع ورسم الخرائط بدقة أكبر، وتُحسّن تجربة المستخدم، مما يجعل حلول الخرائط المحمولة أكثر موثوقية وفعالية، مما يُسرّع نمو السوق.
اتجاهات مستقبل سوق الخرائط المحمولة
- التكامل مع الواقع المعزز: يُعد دمج تقنية الواقع المعزز (AR) اتجاهًا متزايدًا في رسم الخرائط عبر الأجهزة المحمولة. يوفر الواقع المعزز تجارب خرائط غامرة وتفاعلية، مما يسمح للمستخدمين بدمج المعلومات الرقمية مع العالم الحقيقي. ويتجلى هذا التوجه بشكل خاص في تطبيقات مثل الملاحة والتخطيط الحضري والسياحة، حيث يمكن عرض معلومات آنية، مثل الاتجاهات ونقاط الاهتمام وحالة المرور، من خلال الواقع المعزز على الأجهزة المحمولة. ومع تزايد شيوع الواقع المعزز، تتطور حلول رسم الخرائط عبر الأجهزة المحمولة لتشمل هذه الميزات الغامرة.
- تزايد اعتماد المركبات ذاتية القيادة: يُعدّ انتشار المركبات ذاتية القيادة توجهًا رئيسيًا يُحفّز سوق الخرائط المتنقلة. تعتمد هذه المركبات اعتمادًا كبيرًا على بيانات خرائط دقيقة وآنية للتنقل في الشوارع وتجنب العوائق. تُعدّ منصات الخرائط المتنقلة جزءًا لا يتجزأ من تطوير وتشغيل المركبات ذاتية القيادة، إذ تُوفّر خرائط مُفصّلة ومُحدّثة للسيارات ذاتية القيادة. ومع استمرار نمو صناعة المركبات ذاتية القيادة، سيزداد الطلب على حلول الخرائط المتنقلة التي تدعم الملاحة في المركبات ورسم الخرائط في الوقت الفعلي.
فرص سوق الخرائط المحمولة
- التوسع في إنترنت الأشياء (IoT): يُتيح توسع إنترنت الأشياء (IoT) فرصةً كبيرةً لسوق الخرائط المتنقلة. فمع تزايد استخدام أجهزة إنترنت الأشياء في الحياة اليومية، يُمكن لحلول الخرائط المتنقلة الاستفادة من بيانات هذه الأجهزة المتصلة لتحسين دقة تحديد المواقع وتوفير رؤى آنية. ويمكن لقطاعات مثل المدن الذكية، والخدمات اللوجستية، والزراعة الاستفادة من حلول الخرائط المُدعّمة بإنترنت الأشياء، والتي تُوفر بيانات جغرافية مكانية مُحسّنة لتحسين عملية اتخاذ القرارات ورفع الكفاءة التشغيلية.
- النمو في الأسواق الناشئة: تُتيح الأسواق الناشئة، وخاصةً في مناطق مثل آسيا والمحيط الهادئ وأمريكا اللاتينية وأفريقيا، فرص نمو كبيرة لسوق خرائط الهاتف المحمول. ومع تزايد انتشار الهاتف المحمول وتطوير بنيته التحتية، يزداد الطلب على خدمات الخرائط وتحديد المواقع في هذه المناطق. تُساعد حلول خرائط الهاتف المحمول الشركات على تحسين عملياتها، وتحسين لوجستياتها، ودعم التنمية الحضرية في الأسواق سريعة النمو، مما يُتيح للشركات فرصةً مربحةً لتوسيع حضورها عالميًا.
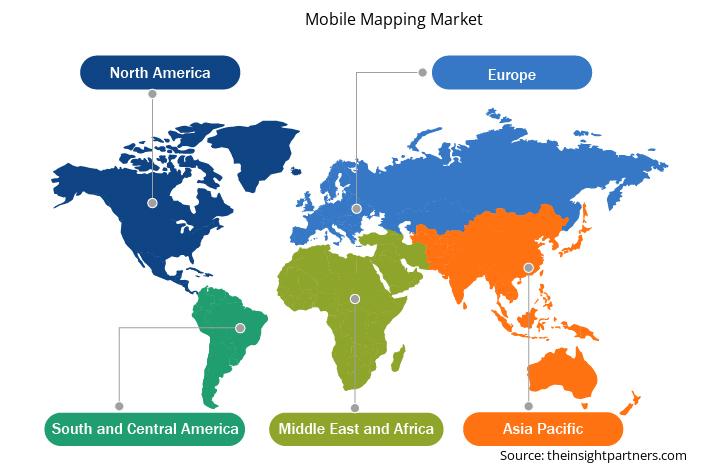
رؤى إقليمية حول سوق الخرائط المحمولة
قام محللو إنسايت بارتنرز بشرح شامل للاتجاهات والعوامل الإقليمية المؤثرة في سوق الخرائط المتنقلة خلال فترة التوقعات. ويناقش هذا القسم أيضًا قطاعات سوق الخرائط المتنقلة ومناطقها الجغرافية في أمريكا الشمالية، وأوروبا، وآسيا والمحيط الهادئ، والشرق الأوسط وأفريقيا، وأمريكا الجنوبية والوسطى.
- احصل على بيانات إقليمية محددة لسوق الخرائط المحمولة
نطاق تقرير سوق الخرائط المحمولة
| سمة التقرير | تفاصيل |
|---|---|
| حجم السوق في عام 2024 | XX مليون دولار أمريكي |
| حجم السوق بحلول عام 2031 | XX مليون دولار أمريكي |
| معدل النمو السنوي المركب العالمي (2025 - 2031) | 16.3% |
| البيانات التاريخية | 2021-2023 |
| فترة التنبؤ | 2025-2031 |
| القطاعات المغطاة |
حسب المكون
|
| المناطق والدول المغطاة |
أمريكا الشمالية
|
| قادة السوق وملفات تعريف الشركات الرئيسية |
|
كثافة اللاعبين في سوق الخرائط المحمولة: فهم تأثيرها على ديناميكيات الأعمال
يشهد سوق خرائط الهاتف المحمول نموًا سريعًا، مدفوعًا بتزايد طلب المستخدمين النهائيين نتيجةً لعوامل مثل تطور تفضيلات المستهلكين، والتقدم التكنولوجي، وزيادة الوعي بمزايا المنتج. ومع تزايد الطلب، تعمل الشركات على توسيع عروضها، والابتكار لتلبية احتياجات المستهلكين، والاستفادة من الاتجاهات الناشئة، مما يعزز نمو السوق.
تشير كثافة اللاعبين في السوق إلى توزيع الشركات العاملة في سوق أو قطاع معين. وتشير إلى عدد المنافسين (اللاعبين في السوق) الموجودين في سوق معين نسبةً إلى حجمه أو قيمته السوقية الإجمالية.
الشركات الرئيسية العاملة في سوق الخرائط المحمولة هي:
- خدمات الويب من أمازون
- شركة جوجل المحدودة
- شركة دولينجو
- استوديوهات موجانج
- كاهوت! آسا
- ألعاب ملحمية
إخلاء المسؤولية : الشركات المذكورة أعلاه ليست مرتبة بأي ترتيب معين.
- احصل على نظرة عامة على أهم اللاعبين الرئيسيين في سوق الخرائط المحمولة
نقاط البيع الرئيسية
- التغطية الشاملة: يغطي التقرير بشكل شامل تحليل المنتجات والخدمات والأنواع والمستخدمين النهائيين لسوق الخرائط المحمولة، مما يوفر صورة شاملة.
- تحليل الخبراء: تم تجميع التقرير على أساس الفهم العميق لخبراء الصناعة والمحللين.
- معلومات محدثة: يضمن التقرير أهمية الأعمال التجارية بسبب تغطيته للمعلومات الحديثة واتجاهات البيانات.
- خيارات التخصيص: يمكن تخصيص هذا التقرير لتلبية متطلبات العملاء المحددة وتلبية استراتيجيات العمل بشكل مناسب.
لذا، يُمكن أن يُساعد تقرير البحث حول سوق خرائط الهاتف المحمول في تمهيد الطريق لفهم سيناريوهات هذه الصناعة وآفاق نموها. ورغم وجود بعض المخاوف المُبررة، إلا أن فوائد هذا التقرير الإجمالية تفوق عيوبه.

أنكيتا خبيرة ديناميكية في أبحاث السوق والاستشارات، تتمتع بخبرة تزيد عن 8 سنوات في قطاعات التكنولوجيا والإعلام وتكنولوجيا المعلومات والاتصالات والإلكترونيات وأشباه الموصلات. وقد قادت ونفذت بنجاح أكثر من 100 مهمة استشارية وبحثية لعملاء عالميين مثل مايكروسوفت وأوراكل وشركة NEC وSAP وKPMG وExpeditors International. تشمل كفاءاتها الأساسية تقييم السوق، وتحليل البيانات، والتنبؤ، وصياغة الاستراتيجيات، والاستخبارات التنافسية، وكتابة التقارير.
أنكيتا بارعة في إدارة دورات المشاريع الكاملة، بدءًا من تصميم عروض ما قبل البيع ومناقشات العملاء، وصولًا إلى تقديم رؤى عملية بعد البيع. كما أنها ماهرة في إدارة فرق متعددة الوظائف، وهيكلة وحدات بحثية معقدة، ومواءمة الحلول مع أهداف العمل الخاصة بالعملاء. وقد مكنتها مهاراتها الممتازة في التواصل والقيادة والعرض التقديمي من تحقيق نتائج قيّمة باستمرار في بيئات سوقية سريعة التطور.
- التحليل التاريخي (سنتان)، سنة الأساس، التوقعات (7 سنوات) مع معدل النمو السنوي المركب
- تحليل PEST و SWOT
- حجم السوق والقيمة / الحجم - عالمي، إقليمي، بلد
- الصناعة والمنافسة
- مجموعة بيانات إكسل
التقارير الحديثة
تقارير ذات صلة
شهادات العملاء
تقرير سوق أنظمة SCADA من Insight Partners شامل، ويقدم رؤى قيّمة حول الاتجاهات الحالية والتوقعات المستقبلية. تميّز الفريق باحترافية عالية وسرعة في الاستجابة ودعم مستمر طوال الوقت. نحن راضون جدًا ونوصي بشدة بخدماتهم.
ران كيديم شريك, شركة ريالي تكنولوجيز المحدودةطلبتُ تقريرًا عن سوق برمجيات محدد، وأعدّه الفريق في غضون أيام قليلة. كانت المعلومات ذات صلة وثيقة وعرضها جيد. ثم طلبتُ بعض التعديلات والإضافات على التقرير. وكان الفريق متجاوبًا للغاية، وحصلتُ على التقرير النهائي في أقل من أسبوع.
جان هيرفيه جين رئيس مجلس الإدارة, فيوتشر أناليتيكاعملنا مع شركة "إنسايت بارتنرز" لإجراء دراسة سوقية وتوقعات مهمة. زودونا برؤى واضحة حول الفرص والمخاطر، مما ساعدنا في صياغة خططنا. كانت أبحاثهم سهلة الاستخدام ومبنية على بيانات دقيقة، مما ساعدنا على اتخاذ قرارات ذكية وواثقة. نوصي بهم بشدة.
بيوش ناجبال نائب الرئيس الأول, شعاع عالي عالميقدّمت شركة Insight Partners أبحاثًا سوقية ثاقبة ومنظمة جيدًا بخبرة واسعة في هذا المجال. تميّز فريقهم بالاحترافية وسرعة الاستجابة طوال الوقت. وسهّل موقعهم الإلكتروني سهل الاستخدام الوصول إلى تقارير القطاع. نوصي بهم بشدة لخدمات بحثية موثوقة وعالية الجودة.
يوكيهيكو أداتشي المدير التنفيذي, ديب بلو، ذ.م.م.هذه أول مرة أشتري فيها تقرير سوق من The Insight Partners. رغم أنني كنت مترددًا في البداية، إلا أنني زرت موقعهم الإلكتروني وشعرت براحة أكبر للمخاطرة وشراء تقرير السوق. أنا راضٍ تمامًا عن جودة التقرير وخدمة العملاء. كانت لديّ عدة أسئلة وتعليقات حول التقرير الأولي، ولكن بعد بضع محادثات عبر البريد الإلكتروني مع محللهم، أعتقد أن لديّ تقريرًا يمكنني استخدامه كمدخل لعملية التخطيط الاستراتيجي لدينا. شكرًا جزيلاً لكم على تخصيص وقتكم الإضافي وجعل هذه التجربة إيجابية. سأوصي بخدماتكم للآخرين بالتأكيد، وستكونون أول من ألجأ إليه عندما نحتاج إلى المزيد من بيانات السوق.
جون سوزوكي الرئيس والرئيس التنفيذي وعضو مجلس الإدارة, بي كيه تكنولوجيزأود أن أقدّر دعمكم واحترافيتكم في الاستجابة لطلبي للحصول على معلومات بشأن سوق التشخيص المخبري للأمراض المعدية في نيجيريا. كما أُقدّر صبركم وتوجيهكم، واستعدادكم لتقديم خصم، مما مكّننا في النهاية من إتمام الصفقة. أتطلع إلى التعامل مع "ذا إنسايت بارتنرز" مستقبلًا، كل ذلك بفضل الانطباع الذي تركتموه لديّ نتيجةً لهذا اللقاء الأول.
الدكتور تشيجيوك أونيا المدير الإداري, شركة باينكريست للرعاية الصحية المحدودةسبب الشراء
- اتخاذ قرارات مدروسة
- فهم ديناميكيات السوق
- تحليل المنافسة
- رؤى العملاء
- توقعات السوق
- تخفيف المخاطر
- التخطيط الاستراتيجي
- مبررات الاستثمار
- تحديد الأسواق الناشئة
- تحسين استراتيجيات التسويق
- تعزيز الكفاءة التشغيلية
- مواكبة التوجهات التنظيمية


 احصل على عينة مجانية ل - سوق الخرائط المحمولة