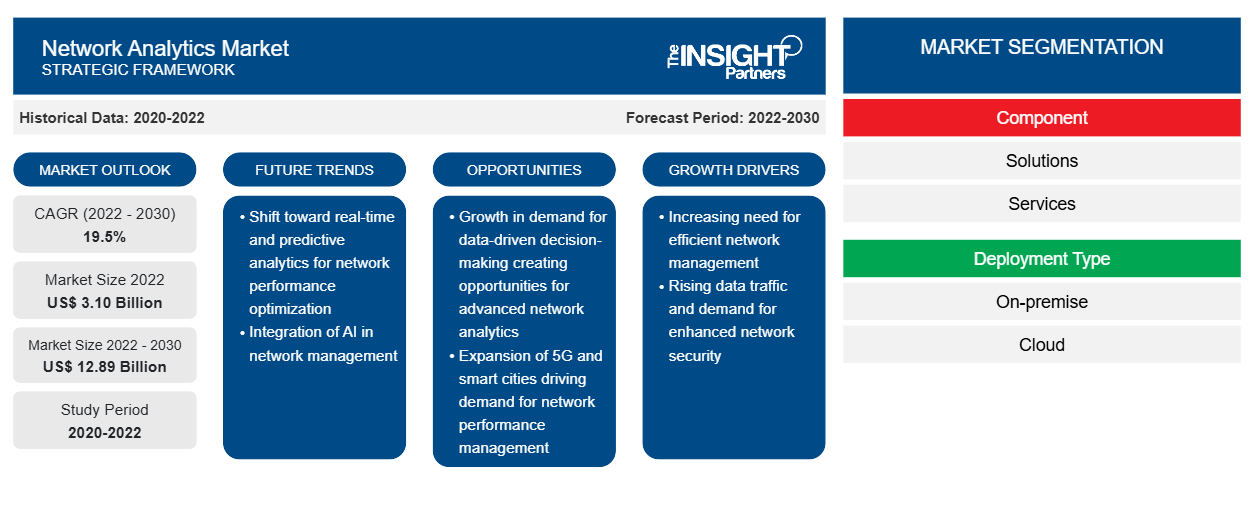
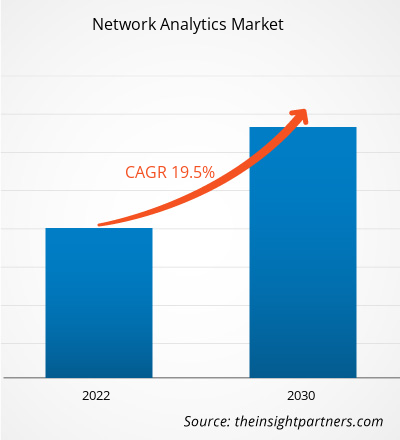
[تقرير بحثي] من المتوقع أن ينمو حجم سوق تحليلات الشبكة من 3.10 مليار دولار أمريكي في عام 2022 إلى 12.89 مليار دولار أمريكي بحلول عام 2030؛ ومن المتوقع أن يسجل معدل نمو سنوي مركب بنسبة 19.5٪ من عام 2022 إلى عام 2030.
يؤكد تقرير سوق تحليلات الشبكة على العوامل الرئيسية التي تدفع السوق وتطورات اللاعبين البارزين.
وجهة نظر المحلل:
شهد سوق تحليلات الشبكات نموًا كبيرًا في السنوات الأخيرة. تعد التطورات والتعقيدات التكنولوجية، وزيادة حجم البيانات، والتغيرات في أنماط حركة المرور من العوامل الرئيسية التي تساهم في نمو السوق. بالإضافة إلى ذلك، من المتوقع أن يؤدي الوعي المتزايد بحماية البيانات إلى ظهور اتجاهات جديدة لسوق تحليلات الشبكات في السنوات القادمة.
تحليل السوق:
يشير تحليل الشبكة إلى عملية فحص وتفسير البيانات التي تولدها البنية الأساسية للشبكة والعمليات لاستخلاص رؤى قابلة للتنفيذ تدفع إلى اتخاذ قرارات تجارية مستنيرة وتحسينات تشغيلية. تتضمن هذه الممارسة الاستفادة من الأدوات والتقنيات المتقدمة لجمع بيانات الشبكة ومراقبتها وتحليلها، بهدف تحسين الأداء وتعزيز الأمان وتمكين تخصيص الموارد بكفاءة.
في سياق المؤسسات الحديثة، تلعب تحليلات الشبكة دورًا محوريًا في تمكين المؤسسات من اكتساب فهم شامل لنظامها البيئي للشبكة. من خلال التدقيق في البيانات المتعلقة بحركة المرور على الشبكة، واتصال الأجهزة، وأداء التطبيقات، وحوادث الأمان، يمكن للشركات تحديد الأنماط والشذوذ والاتجاهات التي تؤثر على عملياتها. وهذا بدوره يمكّنها من معالجة المشكلات المحتملة بشكل استباقي، وتبسيط إدارة الشبكة، وتعزيز تدابير الأمن السيبراني .
توفر تحليلات الشبكة رؤى قيمة حول سلوك المستخدم واستخدام التطبيق والأداء العام للشبكة، مما يسهل اتخاذ القرارات الاستراتيجية فيما يتعلق باستثمارات التكنولوجيا وتخطيط القدرة وترقيات البنية الأساسية. من خلال الاستفادة من قوة تحليلات الشبكة، يمكن للشركات تحسين موارد تكنولوجيا المعلومات الخاصة بها، وتعزيز تجارب المستخدم، ومواءمة استراتيجيات الشبكة الخاصة بها مع الأهداف التنظيمية الأوسع.
قم بتخصيص هذا التقرير ليناسب متطلباتك
ستحصل على تخصيص لأي تقرير - مجانًا - بما في ذلك أجزاء من هذا التقرير، أو تحليل على مستوى الدولة، وحزمة بيانات Excel، بالإضافة إلى الاستفادة من العروض والخصومات الرائعة للشركات الناشئة والجامعات
سوق تحليلات الشبكات:
- احصل على أهم اتجاهات السوق الرئيسية لهذا التقرير.ستتضمن هذه العينة المجانية تحليلاً للبيانات، بدءًا من اتجاهات السوق وحتى التقديرات والتوقعات.
محرك السوق:
الحاجة المتزايدة إلى إدارة الزيادة الهائلة في البيانات لدفع سوق تحليلات الشبكات
في المشهد الرقمي اليوم، يمثل انتشار أجهزة الشبكة والزيادة الهائلة في البيانات التي تولدها تحديًا ملحًا للشركات. وقد برزت الحاجة المتزايدة لإدارة هذا الطوفان من البيانات بشكل فعال كمحرك محوري يؤثر على الاستراتيجيات التنظيمية واستثمارات تكنولوجيا المعلومات. وصل تدفق البيانات من أجهزة الشبكة، بما في ذلك أجهزة استشعار إنترنت الأشياء والآلات المتصلة وأجهزة الموظفين، إلى مستويات غير مسبوقة، مما استلزم حلول إدارة قوية. ويعود هذا الارتفاع في البيانات إلى الترابط المتزايد بين الأجهزة والاعتماد المتزايد على التقنيات الرقمية عبر الصناعات. ونتيجة لذلك، تكافح الشركات مع تعقيدات تخزين ومعالجة واستخلاص رؤى قابلة للتنفيذ من هذا الحجم الهائل من البيانات.
ولمعالجة هذا التحدي، تدرك المؤسسات بشكل متزايد أهمية تنفيذ حلول متقدمة لإدارة البيانات والتحليلات مصممة خصيصًا للمتطلبات الفريدة لبيئات شبكاتها. ومن خلال الاستفادة من الأدوات والتقنيات المتطورة، يمكن للشركات اكتساب رؤى قيمة حول أداء الشبكة والتهديدات الأمنية وسلوكيات المستخدم، وبالتالي تمكين اتخاذ القرارات المستنيرة وإدارة الشبكة بشكل استباقي. وعلاوة على ذلك، فإن القدرة على إدارة الزيادة الهائلة في البيانات التي تولدها أجهزة الشبكة بشكل فعال أمر أساسي في تعزيز الكفاءة التشغيلية وتحسين استخدام الموارد ودعم تدابير الأمن السيبراني. كما أنها تمكن المؤسسات من استخراج معلومات استخباراتية مفيدة من بياناتها، ودفع الابتكار، وتحسين تجارب العملاء، واكتساب ميزة تنافسية في السوق. وبالتالي، من المتوقع أن تعمل مثل هذه التطبيقات على دفع نمو سوق تحليلات الشبكات خلال فترة التنبؤ.
التجزئة والنطاق:
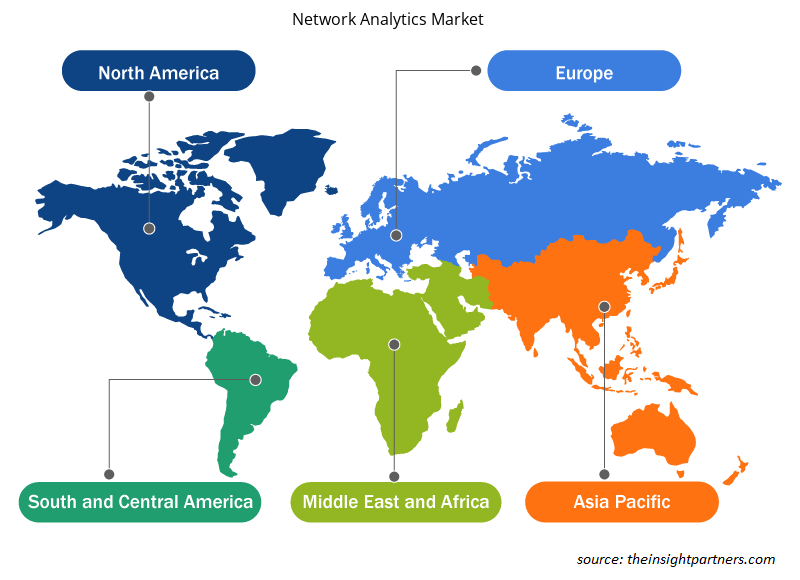
يتم تقسيم سوق تحليلات الشبكة العالمية على أساس المكون ونوع النشر والمستخدم النهائي والجغرافيا. بناءً على المكونات، يتم تقسيم السوق إلى حلول وخدمات. بناءً على نوع النشر، يتم تقسيم السوق إلى محلي وسحابي. حسب المستخدم النهائي، يتم تقسيم السوق إلى مزودي الاتصالات وموفري السحابة وموفري الخدمات المدارة وغيرهم. بناءً على الجغرافيا، يتم تقسيم السوق إلى أمريكا الشمالية وأوروبا ومنطقة آسيا والمحيط الهادئ والشرق الأوسط وأفريقيا وأمريكا الجنوبية.
التحليل القطاعي:
بناءً على المستخدم النهائي، يتم تقسيم تحليل سوق تحليلات الشبكة إلى مزودي الاتصالات ومزودي الخدمات السحابية ومزودي الخدمات المدارة وغيرهم. احتل قطاع مزودي الاتصالات أكبر حصة في سوق تحليلات الشبكة في عام 2022. تتعامل شركات الاتصالات مع كميات هائلة من البيانات من أجهزة الشبكة وتفاعلات العملاء وسلوك المشتركين. تمكن حلول تحليلات الشبكة المؤسسات من استخلاص رؤى قيمة من هذه البيانات، وتحسين خدمات العملاء والتجربة الشاملة. علاوة على ذلك، يتطلب نشر شبكات الجيل الخامس حلول تحليلات الشبكة المتطورة لإدارة الزيادة في حجم البيانات والاتصال الديناميكي بالشبكة والحاجة إلى زمن انتقال منخفض. من المتوقع أن تؤدي الحاجة المتزايدة إلى حلول تحليلات الشبكة لتحسين الكفاءة التشغيلية داخل قطاع الاتصالات إلى تعزيز توسع سوق تحليلات الشبكة.
التحليل الإقليمي:
يشمل تحليل سوق تحليلات الشبكات في أمريكا الشمالية دولًا مثل الولايات المتحدة وكندا والمكسيك. استحوذت الولايات المتحدة على أكبر حصة في سوق تحليلات الشبكات في أمريكا الشمالية في عام 2022 لأسباب مختلفة. أولاً، من المتوقع أن تعمل الوتيرة السريعة للتقدم التكنولوجي والتحول الرقمي في جميع أنحاء المنطقة على تحفيز الطلب على تحليلات الشبكات. تعمل هذه الحلول في المقام الأول على تعزيز الشبكات لاستيعاب التقنيات المتقدمة والمساعي الرقمية. علاوة على ذلك، تعطي المنظمات في أمريكا الشمالية الأولوية لاتخاذ القرارات المستندة إلى البيانات، وتمكنها حلول تحليلات الشبكات من اكتساب رؤى حول أداء الشبكة والأمان وسلوك المستخدم. ساهمت هذه العوامل أيضًا في نمو سوق تحليلات الشبكات في المنطقة.
في أكتوبر 2022، قدمت شركة أوراكل مجموعة Oracle Network Analytics Suite، وهي مجموعة من حلول التحليلات المصممة لدمج بيانات وظائف الشبكة مع التعلم الآلي والذكاء الاصطناعي. ويهدف هذا العرض إلى تمكين المشغلين من اتخاذ قرارات أكثر استنارة وتلقائية فيما يتعلق بالاستقرار والأداء العام لشبكة الجيل الخامس بأكملها. وعلى وجه التحديد، تمكن المجموعة المشغلين من تحديد الشذوذ الذي قد يؤدي إلى فشل حرج في وظائف الشبكة، مما يؤثر في النهاية على خدمة العملاء. وبالتالي، من المتوقع أن تعمل مثل هذه المبادرات على دفع نمو سوق تحليلات الشبكات.
رؤى إقليمية حول سوق تحليلات الشبكات
لقد قام المحللون في Insight Partners بشرح الاتجاهات والعوامل الإقليمية المؤثرة على سوق تحليلات الشبكة طوال فترة التوقعات بشكل شامل. يناقش هذا القسم أيضًا قطاعات سوق تحليلات الشبكة والجغرافيا في جميع أنحاء أمريكا الشمالية وأوروبا ومنطقة آسيا والمحيط الهادئ والشرق الأوسط وأفريقيا وأمريكا الجنوبية والوسطى.
- احصل على بيانات إقليمية محددة لسوق تحليلات الشبكة
نطاق تقرير سوق تحليلات الشبكة
| سمة التقرير | تفاصيل |
|---|---|
| حجم السوق في عام 2022 | 3.10 مليار دولار أمريكي |
| حجم السوق بحلول عام 2030 | 12.89 مليار دولار أمريكي |
| معدل النمو السنوي المركب العالمي (2022 - 2030) | 19.5% |
| البيانات التاريخية | 2020-2022 |
| فترة التنبؤ | 2022-2030 |
| القطاعات المغطاة | حسب المكون
|
| المناطق والدول المغطاة | أمريكا الشمالية
|
| قادة السوق وملفات تعريف الشركات الرئيسية |
|
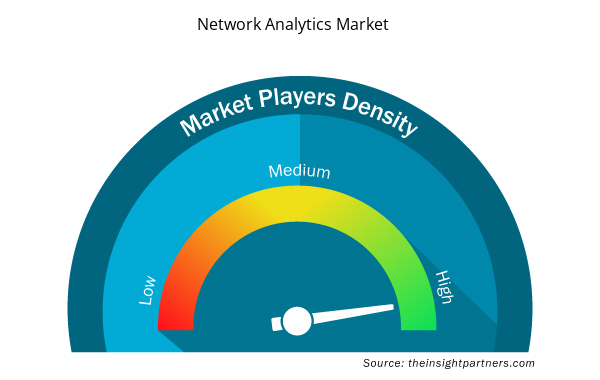
كثافة اللاعبين في سوق تحليلات الشبكات: فهم تأثيرها على ديناميكيات الأعمال
يشهد سوق تحليلات الشبكات نموًا سريعًا، مدفوعًا بالطلب المتزايد من جانب المستخدم النهائي بسبب عوامل مثل تفضيلات المستهلكين المتطورة والتقدم التكنولوجي والوعي المتزايد بفوائد المنتج. ومع ارتفاع الطلب، تعمل الشركات على توسيع عروضها والابتكار لتلبية احتياجات المستهلكين والاستفادة من الاتجاهات الناشئة، مما يؤدي إلى زيادة نمو السوق.
تشير كثافة اللاعبين في السوق إلى توزيع الشركات أو المؤسسات العاملة في سوق أو صناعة معينة. وهي تشير إلى عدد المنافسين (اللاعبين في السوق) الموجودين في مساحة سوق معينة نسبة إلى حجمها أو قيمتها السوقية الإجمالية.
الشركات الرئيسية العاملة في سوق تحليلات الشبكة هي:
- شركة آي بي إم
- شركة هيوليت باكارد لتطوير المشاريع
- شركة فورتينت
- شركة هواوي للتكنولوجيا المحدودة
- شركة سيسكو سيستمز
إخلاء المسؤولية : الشركات المذكورة أعلاه ليست مرتبة بأي ترتيب معين.
- احصل على نظرة عامة على أهم اللاعبين الرئيسيين في سوق تحليلات الشبكة
تحليل اللاعب الرئيسي:
يؤكد تقرير سوق تحليلات الشبكات على العوامل الرئيسية التي تدفع السوق وتطورات اللاعبين البارزين. تعد IBM Corporation وHewlett Packard Enterprise Development LP وFortinet، Inc. وHuawei Technologies Co.، Ltd. وCisco Systems، Inc. وBroadcom، Inc. وExtreme Networks، Inc. وJuniper Networks، Inc. وSandvine Corporation وCiena Corporation وAllot Ltd. وNivid Technologies من بين اللاعبين البارزين الذين تم عرضهم في تقرير سوق تحليلات الشبكات.
التطورات الأخيرة:
تعتمد الشركات العاملة في سوق تحليلات الشبكات بشكل كبير على الاستراتيجيات غير العضوية والعضوية مثل عمليات الدمج والاستحواذ. وفيما يلي بعض التطورات الرئيسية الأخيرة في السوق:
- في مايو 2023، قدمت شركة Juniper Networks, Inc. خدمة Mist Access Assurance، مما يمثل إنجازًا مهمًا باعتبارها أول خدمة سحابية من نوعها. يستفيد هذا العرض المبتكر من Mist AI وسحابة الخدمات المصغرة المعاصرة لتوفير مجموعة شاملة من إمكانيات التحكم في الوصول إلى الشبكة (NAC) وإدارة السياسات. والجدير بالذكر أن هذه الإمكانيات تشمل الوصول السلكي والوصول اللاسلكي والموقع الداخلي وSD-WAN ومجموعة العميل إلى السحابة الآمنة من Juniper، مما يوفر أتمتة لا مثيل لها ورؤية وضمانًا للتحكم في الوصول وإنفاذ السياسات بشكل متفوق. والنتيجة هي حل لا يضمن فقط وفورات تشغيلية استثنائية ولكنه يوفر أيضًا للشركات المرونة والبساطة اللازمتين للتنقل بين تعقيدات إدارة الشبكة الحديثة.
- في يونيو 2023، قدمت شركة Cisco منصة Networking Cloud، بهدف تبسيط إدارة معدات الشبكات من خلال واجهة موحدة ومعيارية. وتزامن هذا الإطلاق مع تحديثات لمنتجات Cisco المختلفة، مثل خدمة مراقبة البنية التحتية ThousandEyes ومجموعة منتجات Catalyst.
- في يونيو 2022، كشفت شركة IBM Corporation في مؤتمر RSAC 2022 عن نيتها الاستحواذ على Randori، وهي شركة بارزة في مجال إدارة سطح الهجوم والأمن السيبراني الهجومي ومقرها بوسطن. تتخصص Randori في مساعدة العملاء في تحديد الأصول الخارجية المرئية للمهاجمين المحتملين، سواء كانت موجودة في الموقع أو في السحابة، وإعطاء الأولوية للأصول الأكثر أهمية للحماية.
- في أكتوبر 2022، قدمت شركة أوراكل مجموعة Oracle Network Analytics Suite، وهي مجموعة من حلول التحليلات المصممة لدمج بيانات وظائف الشبكة مع التعلم الآلي والذكاء الاصطناعي. تهدف هذه المجموعة إلى تمكين المشغلين من اتخاذ قرارات أكثر استنارة وتلقائية فيما يتعلق بالاستقرار العام وأداء جوهر شبكة الجيل الخامس بالكامل. على وجه التحديد، تمكن المجموعة المشغلين من تحديد الشذوذ بسرعة والذي قد يؤدي إلى فشل حرج في وظائف الشبكة، مما يؤثر في النهاية على خدمة العملاء. تم وضع هذه المجموعة الجديدة بشكل استراتيجي لمساعدة مشغلي الاتصالات في الاستفادة من التقنيات المتقدمة، مثل التعلم الآلي والذكاء الاصطناعي، لتحسين عمليات اتخاذ القرار وضمان الأداء الأمثل لشبكات الجيل الخامس الخاصة بهم. من خلال الاستفادة من قوة تحليلات البيانات والتقنيات المتطورة، يمكن للمشغلين معالجة الانقطاعات المحتملة في الشبكة بشكل استباقي والحفاظ على مستوى عالٍ من موثوقية الخدمة لعملائهم. تمممثل مجموعة Oracle Network Analytics Suite تقدمًا كبيرًا في مجال تحليلات الشبكة، حيث توفر للمشغلين الأدوات التي يحتاجون إليها للتنقل في تعقيدات إدارة شبكة الجيل الخامس بدقة وكفاءة أكبر. مع استمرار تطور صناعة الاتصالات، فإن الحلول مثل Oracle Network Analytics Suite على أتم الاستعداد للعب دور محوري في دفع التميز التشغيلي وتقديم تجارب استثنائية للعملاء.
- التحليل التاريخي (سنتان)، السنة الأساسية، التوقعات (7 سنوات) مع معدل النمو السنوي المركب
- تحليل PEST و SWOT
- حجم السوق والقيمة / الحجم - عالميًا وإقليميًا وقطريًا
- الصناعة والمنافسة
- مجموعة بيانات Excel


Report Coverage
Revenue forecast, Company Analysis, Industry landscape, Growth factors, and Trends

Segment Covered
This text is related
to segments covered.

Regional Scope
North America, Europe, Asia Pacific, Middle East & Africa, South & Central America

Country Scope
This text is related
to country scope.
الأسئلة الشائعة
The network analytics market is expected to reach US$ 12.89 Billion by 2030.
The network analytics market was estimated to be valued at US$ 3.10 billion in 2022 and is projected to reach US$ 12.89 billion by 2030; it is anticipated to grow at a CAGR of 19.5% over the forecast period.
Technological advancements and complexities, increase in data volume, and changes in traffic patterns are the major driving factors in the network analytics market.
The growing adoption of cloud-based network analytics solutions are expected to be a major future trend of the network analytics market in the coming years.
Asia Pacific is anticipated to grow at the fastest CAGR over the forecast period.
The key players holding majority shares in the network analytics market include IBM Corporation, Fortinet, Inc, Hewlett Packard Enterprise Development LP, Huawei Technologies Co., Ltd, and Cisco Systems, Inc. PLC.
The telecom providers segment led the network analytics market with a significant share in 2022.
The List of Companies - Network Analytics Market
- IBM Corporation
- Hewlett Packard Enterprise Development LP
- Fortinet, Inc.
- Huawei Technologies Co., Ltd.
- Cisco Systems, Inc.
- Broadcom, Inc.
- Extreme Networks, Inc.
- Juniper Networks, Inc.
- Sandvine Corporation
- Ciena Corporation
- Allot Ltd.
- Nivid Technologies
The Insight Partners performs research in 4 major stages: Data Collection & Secondary Research, Primary Research, Data Analysis and Data Triangulation & Final Review.
- Data Collection and Secondary Research:
As a market research and consulting firm operating from a decade, we have published and advised several client across the globe. First step for any study will start with an assessment of currently available data and insights from existing reports. Further, historical and current market information is collected from Investor Presentations, Annual Reports, SEC Filings, etc., and other information related to company’s performance and market positioning are gathered from Paid Databases (Factiva, Hoovers, and Reuters) and various other publications available in public domain.
Several associations trade associates, technical forums, institutes, societies and organization are accessed to gain technical as well as market related insights through their publications such as research papers, blogs and press releases related to the studies are referred to get cues about the market. Further, white papers, journals, magazines, and other news articles published in last 3 years are scrutinized and analyzed to understand the current market trends.
- Primary Research:
The primarily interview analysis comprise of data obtained from industry participants interview and answers to survey questions gathered by in-house primary team.
For primary research, interviews are conducted with industry experts/CEOs/Marketing Managers/VPs/Subject Matter Experts from both demand and supply side to get a 360-degree view of the market. The primary team conducts several interviews based on the complexity of the markets to understand the various market trends and dynamics which makes research more credible and precise.
A typical research interview fulfils the following functions:
- Provides first-hand information on the market size, market trends, growth trends, competitive landscape, and outlook
- Validates and strengthens in-house secondary research findings
- Develops the analysis team’s expertise and market understanding
Primary research involves email interactions and telephone interviews for each market, category, segment, and sub-segment across geographies. The participants who typically take part in such a process include, but are not limited to:
- Industry participants: VPs, business development managers, market intelligence managers and national sales managers
- Outside experts: Valuation experts, research analysts and key opinion leaders specializing in the electronics and semiconductor industry.
Below is the breakup of our primary respondents by company, designation, and region:

Once we receive the confirmation from primary research sources or primary respondents, we finalize the base year market estimation and forecast the data as per the macroeconomic and microeconomic factors assessed during data collection.
- Data Analysis:
Once data is validated through both secondary as well as primary respondents, we finalize the market estimations by hypothesis formulation and factor analysis at regional and country level.
- Macro-Economic Factor Analysis:
We analyse macroeconomic indicators such the gross domestic product (GDP), increase in the demand for goods and services across industries, technological advancement, regional economic growth, governmental policies, the influence of COVID-19, PEST analysis, and other aspects. This analysis aids in setting benchmarks for various nations/regions and approximating market splits. Additionally, the general trend of the aforementioned components aid in determining the market's development possibilities.
- Country Level Data:
Various factors that are especially aligned to the country are taken into account to determine the market size for a certain area and country, including the presence of vendors, such as headquarters and offices, the country's GDP, demand patterns, and industry growth. To comprehend the market dynamics for the nation, a number of growth variables, inhibitors, application areas, and current market trends are researched. The aforementioned elements aid in determining the country's overall market's growth potential.
- Company Profile:
The “Table of Contents” is formulated by listing and analyzing more than 25 - 30 companies operating in the market ecosystem across geographies. However, we profile only 10 companies as a standard practice in our syndicate reports. These 10 companies comprise leading, emerging, and regional players. Nonetheless, our analysis is not restricted to the 10 listed companies, we also analyze other companies present in the market to develop a holistic view and understand the prevailing trends. The “Company Profiles” section in the report covers key facts, business description, products & services, financial information, SWOT analysis, and key developments. The financial information presented is extracted from the annual reports and official documents of the publicly listed companies. Upon collecting the information for the sections of respective companies, we verify them via various primary sources and then compile the data in respective company profiles. The company level information helps us in deriving the base number as well as in forecasting the market size.
- Developing Base Number:
Aggregation of sales statistics (2020-2022) and macro-economic factor, and other secondary and primary research insights are utilized to arrive at base number and related market shares for 2022. The data gaps are identified in this step and relevant market data is analyzed, collected from paid primary interviews or databases. On finalizing the base year market size, forecasts are developed on the basis of macro-economic, industry and market growth factors and company level analysis.
- Data Triangulation and Final Review:
The market findings and base year market size calculations are validated from supply as well as demand side. Demand side validations are based on macro-economic factor analysis and benchmarks for respective regions and countries. In case of supply side validations, revenues of major companies are estimated (in case not available) based on industry benchmark, approximate number of employees, product portfolio, and primary interviews revenues are gathered. Further revenue from target product/service segment is assessed to avoid overshooting of market statistics. In case of heavy deviations between supply and demand side values, all thes steps are repeated to achieve synchronization.
We follow an iterative model, wherein we share our research findings with Subject Matter Experts (SME’s) and Key Opinion Leaders (KOLs) until consensus view of the market is not formulated – this model negates any drastic deviation in the opinions of experts. Only validated and universally acceptable research findings are quoted in our reports.
We have important check points that we use to validate our research findings – which we call – data triangulation, where we validate the information, we generate from secondary sources with primary interviews and then we re-validate with our internal data bases and Subject matter experts. This comprehensive model enables us to deliver high quality, reliable data in shortest possible time.
 احصل على عينة مجانية لهذا التقرير