سوق جدار الحماية لأمن الشبكات – برامج التشغيل والاتجاهات والفرص وإحصاءات النمو | 2031
البيانات التاريخية : 2021-2022 | سنة الأساس : 2023 | فترة التنبؤ : 2023-2031حجم سوق جدار حماية أمن الشبكات وتوقعاته (2021-2031)، والحصة العالمية والإقليمية، والاتجاهات، وفرص النمو. تغطية تقرير تحليلي: حسب المكون (الحلول والخدمات)، والنشر (محليًا وسحابيًا)، والموقع الجغرافي.
- تاريخ التقرير : Mar 2026
- رمز التقرير : TIPRE00003402
- الفئة : التكنولوجيا والإعلام والاتصالات
- الحالة : البيانات الصادرة
- تنسيقات التقارير المتاحة :


- عدد الصفحات : 150
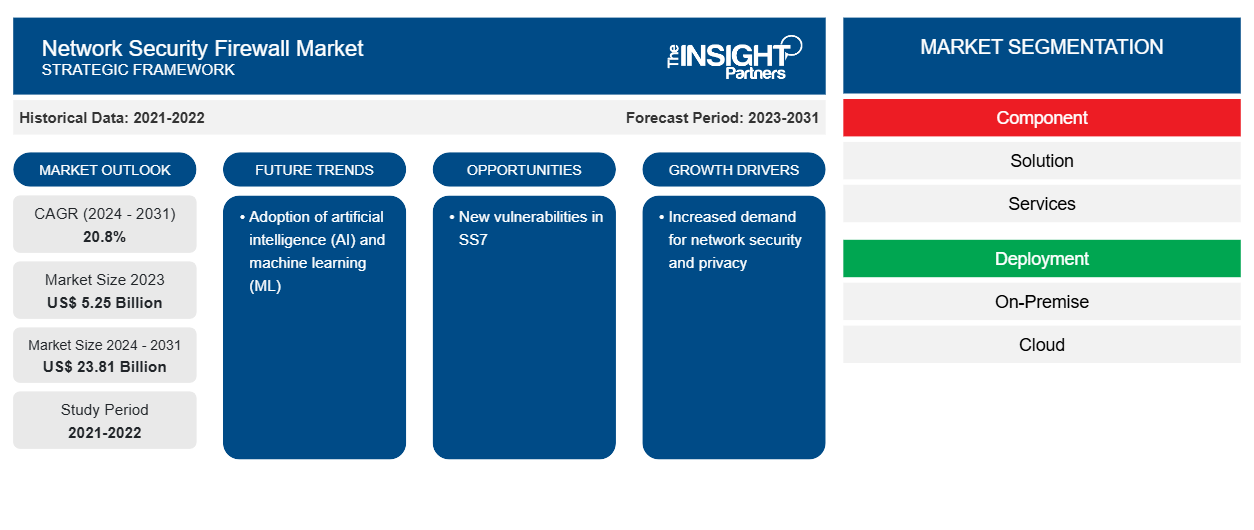
من المتوقع أن ينمو حجم سوق جدار حماية أمان الشبكة العالمي من 5.25 مليار دولار أمريكي في عام 2023 إلى 23.81 مليار دولار أمريكي بحلول عام 2031؛ ومن المتوقع أن يتوسع بمعدل نمو سنوي مركب قدره 20.8٪ من عام 2024 إلى عام 2031. ومن المرجح أن يظل دمج تقنيات الذكاء الاصطناعي (AI) والتعلم الآلي (ML) اتجاهًا رئيسيًا في سوق جدار حماية أمان الشبكة.
تحليل سوق جدار حماية أمن الشبكات
إن الحاجة المتزايدة إلى تدابير قوية لأمن الشبكات والخصوصية تشكل محركًا رئيسيًا لسوق جدران الحماية الأمنية للشبكات. وتستثمر المؤسسات في مختلف الصناعات بشكل متزايد في حلول أمن الشبكات لحماية بياناتها الحساسة ومنع الوصول غير المصرح به.
نظرة عامة على سوق جدران الحماية الأمنية للشبكات
يعد جدار الحماية الأمني للشبكة مكونًا حيويًا في حماية البنية الأساسية الرقمية للشركة ضد التهديدات السيبرانية . فهو يعمل كحاجز بين الشبكة الداخلية والشبكات الخارجية، مثل الإنترنت، من خلال مراقبة حركة المرور الواردة والصادرة من الشبكة والتحكم فيها. ويضمن حل جدار الحماية هذا السماح فقط للحزم المصرح بها والآمنة بالمرور أثناء حظر حركة المرور الضارة أو الخبيثة المحتملة. من الناحية العملية، يعمل جدار الحماية الأمني للشبكة عن طريق فحص كل حزمة بيانات تدخل الشبكة أو تخرج منها. ويحلل مصدر الحزمة ووجهتها ومحتواها، ويقارنها بقواعد وسياسات الأمان المحددة مسبقًا. ويمكن تكوين هذه القواعد للسماح بأنواع معينة من حركة المرور أو رفضها بناءً على عوامل مثل عناوين IP أو أرقام المنافذ أو البروتوكولات أو توقيعات التطبيق.
قم بتخصيص هذا التقرير ليناسب متطلباتك
ستحصل على تخصيص لأي تقرير - مجانًا - بما في ذلك أجزاء من هذا التقرير، أو تحليل على مستوى الدولة، وحزمة بيانات Excel، بالإضافة إلى الاستفادة من العروض والخصومات الرائعة للشركات الناشئة والجامعات
سوق جدران الحماية الأمنية للشبكات: رؤى استراتيجية
-
احصل على أهم اتجاهات السوق الرئيسية لهذا التقرير.ستتضمن هذه العينة المجانية تحليلاً للبيانات، بدءًا من اتجاهات السوق وحتى التقديرات والتوقعات.
محركات وفرص سوق جدار حماية أمن الشبكات
زيادة الطلب على أمن الشبكات والخصوصية لصالح نمو سوق جدران حماية أمن الشبكات
إن الطلب المتزايد على تدابير أمن الشبكات والخصوصية القوية مدفوع بالحاجة إلى حماية البيانات الحساسة ومنع الوصول غير المصرح به. وتدرك المؤسسات في مختلف الصناعات أهمية الاستثمار في حلول أمن الشبكات لحماية معلوماتها القيمة. يتضمن أمن الشبكات إنشاء نهج دفاعي استراتيجي لتأمين بيانات المؤسسة ومواردها عبر شبكتها. فهو يحمي من التهديدات المحتملة والوصول غير المصرح به، بغض النظر عن حجم المؤسسة أو صناعتها أو بنيتها الأساسية. ومن خلال تنفيذ تدابير أمن الشبكات، يمكن للمؤسسات ضمان سرية بياناتها وسلامتها وتوافرها.
ثغرات جديدة في SS7
SS7، أو نظام الإشارة رقم 7، هو بروتوكول إشارات يستخدم في شبكات الاتصالات لتبادل المعلومات اللازمة لتمرير المكالمات والرسائل النصية بين الشبكات وضمان الفوترة الصحيحة. ومع ذلك، أثار اكتشاف نقاط ضعف جديدة في SS7 مخاوف بشأن أمن الشبكة والخصوصية. يمكن للمهاجمين استغلال هذه الثغرات للقيام بأنشطة ضارة مثل سرقة البيانات والتنصت واعتراض الرسائل النصية وتتبع الموقع والاحتيال ورفض الخدمة. ونتيجة لذلك، تستثمر المنظمات بشكل متزايد في حلول جدران الحماية القوية لحماية شبكاتها من هذه المخاطر. تم تصميم شبكات SS7 في البداية كأنظمة مغلقة وموثوقة بين مزودي الاتصالات. ومع ذلك، مع انتشار الأجهزة المحمولة والتطبيقات، تم وضع بروتوكولات اتصال إضافية فوق SS7، مما أدى إلى إنشاء نقاط دخول للهجمات المحتملة. يمكن للمتسللين استغلال الثغرات الأمنية في بروتوكول SS7 للحصول على وصول غير مصرح به إلى النظام، مما يمكنهم من اعتراض المكالمات الصوتية والرسائل النصية، وحتى تتبع موقع مستخدمي الهواتف المحمولة.
تقرير تحليل تجزئة سوق جدار حماية أمان الشبكة
القطاعات الرئيسية التي ساهمت في اشتقاق مكون تحليل سوق جدار حماية أمان الشبكة ونشره.
- بناءً على المكونات، ينقسم السوق إلى حلول وخدمات. احتل قطاع الحلول حصة سوقية أكبر في عام 2023.
- بناءً على النشر، ينقسم السوق إلى محلي وسحابي. احتل قطاع المحلي حصة سوقية أكبر في عام 2023.
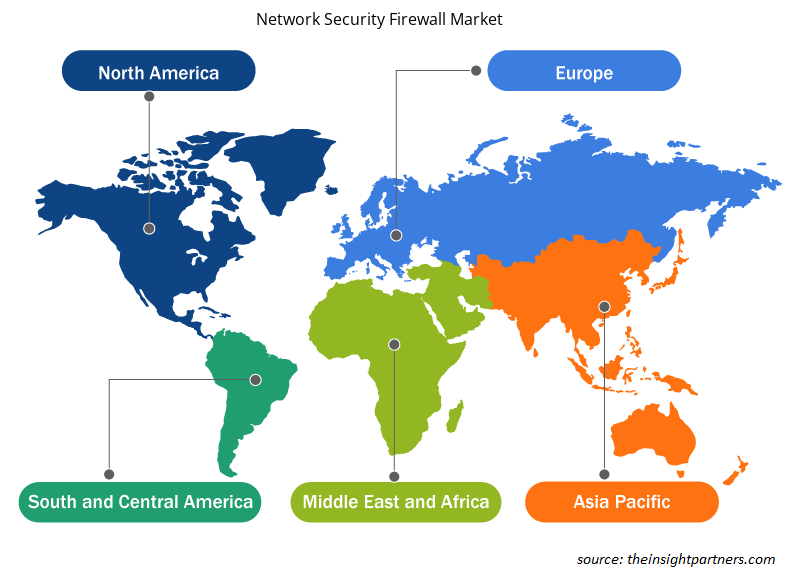
تحليل حصة سوق جدران الحماية الأمنية للشبكات حسب المنطقة الجغرافية
ينقسم النطاق الجغرافي لتقرير سوق جدار حماية أمان الشبكة بشكل أساسي إلى خمس مناطق: أمريكا الشمالية، وآسيا والمحيط الهادئ، وأوروبا، والشرق الأوسط وأفريقيا، وأمريكا الجنوبية/أمريكا الجنوبية والوسطى. سيطرت أمريكا الشمالية على سوق جدار حماية أمان الشبكة في عام 2023. ومن المتوقع أن تهيمن أمريكا الشمالية على سوق جدار حماية أمان الشبكة من حيث الإيرادات في المستقبل المنظور، مدفوعة بالتقدم السريع في تقنيات أمان الهاتف المحمول داخل المنطقة. وتعزى هذه الهيمنة في المقام الأول إلى الاستثمارات الكبيرة التي تم إجراؤها في أمان البيانات استجابة للزيادة الكبيرة في الهجمات الإلكترونية. في السنوات الأخيرة، وقعت العديد من المنظمات في أمريكا الشمالية ضحية للهجمات الإلكترونية، مما دفع إلى زيادة الوعي بأهمية حلول جدار الحماية. ونتيجة لذلك، تبنت الشركات الكبرى في مختلف القطاعات الإقليمية اعتماد تقنيات جدار الحماية، وبالتالي تغذية نمو السوق.
رؤى إقليمية حول سوق جدران الحماية لأمن الشبكات
لقد قام المحللون في Insight Partners بشرح الاتجاهات والعوامل الإقليمية المؤثرة على سوق جدار حماية أمان الشبكة طوال فترة التنبؤ بشكل شامل. يناقش هذا القسم أيضًا قطاعات سوق جدار حماية أمان الشبكة والجغرافيا في جميع أنحاء أمريكا الشمالية وأوروبا ومنطقة آسيا والمحيط الهادئ والشرق الأوسط وأفريقيا وأمريكا الجنوبية والوسطى.
- احصل على البيانات الإقليمية المحددة لسوق جدران حماية أمان الشبكة
نطاق تقرير سوق جدران حماية أمن الشبكات
| سمة التقرير | تفاصيل |
|---|---|
| حجم السوق في عام 2023 | 5.25 مليار دولار أمريكي |
| حجم السوق بحلول عام 2031 | 23.81 مليار دولار أمريكي |
| معدل النمو السنوي المركب العالمي (2024 - 2031) | 20.8% |
| البيانات التاريخية | 2021-2022 |
| فترة التنبؤ | 2023-2031 |
| القطاعات المغطاة |
حسب المكون
|
| المناطق والدول المغطاة |
أمريكا الشمالية
|
| قادة السوق وملفات تعريف الشركات الرئيسية |
|
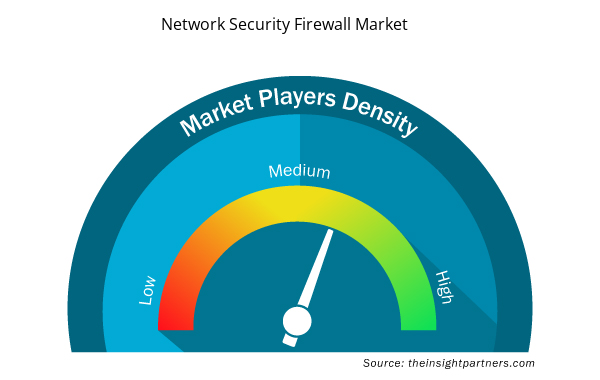
كثافة اللاعبين في سوق جدران حماية أمن الشبكات: فهم تأثيرها على ديناميكيات الأعمال
يشهد سوق جدار حماية أمان الشبكة نموًا سريعًا، مدفوعًا بالطلب المتزايد من المستخدم النهائي بسبب عوامل مثل تفضيلات المستهلك المتطورة والتقدم التكنولوجي والوعي المتزايد بفوائد المنتج. ومع ارتفاع الطلب، تعمل الشركات على توسيع عروضها والابتكار لتلبية احتياجات المستهلكين والاستفادة من الاتجاهات الناشئة، مما يؤدي إلى زيادة نمو السوق.
تشير كثافة اللاعبين في السوق إلى توزيع الشركات أو المؤسسات العاملة في سوق أو صناعة معينة. وهي تشير إلى عدد المنافسين (اللاعبين في السوق) الموجودين في مساحة سوق معينة نسبة إلى حجمها أو قيمتها السوقية الإجمالية.
الشركات الرئيسية العاملة في سوق جدار حماية أمن الشبكات هي:
- الأمن التكيفي للأجهزة المحمولة
- أيه إم دي تيليكوم إس إيه
- تكنولوجيات أنام
- سيليوسيس
- شركة سيسكو سيستمز
- شركة موبيليوم
إخلاء المسؤولية : الشركات المذكورة أعلاه ليست مرتبة بأي ترتيب معين.
- احصل على نظرة عامة على أهم اللاعبين الرئيسيين في سوق جدار حماية أمان الشبكة
أخبار سوق جدار حماية أمن الشبكات والتطورات الأخيرة
يتم تقييم سوق جدار حماية أمان الشبكة من خلال جمع البيانات النوعية والكمية بعد البحث الأولي والثانوي، والتي تتضمن منشورات الشركات المهمة وبيانات الجمعيات وقواعد البيانات. فيما يلي قائمة بالتطورات في السوق:
- في مارس 2023، كشفت شركة XM Cyber، وهي شركة بارزة في مجال أمن السحابة الهجينة، عن تعاونها الاستراتيجي مع شركة SAP. ومن خلال الاستفادة من الميزات المتقدمة لمنصة إدارة التعرض من شركة XM Cyber وتكنولوجيا مسار الهجوم المتطورة، تهدف هذه الشراكة إلى مساعدة الشركات التي تعتمد على حلول SAP مثل RISE مع SAP وSAP eCommerce Cloud في تحويل بياناتها وسير عملها بسلاسة إلى السحابة مع تقليل المخاطر وضمان أمان غير قابل للاختراق. ويمكّن هذا التعاون عملاء SAP من الاستفادة من تكنولوجيا إدارة التعرض من شركة XM Cyber، مما يمكنهم من اكتساب رؤية شاملة عبر سطح الهجوم بالكامل، بما في ذلك البيئات المحلية والسحابية. وبالتالي، يمكن للشركات اكتشاف التهديدات المحتملة وتحييدها بشكل استباقي قبل أن تتجسد، مما يحمي أصولها وعملياتها الحيوية.
(المصدر: SAP SE، بيان صحفي، 2023)
تقرير سوق جدار حماية أمن الشبكات والتغطية والنتائج المتوقعة
يوفر تقرير "حجم سوق جدار حماية أمان الشبكة والتوقعات (2021-2031)" تحليلاً مفصلاً للسوق يغطي المجالات التالية:
- حجم السوق والتوقعات على المستويات العالمية والإقليمية والوطنية لجميع قطاعات السوق الرئيسية التي يغطيها النطاق
- ديناميكيات السوق مثل المحركات والقيود والفرص الرئيسية
- الاتجاهات المستقبلية الرئيسية
- تحليل مفصل لقوى PEST/Porter الخمس وSWOT
- تحليل السوق العالمي والإقليمي الذي يغطي اتجاهات السوق الرئيسية واللاعبين الرئيسيين واللوائح والتطورات الأخيرة في السوق
- تحليل المشهد الصناعي والمنافسة الذي يغطي تركيز السوق، وتحليل خريطة الحرارة، واللاعبين البارزين، والتطورات الأخيرة
- ملفات تعريف الشركة التفصيلية

أنكيتا خبيرة ديناميكية في أبحاث السوق والاستشارات، تتمتع بخبرة تزيد عن 8 سنوات في قطاعات التكنولوجيا والإعلام وتكنولوجيا المعلومات والاتصالات والإلكترونيات وأشباه الموصلات. وقد قادت ونفذت بنجاح أكثر من 100 مهمة استشارية وبحثية لعملاء عالميين مثل مايكروسوفت وأوراكل وشركة NEC وSAP وKPMG وExpeditors International. تشمل كفاءاتها الأساسية تقييم السوق، وتحليل البيانات، والتنبؤ، وصياغة الاستراتيجيات، والاستخبارات التنافسية، وكتابة التقارير.
أنكيتا بارعة في إدارة دورات المشاريع الكاملة، بدءًا من تصميم عروض ما قبل البيع ومناقشات العملاء، وصولًا إلى تقديم رؤى عملية بعد البيع. كما أنها ماهرة في إدارة فرق متعددة الوظائف، وهيكلة وحدات بحثية معقدة، ومواءمة الحلول مع أهداف العمل الخاصة بالعملاء. وقد مكنتها مهاراتها الممتازة في التواصل والقيادة والعرض التقديمي من تحقيق نتائج قيّمة باستمرار في بيئات سوقية سريعة التطور.
- التحليل التاريخي (سنتان)، سنة الأساس، التوقعات (7 سنوات) مع معدل النمو السنوي المركب
- تحليل PEST و SWOT
- حجم السوق والقيمة / الحجم - عالمي، إقليمي، بلد
- الصناعة والمنافسة
- مجموعة بيانات إكسل
التقارير الحديثة
تقارير ذات صلة
شهادات العملاء
تقرير سوق أنظمة SCADA من Insight Partners شامل، ويقدم رؤى قيّمة حول الاتجاهات الحالية والتوقعات المستقبلية. تميّز الفريق باحترافية عالية وسرعة في الاستجابة ودعم مستمر طوال الوقت. نحن راضون جدًا ونوصي بشدة بخدماتهم.
ران كيديم شريك, شركة ريالي تكنولوجيز المحدودةطلبتُ تقريرًا عن سوق برمجيات محدد، وأعدّه الفريق في غضون أيام قليلة. كانت المعلومات ذات صلة وثيقة وعرضها جيد. ثم طلبتُ بعض التعديلات والإضافات على التقرير. وكان الفريق متجاوبًا للغاية، وحصلتُ على التقرير النهائي في أقل من أسبوع.
جان هيرفيه جين رئيس مجلس الإدارة, فيوتشر أناليتيكاعملنا مع شركة "إنسايت بارتنرز" لإجراء دراسة سوقية وتوقعات مهمة. زودونا برؤى واضحة حول الفرص والمخاطر، مما ساعدنا في صياغة خططنا. كانت أبحاثهم سهلة الاستخدام ومبنية على بيانات دقيقة، مما ساعدنا على اتخاذ قرارات ذكية وواثقة. نوصي بهم بشدة.
بيوش ناجبال نائب الرئيس الأول, شعاع عالي عالميقدّمت شركة Insight Partners أبحاثًا سوقية ثاقبة ومنظمة جيدًا بخبرة واسعة في هذا المجال. تميّز فريقهم بالاحترافية وسرعة الاستجابة طوال الوقت. وسهّل موقعهم الإلكتروني سهل الاستخدام الوصول إلى تقارير القطاع. نوصي بهم بشدة لخدمات بحثية موثوقة وعالية الجودة.
يوكيهيكو أداتشي المدير التنفيذي, ديب بلو، ذ.م.م.هذه أول مرة أشتري فيها تقرير سوق من The Insight Partners. رغم أنني كنت مترددًا في البداية، إلا أنني زرت موقعهم الإلكتروني وشعرت براحة أكبر للمخاطرة وشراء تقرير السوق. أنا راضٍ تمامًا عن جودة التقرير وخدمة العملاء. كانت لديّ عدة أسئلة وتعليقات حول التقرير الأولي، ولكن بعد بضع محادثات عبر البريد الإلكتروني مع محللهم، أعتقد أن لديّ تقريرًا يمكنني استخدامه كمدخل لعملية التخطيط الاستراتيجي لدينا. شكرًا جزيلاً لكم على تخصيص وقتكم الإضافي وجعل هذه التجربة إيجابية. سأوصي بخدماتكم للآخرين بالتأكيد، وستكونون أول من ألجأ إليه عندما نحتاج إلى المزيد من بيانات السوق.
جون سوزوكي الرئيس والرئيس التنفيذي وعضو مجلس الإدارة, بي كيه تكنولوجيزأود أن أقدّر دعمكم واحترافيتكم في الاستجابة لطلبي للحصول على معلومات بشأن سوق التشخيص المخبري للأمراض المعدية في نيجيريا. كما أُقدّر صبركم وتوجيهكم، واستعدادكم لتقديم خصم، مما مكّننا في النهاية من إتمام الصفقة. أتطلع إلى التعامل مع "ذا إنسايت بارتنرز" مستقبلًا، كل ذلك بفضل الانطباع الذي تركتموه لديّ نتيجةً لهذا اللقاء الأول.
الدكتور تشيجيوك أونيا المدير الإداري, شركة باينكريست للرعاية الصحية المحدودةسبب الشراء
- اتخاذ قرارات مدروسة
- فهم ديناميكيات السوق
- تحليل المنافسة
- رؤى العملاء
- توقعات السوق
- تخفيف المخاطر
- التخطيط الاستراتيجي
- مبررات الاستثمار
- تحديد الأسواق الناشئة
- تحسين استراتيجيات التسويق
- تعزيز الكفاءة التشغيلية
- مواكبة التوجهات التنظيمية


 احصل على عينة مجانية ل - سوق جدران حماية أمن الشبكات