نظرة عامة على سوق ملصقات الرف الإلكتروني والنمو والاتجاهات والتحليل والتقرير البحثي (2022-2030)
البيانات التاريخية : 2020-2021 | سنة الأساس : 2022 | فترة التنبؤ : 2023-2030حجم سوق ملصقات الرفوف الإلكترونية وتوقعاته (2020-2030)، والحصة العالمية والإقليمية، والاتجاهات، وفرص النمو. يغطي التقرير: حسب المكونات (الأجهزة، والبرمجيات، والخدمات)، والأجهزة (الشاشات، والبطاريات، وأجهزة الإرسال والاستقبال، والمعالجات الدقيقة، وغيرها)، ونوع المنتج (شاشات LCD ESL و E-Paper ESL)، ونوع المتجر (المتاجر الكبرى، والسوبر ماركت، ومتاجر التجزئة غير الغذائية، والمتاجر المتخصصة، وغيرها)، وتكنولوجيا الاتصالات (الترددات الراديوية، والأشعة تحت الحمراء، والاتصالات قريبة المدى، وغيرها)، والموقع الجغرافي.
- تاريخ التقرير : Oct 2023
- رمز التقرير : TIPRE00007465
- الفئة : الإلكترونيات وأشباه الموصلات
- الحالة : نُشرت
- تنسيقات التقارير المتاحة :


- عدد الصفحات : 222
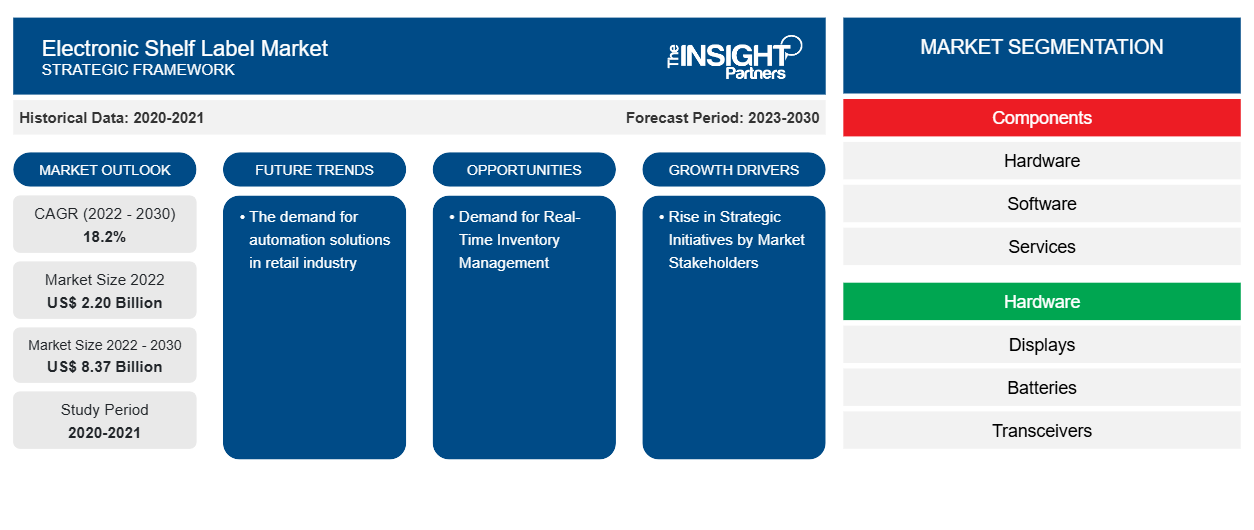
من المتوقع أن يصل حجم سوق ملصقات الرفوف الإلكترونية إلى 8.37 مليار دولار أمريكي بحلول عام 2030 من 2.20 مليار دولار أمريكي في عام 2022. ومن المتوقع أن يسجل السوق معدل نمو سنوي مركب بنسبة 18.2٪ خلال الفترة 2022-2030. ومن المرجح أن يظل الطلب على حلول الأتمتة في صناعة التجزئة اتجاهًا رئيسيًا في السوق.
تحليل سوق ملصقات الرفوف الإلكترونية
تؤثر عوامل مثل العدد المتزايد من محلات السوبر ماركت ومراكز التسوق والمتاجر، وانخفاض توفر العمالة، ومتطلبات أتمتة البيع بالتجزئة الرائجة على نمو سوق ملصقات الرفوف الإلكترونية . ومع ذلك، فإن رسوم التثبيت المرتفعة والبنية الأساسية الداعمة اللازمة للنظام هي تحديات رئيسية تحد من نمو سوق ملصقات الرفوف الإلكترونية. علاوة على ذلك، يتقدم العالم نحو الرقمنة. نظرًا لأن نظام ESL يتميز بتكلفة صيانة منخفضة، فإن صناعة التجزئة تتبنى النظام على نطاق واسع، نظرًا لفوائده لتجار التجزئة. وهذا يخلق فرصة كبيرة للاعبين في السوق العاملين في سوق نظام ملصقات الرفوف الإلكترونية. كما من المتوقع أن يؤثر تكامل الصناعة 4.0 وظهور التقنيات المتقدمة لـ ESL، مثل ePaper مع حلول متعددة الألوان وخالية من البطاريات، على سوق ملصقات الرفوف الإلكترونية بشكل إيجابي.
نظرة عامة على سوق ملصقات الرفوف الإلكترونية
يستخدم تجار التجزئة نظام الملصقات الإلكترونية لعرض أسعار المنتجات على الأرفف. ويكتسب هذا النظام شعبية هائلة لأنه يتمتع بفوائد مثل تحديث أسعار المنتجات تلقائيًا كلما تم تغيير السعر من خادم التحكم المركزي. ويؤدي العدد المتزايد من محلات السوبر ماركت والمتاجر المتخصصة والمتاجر الكبرى إلى زيادة الطلب على سوق الملصقات الإلكترونية. وتعد الولايات المتحدة والصين وفرنسا وألمانيا واليابان الدول الخمس الرائدة التي تساهم في أعلى حصة من الإيرادات في سوق الملصقات الإلكترونية.
قم بتخصيص هذا التقرير ليناسب متطلباتك
ستحصل على تخصيص لأي تقرير - مجانًا - بما في ذلك أجزاء من هذا التقرير، أو تحليل على مستوى الدولة، وحزمة بيانات Excel، بالإضافة إلى الاستفادة من العروض والخصومات الرائعة للشركات الناشئة والجامعات
سوق ملصقات الرفوف الإلكترونية: رؤى استراتيجية
- احصل على أهم اتجاهات السوق الرئيسية لهذا التقرير.ستتضمن هذه العينة المجانية تحليلاً للبيانات، بدءًا من اتجاهات السوق وحتى التقديرات والتوقعات.
محركات وفرص سوق ملصقات الرفوف الإلكترونية
ارتفاع المبادرات الاستراتيجية من قبل أصحاب المصلحة في السوق لصالح السوق
استفاد تجار التجزئة من الأتمتة في صناعة التجزئة على نطاق واسع من خلال تقليل الأخطاء البشرية. بالإضافة إلى ذلك، ينمو قطاع التجزئة في جميع أنحاء العالم باستمرار. على سبيل المثال، وفقًا للحكومة الأمريكية، زادت مبيعات التجزئة في الولايات المتحدة بنسبة 3.1٪ من 5402.3 مليار دولار أمريكي في عام 2019 إلى 5570.4 مليار دولار أمريكي في عام 2020. وفقًا لمؤسسة India Brand Equity Foundation، من المتوقع أن تصل قيمة قطاع التجزئة الهندي إلى 2 تريليون دولار أمريكي بحلول عام 2032. تؤكد صناعة التجزئة بشكل متزايد على تقليل إجمالي تكاليف التشغيل عن طريق إزالة العمليات اليدوية في المتاجر المرتبطة بالمخزون وتغيير الأسعار والمزيد. لذلك، يتزايد الطلب على حلول الأتمتة في جميع أنحاء صناعة التجزئة. علاوة على ذلك، يتضمن مفهوم الأتمتة أيضًا استخدام ESLS في متاجر التجزئة للقضاء على الحد الأقصى من المهام اليدوية، مما سيساعد في خفض النفقات العامة.
يقوم اللاعبون في سوق ملصقات الرفوف الإلكترونية (ESL) بإطلاق ملصقات الرفوف الإلكترونية لتلبية الطلب المتزايد على منتجات التجزئة. وفيما يلي بعض استراتيجيات النمو المذكورة.
- في يناير 2023، أطلقت شركة Ynvisible Interactive Inc. عرضًا إلكترونيًا كبيرًا لملصقات الرفوف لمتاجر البقالة.
- في مايو 2023، كشفت شركة Pricer & StrongPoint عن ملصقات أرفف إلكترونية يمكنها عرض رسومات باللون الأصفر والأحمر والأسود والأبيض. إن استخدام الرسومات عالية الدقة والألوان النابضة بالحياة يجذب المزيد من العملاء ويزيد من مبيعات المتاجر.
ومن ثم، فإن مثل هذه المبادرات الاستراتيجية التي يتخذها اللاعبون في السوق تدفع نمو سوق ملصقات الرفوف الإلكترونية.
الطلب على إدارة المخزون في الوقت الفعلي
إن الحاجة إلى حلول إدارة المخزون في الوقت الفعلي تزيد من الطلب على ملصقات الرفوف الإلكترونية بين الشركات. لا توفر الملصقات الورقية التقليدية للشركات معلومات دقيقة وفي الوقت المناسب حول مستويات المخزون. وقد يؤدي هذا إلى صعوبات مثل عرض المنتجات التي نفدت من المخزون بشكل غير صحيح على أنها متوفرة، مما يتسبب في مزيد من عدم رضا العملاء ويقلل من مبيعات الشركة. يمكن دمج ملصقات الرفوف الإلكترونية في نظام إدارة المخزون لدى بائع التجزئة لتوفير تحديثات مستوى المخزون في الوقت الفعلي. يتيح هذا لموظفي المتجر اكتشاف الحاجة إلى إعادة تعبئة المنتجات بسرعة وسهولة، مما يضمن عدم خيبة أمل العملاء بسبب عدم توفرها.
تقرير تحليل تجزئة سوق ملصقات الرفوف الإلكترونية
إن القطاعات الرئيسية التي ساهمت في اشتقاق تحليل سوق ملصقات الرف الإلكترونية هي المكونات، والأجهزة، ونوع المنتج، ونوع المتجر، وتكنولوجيا الاتصالات.
- بناءً على المكونات، ينقسم سوق ملصقات الرفوف الإلكترونية إلى أجهزة وبرامج وخدمات. احتل قطاع الأجهزة حصة سوقية أكبر في عام 2022.
- من حيث الأجهزة، يتم تقسيم السوق إلى شاشات وبطاريات وأجهزة إرسال واستقبال ومعالجات دقيقة وغيرها. ومن المتوقع أن ينمو قطاع الشاشات خلال الفترة المتوقعة.
- من حيث نوع المنتج، يتم تقسيم سوق ملصقات الرفوف الإلكترونية إلى ملصقات LCD ESL وملصقات E-Paper-based ESL. ومن المتوقع أن ينمو قطاع ملصقات الرفوف الإلكترونية ESL خلال الفترة المتوقعة.
- بناءً على نوع المتجر، يتم تقسيم السوق إلى متاجر هايبر ماركت، ومتاجر سوبر ماركت، ومتاجر بيع بالتجزئة غير غذائية، ومتاجر متخصصة، وغيرها. ومن المتوقع أن ينمو قطاع متاجر هايبر ماركت خلال فترة التوقعات.
- بناءً على تكنولوجيا الاتصالات، ينقسم السوق إلى ترددات الراديو، والأشعة تحت الحمراء، والاتصالات القريبة المدى، وغيرها. احتل قطاع ترددات الراديو حصة سوقية أكبر في عام 2022.
تحليل حصة سوق ملصقات الرفوف الإلكترونية حسب المنطقة الجغرافية
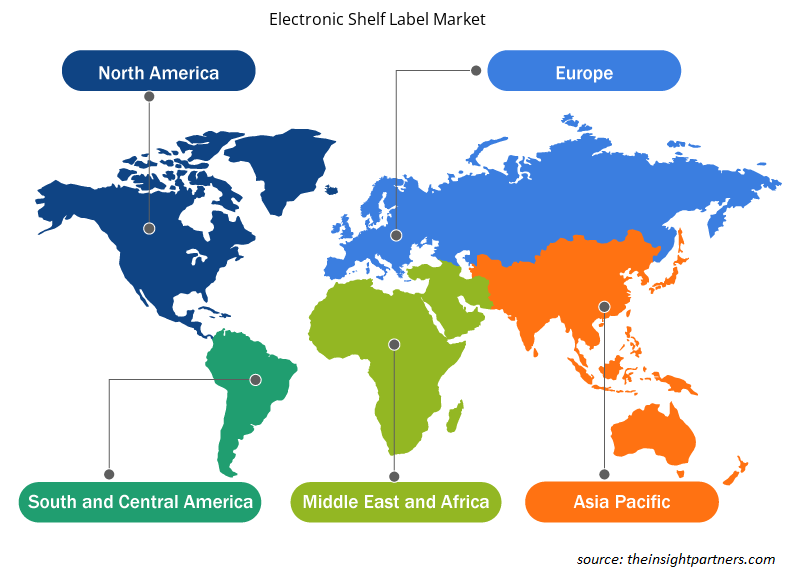
يتم تقسيم النطاق الجغرافي لتقرير سوق ملصقات الرف الإلكترونية بشكل أساسي إلى خمس مناطق: أمريكا الشمالية، ومنطقة آسيا والمحيط الهادئ، وأوروبا، والشرق الأوسط وأفريقيا، وأمريكا الجنوبية والوسطى.
تنقسم سوق معدات التبريد الصناعية في أمريكا الشمالية إلى الولايات المتحدة وكندا والمكسيك. ويدعم سوق ملصقات الرفوف الإلكترونية في أمريكا الشمالية الوجود الضخم لمتاجر التجزئة والتطور الكبير في قطاع التجزئة. وتعد هذه المنطقة موطنًا لمعظم أكبر تجار التجزئة في العالم. تمتلك كندا والمكسيك أكبر سلاسل التجزئة الخاصة بهما، ولدى كلا البلدين شركات تجزئة تدير عمليات تجارية في جميع أنحاء العالم. وتتحمل صناعة التجزئة مسؤولية ما يقرب من ثلثي الناتج المحلي الإجمالي للولايات المتحدة. وتشمل سلاسل التجزئة الأمريكية الكبرى Walmart وAlbertsons Companies وCVS Health وAmazon وWalgreens Boots Alliance وCostco وKroger Co. وTarget.
نظرة إقليمية على سوق الملصقات الإلكترونية
لقد قام المحللون في Insight Partners بشرح الاتجاهات والعوامل الإقليمية المؤثرة على سوق ملصقات الرفوف الإلكترونية طوال فترة التوقعات بشكل شامل. يناقش هذا القسم أيضًا قطاعات سوق ملصقات الرفوف الإلكترونية والجغرافيا في جميع أنحاء أمريكا الشمالية وأوروبا ومنطقة آسيا والمحيط الهادئ والشرق الأوسط وأفريقيا وأمريكا الجنوبية والوسطى.
- احصل على البيانات الإقليمية المحددة لسوق ملصقات الرفوف الإلكترونية
نطاق تقرير سوق ملصقات الرفوف الإلكترونية
| سمة التقرير | تفاصيل |
|---|---|
| حجم السوق في عام 2022 | 2.20 مليار دولار أمريكي |
| حجم السوق بحلول عام 2030 | 8.37 مليار دولار أمريكي |
| معدل النمو السنوي المركب العالمي (2022 - 2030) | 18.2% |
| البيانات التاريخية | 2020-2021 |
| فترة التنبؤ | 2023-2030 |
| القطاعات المغطاة | حسب المكونات
|
| المناطق والدول المغطاة | أمريكا الشمالية
|
| قادة السوق وملفات تعريف الشركات الرئيسية |
|
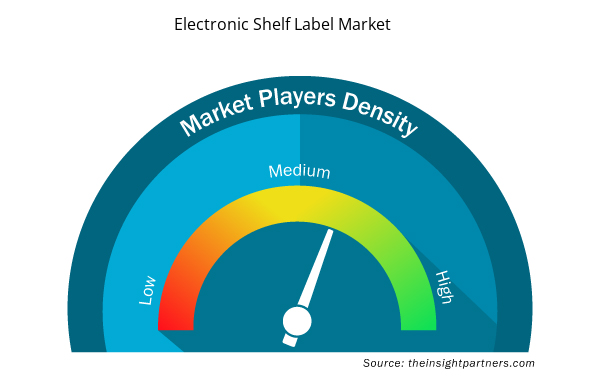
كثافة اللاعبين في سوق ملصقات الرفوف الإلكترونية: فهم تأثيرها على ديناميكيات الأعمال
يشهد سوق ملصقات الرفوف الإلكترونية نموًا سريعًا، مدفوعًا بالطلب المتزايد من المستخدم النهائي بسبب عوامل مثل تفضيلات المستهلك المتطورة والتقدم التكنولوجي والوعي المتزايد بفوائد المنتج. ومع ارتفاع الطلب، تعمل الشركات على توسيع عروضها والابتكار لتلبية احتياجات المستهلكين والاستفادة من الاتجاهات الناشئة، مما يؤدي إلى زيادة نمو السوق.
تشير كثافة اللاعبين في السوق إلى توزيع الشركات أو المؤسسات العاملة في سوق أو صناعة معينة. وهي تشير إلى عدد المنافسين (اللاعبين في السوق) الموجودين في مساحة سوق معينة نسبة إلى حجمها أو قيمتها السوقية الإجمالية.
الشركات الرئيسية العاملة في سوق ملصقات الرفوف الإلكترونية هي:
- لابل نيست
- شركة ديسبلايداتا المحدودة
- شركة باناسونيك القابضة
- M2C Communication DOO
- هانشو للتكنولوجيا
- شركة Opticon Sensors Europe BV
إخلاء المسؤولية : الشركات المذكورة أعلاه ليست مرتبة بأي ترتيب معين.
- احصل على نظرة عامة على أهم اللاعبين الرئيسيين في سوق ملصقات الرفوف الإلكترونية
أخبار سوق الملصقات الإلكترونية والتطورات الأخيرة
يتم تقييم سوق ملصقات الرفوف الإلكترونية من خلال جمع البيانات النوعية والكمية بعد البحث الأولي والثانوي، والتي تتضمن منشورات الشركات المهمة وبيانات الجمعيات وقواعد البيانات. فيما يلي بعض التطورات في سوق ملصقات الرفوف الإلكترونية:
- أقامت شركة Hanshow حفل إطلاق منتجها الجديد "الإحياء والتميز" في مركز معارض تشونغتشينغ الدولي في الصين، حيث كشفت رسميًا عن سلسلة Nebular Pro ذات الأربعة ألوان من ملصقات الرفوف الإلكترونية (ESLs). (المصدر: Hanshow، موقع الشركة على الويب، أبريل 2023)
تقرير سوق الملصقات الإلكترونية على الرفوف والتغطية والنتائج
يوفر تقرير "حجم سوق ملصقات الرفوف الإلكترونية والتوقعات (2020-2030)" تحليلاً مفصلاً للسوق يغطي المجالات التالية:
- حجم سوق ملصقات الرفوف الإلكترونية وتوقعاتها على المستويات العالمية والإقليمية والوطنية لجميع قطاعات السوق الرئيسية التي يغطيها النطاق
- اتجاهات سوق ملصقات الرفوف الإلكترونية بالإضافة إلى ديناميكيات السوق مثل المحركات والقيود والفرص الرئيسية
- تحليل مفصل لقوى PEST/Porter الخمس وSWOT
- تحليل سوق ملصقات الرفوف الإلكترونية يغطي اتجاهات السوق الرئيسية والإطار العالمي والإقليمي والجهات الفاعلة الرئيسية واللوائح والتطورات الأخيرة في السوق
- تحليل المشهد الصناعي والمنافسة الذي يغطي تركيز السوق، وتحليل خريطة الحرارة، واللاعبين البارزين، والتطورات الأخيرة لسوق ملصقات الرفوف الإلكترونية
- ملفات تعريف الشركة التفصيلية

نافين خبيرٌ متمرسٌ في أبحاث السوق والاستشارات، يتمتع بخبرةٍ تزيد عن 9 سنوات في مشاريع مُخصصة ومُشتركة واستشارية. يشغل حاليًا منصب نائب الرئيس المساعد، وقد نجح في إدارة أصحاب المصلحة عبر سلسلة قيمة المشاريع، وألّف أكثر من 100 تقرير بحثي وأكثر من 30 مهمة استشارية. يمتد نطاق عمله ليشمل مشاريع صناعية وحكومية، مساهمًا بشكل كبير في نجاح العملاء واتخاذ القرارات القائمة على البيانات.
نافين حاصلٌ على شهادة في هندسة الإلكترونيات والاتصالات من جامعة فرجينيا التقنية، كارناتاكا، وشهادة ماجستير في إدارة الأعمال في التسويق والعمليات من جامعة مانيبال. وهو عضوٌ نشطٌ في معهد مهندسي الكهرباء والإلكترونيات (IEEE) لمدة 9 سنوات، حيث شارك في مؤتمراتٍ وندواتٍ تقنية، وتطوّع على مستوى الأقسام والمناطق. قبل منصبه الحالي، عمل مستشارًا استراتيجيًا مساعدًا في IndustryARC، ومستشارًا للخوادم الصناعية في شركة هيوليت باكارد (HP Global).
- التحليل التاريخي (سنتان)، سنة الأساس، التوقعات (7 سنوات) مع معدل النمو السنوي المركب
- تحليل PEST و SWOT
- حجم السوق والقيمة / الحجم - عالمي، إقليمي، بلد
- الصناعة والمنافسة
- مجموعة بيانات إكسل
التقارير الحديثة
تقارير ذات صلة
شهادات العملاء
تقرير سوق أنظمة SCADA من Insight Partners شامل، ويقدم رؤى قيّمة حول الاتجاهات الحالية والتوقعات المستقبلية. تميّز الفريق باحترافية عالية وسرعة في الاستجابة ودعم مستمر طوال الوقت. نحن راضون جدًا ونوصي بشدة بخدماتهم.
ران كيديم شريك, شركة ريالي تكنولوجيز المحدودةطلبتُ تقريرًا عن سوق برمجيات محدد، وأعدّه الفريق في غضون أيام قليلة. كانت المعلومات ذات صلة وثيقة وعرضها جيد. ثم طلبتُ بعض التعديلات والإضافات على التقرير. وكان الفريق متجاوبًا للغاية، وحصلتُ على التقرير النهائي في أقل من أسبوع.
جان هيرفيه جين رئيس مجلس الإدارة, فيوتشر أناليتيكاعملنا مع شركة "إنسايت بارتنرز" لإجراء دراسة سوقية وتوقعات مهمة. زودونا برؤى واضحة حول الفرص والمخاطر، مما ساعدنا في صياغة خططنا. كانت أبحاثهم سهلة الاستخدام ومبنية على بيانات دقيقة، مما ساعدنا على اتخاذ قرارات ذكية وواثقة. نوصي بهم بشدة.
بيوش ناجبال نائب الرئيس الأول, شعاع عالي عالميقدّمت شركة Insight Partners أبحاثًا سوقية ثاقبة ومنظمة جيدًا بخبرة واسعة في هذا المجال. تميّز فريقهم بالاحترافية وسرعة الاستجابة طوال الوقت. وسهّل موقعهم الإلكتروني سهل الاستخدام الوصول إلى تقارير القطاع. نوصي بهم بشدة لخدمات بحثية موثوقة وعالية الجودة.
يوكيهيكو أداتشي المدير التنفيذي, ديب بلو، ذ.م.م.هذه أول مرة أشتري فيها تقرير سوق من The Insight Partners. رغم أنني كنت مترددًا في البداية، إلا أنني زرت موقعهم الإلكتروني وشعرت براحة أكبر للمخاطرة وشراء تقرير السوق. أنا راضٍ تمامًا عن جودة التقرير وخدمة العملاء. كانت لديّ عدة أسئلة وتعليقات حول التقرير الأولي، ولكن بعد بضع محادثات عبر البريد الإلكتروني مع محللهم، أعتقد أن لديّ تقريرًا يمكنني استخدامه كمدخل لعملية التخطيط الاستراتيجي لدينا. شكرًا جزيلاً لكم على تخصيص وقتكم الإضافي وجعل هذه التجربة إيجابية. سأوصي بخدماتكم للآخرين بالتأكيد، وستكونون أول من ألجأ إليه عندما نحتاج إلى المزيد من بيانات السوق.
جون سوزوكي الرئيس والرئيس التنفيذي وعضو مجلس الإدارة, بي كيه تكنولوجيزأود أن أقدّر دعمكم واحترافيتكم في الاستجابة لطلبي للحصول على معلومات بشأن سوق التشخيص المخبري للأمراض المعدية في نيجيريا. كما أُقدّر صبركم وتوجيهكم، واستعدادكم لتقديم خصم، مما مكّننا في النهاية من إتمام الصفقة. أتطلع إلى التعامل مع "ذا إنسايت بارتنرز" مستقبلًا، كل ذلك بفضل الانطباع الذي تركتموه لديّ نتيجةً لهذا اللقاء الأول.
الدكتور تشيجيوك أونيا المدير الإداري, شركة باينكريست للرعاية الصحية المحدودةسبب الشراء
- اتخاذ قرارات مدروسة
- فهم ديناميكيات السوق
- تحليل المنافسة
- رؤى العملاء
- توقعات السوق
- تخفيف المخاطر
- التخطيط الاستراتيجي
- مبررات الاستثمار
- تحديد الأسواق الناشئة
- تحسين استراتيجيات التسويق
- تعزيز الكفاءة التشغيلية
- مواكبة التوجهات التنظيمية


 احصل على عينة مجانية ل - سوق ملصقات الرفوف الإلكترونية