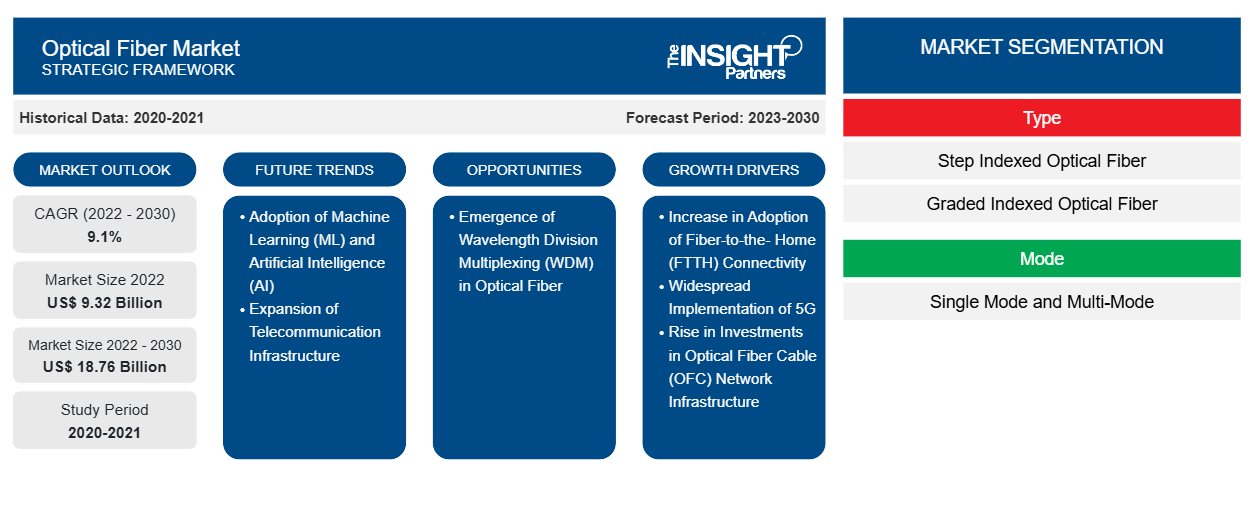
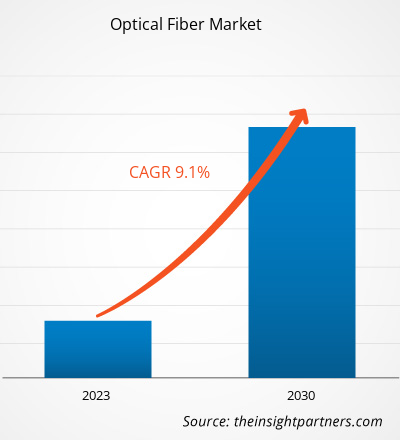
من المتوقع أن ينمو سوق الألياف الضوئية من 9.32 مليار دولار أمريكي في عام 2022 إلى 18.76 مليار دولار أمريكي بحلول عام 2030؛ ومن المتوقع أن يتوسع بمعدل نمو سنوي مركب قدره 9.1٪ من عام 2022 إلى عام 2030. ومن المتوقع أن يكون الطلب المتزايد على الإنترنت عالي السرعة والتطورات في البنية التحتية للاتصالات من الاتجاهات الرئيسية في السوق.
تحليل سوق الألياف الضوئية
ومن المتوقع أن يكون تطوير شبكة الألياف الضوئية مدفوعًا بالزيادة الكبيرة في الطلب على بيانات المستهلكين والانتشار السريع لأجهزة إنترنت الأشياء (IoT). كما قامت حكومات العديد من البلدان في جميع أنحاء العالم باستثمارات كبيرة في نشر الألياف الضوئية، مما خلق فرصًا مربحة لنمو السوق. على سبيل المثال، تتطلب الولايات المتحدة توسعًا كبيرًا في البنية التحتية للألياف الضوئية في غضون السنوات الخمس إلى السبع المقبلة لدعم شبكة 5G اللاسلكية القادمة، وتعزيز المنافسة على النطاق العريض، وتوفير تغطية النطاق العريض الريفي. وهذا يتطلب استثمارًا يقدر بنحو 130-150 مليار دولار أمريكي في نشر كابلات الألياف. تسلط هذه التطورات الضوء على الإمكانات الهائلة للشركات العاملة في صناعة الاتصالات للاستفادة من الطلب المتزايد على البنية التحتية للألياف الضوئية والاستفادة من الفرص التي توفرها ثورة 5G، مما يؤدي إلى زيادة نمو سوق الألياف الضوئية .
نظرة عامة على صناعة سوق الألياف الضوئية
الألياف الضوئية، والمعروفة أيضًا باسم الألياف البصرية، هي ألياف زجاجية أو بلاستيكية شديدة المرونة تمكن من نقل إشارات الضوء من طرف إلى آخر. تلعب هذه الألياف دورًا حاسمًا في اتصالات الألياف الضوئية، حيث توفر ميزة مسافات الإرسال الأطول وعرض النطاق الترددي الأعلى مقارنة بالكابلات الكهربائية التقليدية . يُفضل استخدام الألياف الضوئية على الأسلاك المعدنية نظرًا لانخفاض فقدان الإشارة وحصانتها ضد التداخل الكهرومغناطيسي، وهي مشكلة شائعة تواجهها الأسلاك المعدنية. بالإضافة إلى الاتصالات السلكية واللاسلكية، تُستخدم الألياف الضوئية على نطاق واسع في تطبيقات مثل الإضاءة والتصوير ونقل الضوء أو الصور إلى أماكن ضيقة، على غرار تطبيق مناظير الألياف. علاوة على ذلك، تُستخدم الألياف المتخصصة لأغراض مختلفة، بما في ذلك أجهزة استشعار الألياف الضوئية وأجهزة الليزر الليفية.
قم بتخصيص هذا التقرير ليناسب متطلباتك
ستحصل على تخصيص لأي تقرير - مجانًا - بما في ذلك أجزاء من هذا التقرير، أو تحليل على مستوى الدولة، وحزمة بيانات Excel، بالإضافة إلى الاستفادة من العروض والخصومات الرائعة للشركات الناشئة والجامعات
سوق الألياف الضوئية:
- احصل على أهم اتجاهات السوق الرئيسية لهذا التقرير.ستتضمن هذه العينة المجانية تحليلاً للبيانات، بدءًا من اتجاهات السوق وحتى التقديرات والتوقعات.
محركات وفرص سوق الألياف الضوئية
زيادة في اعتماد اتصال الألياف الضوئية إلى المنازل (FTTH) لتعزيز نمو السوق
لا تستطيع تقنيات الإنترنت التقليدية التنافس مع السرعات الأسرع والاتصالات الأكثر موثوقية لـ FTTH. وفقًا للدراسة التي أجرتها جمعية النطاق العريض للألياف (FBA)، تجاوز عدد المساكن في الولايات المتحدة التي تخدمها شبكة الإنترنت عبر الألياف 60 مليونًا في عام 2021، بزيادة قدرها 12٪ من حوالي 54 مليونًا في عام 2020. علاوة على ذلك، كشفت الدراسة أيضًا أن الإنترنت عبر الألياف متاح بالفعل لـ 43٪ من الأسر الأمريكية و 60٪ من الأسر الكندية. وفقًا للمسح، فإن اللاعبين الكبار في السوق مثل Verizon و AT&T و Lumen هم من بين أكبر خمس منظمات لخدمات إدارة الكابلات (MSOs)، حيث يشكلون حوالي 72٪ من جميع اتصالات الإنترنت عبر الألياف. في المقابل، شكلت شركات التشغيل الإقليمية من المستوى 2 مثل Frontier و Windstream و TDS و Consolidated 10٪ من التوسع.
البنية التحتية المتنامية لشبكة الجيل الخامس
ومن المتوقع أن يؤدي التحول إلى تقنية الجيل الخامس وترقيات البنية التحتية المرتبطة بها إلى تعزيز الطلب على الألياف الضوئية خلال فترة التنبؤ. وقد تسبب الوباء في تغيير نموذجي في الاتصالات، مع عمل المزيد من الأفراد عن بُعد، وأخذ دروس عبر الإنترنت، وبث المعلومات عبر المنصات الرقمية. ونتيجة لذلك، من المتوقع أن تتطور خدمات طرح الألياف بشكل هائل في جميع أنحاء العالم. وهذا من شأنه أن يسمح بتنفيذ أسرع لتقنية الجيل الخامس ، مما سيفيد السكان بشكل كبير من خلال منحهم إمكانية الوصول إلى اتصالات أسرع للتنمية والتقدم. وبالتالي، من المتوقع أن يعزز نمو البنية التحتية لتقنية الجيل الخامس الطلب على الألياف الضوئية خلال فترة التنبؤ.
تقرير تحليل تجزئة سوق الألياف الضوئية
تتمثل القطاعات الرئيسية التي ساهمت في اشتقاق تحليل سوق الألياف الضوئية في التغطية حسب النوع والوضع والتكوين والمستخدم النهائي.
- بناءً على النوع، يتم تقسيم سوق الألياف الضوئية إلى ألياف ضوئية متدرجة الفهرس وألياف ضوئية متدرجة الفهرس. احتفظ قطاع الألياف الضوئية المتدرجة الفهرس بحصة سوقية أكبر للألياف الضوئية في عام 2022 ومن المتوقع أن يسجل معدل نمو سنوي مركب أعلى في السوق خلال فترة التنبؤ. تتمتع الألياف الضوئية المتدرجة الفهرس بمؤشر انكسار تفاضلي في القلب يتناقص أثناء التحرك للخارج من مركز القلب. ينتقل الضوء، عند مروره عبر الوسط، بشكل أسرع عند الحافة منه عند المركز في مسارات منحنية. يمكن أن تكون الألياف الضوئية المتدرجة الفهرس متعددة الأوضاع وكذلك أحادية الوضع. تتمتع الألياف الضوئية المتدرجة الفهرسة متعددة الأوضاع بأقطار أساسية أكبر من الألياف المتدرجة الفهرسة، وبالتالي نطاقات تردد أكبر. نتيجة لنطاقات التردد الأكبر، تُستخدم الألياف المتدرجة الفهرسة متعددة الأوضاع لنقل البيانات بسرعة عالية.
تحليل حصة سوق الألياف الضوئية حسب المنطقة الجغرافية
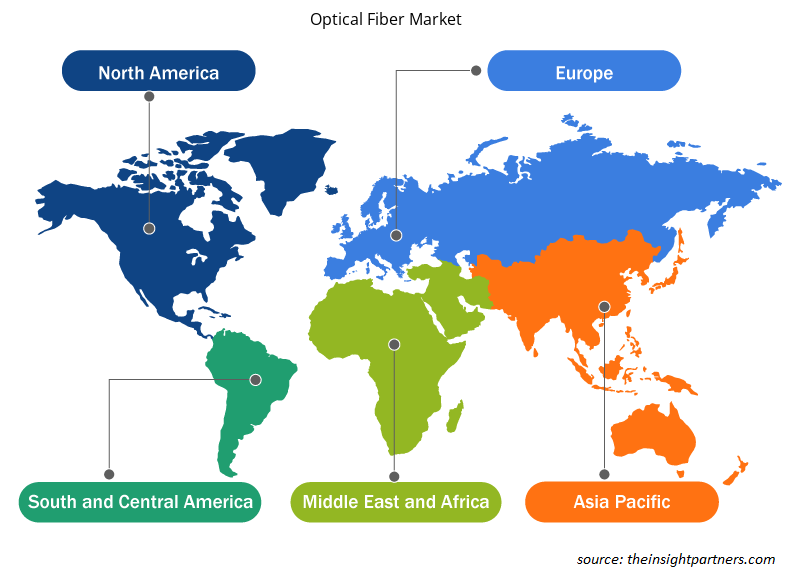
على أساس المنطقة، يتم تقسيم السوق إلى أمريكا الشمالية وأوروبا ومنطقة آسيا والمحيط الهادئ والشرق الأوسط وأفريقيا وأمريكا الجنوبية والوسطى.
استحوذت منطقة آسيا والمحيط الهادئ على أكبر حصة في سوق الألياف الضوئية في عام 2022. وتشهد بلدان مختلفة في منطقة آسيا والمحيط الهادئ تحولًا ديناميكيًا نحو المشهد المتقدم تكنولوجيًا مع التركيز بشكل أساسي على المشاريع في المدن الذكية، مثل دمج إنترنت الأشياء (IoT) والتقدم في أنظمة الرعاية الصحية. تدعم الألياف الضوئية هذه المشاريع من خلال توفير سرعة عالية وزمن انتقال ضئيل لنقل البيانات والاتصالات في الوقت الفعلي. علاوة على ذلك، فإن الاستخدام المتزايد لموصلات الألياف الضوئية في المنطقة أمر حيوي لتسهيل واجهات الاتصالات الموثوقة وعالية السرعة، والتي بدورها تدفع السوق.
إن أحد العوامل الرئيسية التي تدفع السوق إلى التوسع في آسيا هو الاستخدام المتزايد لكابلات الألياف الضوئية تحت الماء. بالإضافة إلى زيادة سعة الشبكة وكفاءة الطيف، فقد عززت الاتصال بين الدول. ومع نمو الحاجة إلى الاتصال الموثوق به ونقل البيانات السريع، فمن المحتمل أن يتم استخدام كابلات الألياف الضوئية تحت الماء بشكل متكرر، مما سيساعد السوق الإقليمية على التوسع. على سبيل المثال، يربط نظام الكابلات البحرية آسيا-أفريقيا-أوروبا 1 (AAE-1) العديد من الدول في آسيا والشرق الأوسط وأفريقيا وأوروبا على مسافة تزيد عن 25000 كيلومتر. لقد أدى نشر نظام الكابلات البحرية AAE-1 إلى تحسين استخدام المنطقة للألياف المنشورة بشكل كبير. علاوة على ذلك، شكل إجمالي النطاق العريض للألياف في منطقة آسيا والمحيط الهادئ أكثر من 85.1٪ من حصة قاعدة مشتركي النطاق العريض الثابت السكني.
نطاق تقرير سوق الألياف الضوئية
رؤى إقليمية حول سوق الألياف الضوئية
لقد قام المحللون في Insight Partners بشرح الاتجاهات والعوامل الإقليمية المؤثرة على سوق الألياف الضوئية طوال فترة التوقعات بشكل شامل. يناقش هذا القسم أيضًا قطاعات سوق الألياف الضوئية والجغرافيا في جميع أنحاء أمريكا الشمالية وأوروبا ومنطقة آسيا والمحيط الهادئ والشرق الأوسط وأفريقيا وأمريكا الجنوبية والوسطى.
- احصل على البيانات الإقليمية المحددة لسوق الألياف الضوئية
نطاق تقرير سوق الألياف الضوئية
| سمة التقرير | تفاصيل |
|---|---|
| حجم السوق في عام 2022 | 9.32 مليار دولار أمريكي |
| حجم السوق بحلول عام 2030 | 18.76 مليار دولار أمريكي |
| معدل النمو السنوي المركب العالمي (2022 - 2030) | 9.1% |
| البيانات التاريخية | 2020-2021 |
| فترة التنبؤ | 2023-2030 |
| القطاعات المغطاة | حسب النوع
|
| المناطق والدول المغطاة | أمريكا الشمالية
|
| قادة السوق وملفات تعريف الشركات الرئيسية |
|
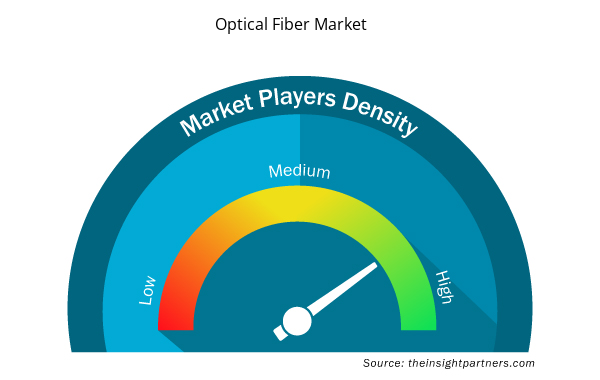
كثافة اللاعبين في السوق: فهم تأثيرها على ديناميكيات الأعمال
يشهد سوق الألياف الضوئية نموًا سريعًا، مدفوعًا بالطلب المتزايد من المستخدم النهائي بسبب عوامل مثل تفضيلات المستهلك المتطورة والتقدم التكنولوجي والوعي المتزايد بفوائد المنتج. ومع ارتفاع الطلب، تعمل الشركات على توسيع عروضها والابتكار لتلبية احتياجات المستهلكين والاستفادة من الاتجاهات الناشئة، مما يؤدي إلى زيادة نمو السوق.
تشير كثافة اللاعبين في السوق إلى توزيع الشركات أو المؤسسات العاملة في سوق أو صناعة معينة. وهي تشير إلى عدد المنافسين (اللاعبين في السوق) الموجودين في مساحة سوق معينة نسبة إلى حجمها أو قيمتها السوقية الإجمالية.
الشركات الرئيسية العاملة في سوق الألياف الضوئية هي:
- شركة كورنينج
- بريسميان سبا
- شركة جيانغسو تشونغتيان للتكنولوجيا المحدودة
- شركة يانغتسي للألياف البصرية والكابلات المساهمة المحدودة
- شركة فايبر هوم لتقنيات الاتصالات المحدودة
- شركة فوروكاوا الكهربائية المحدودة
إخلاء المسؤولية : الشركات المذكورة أعلاه ليست مرتبة بأي ترتيب معين.
- احصل على نظرة عامة على أهم اللاعبين الرئيسيين في سوق الألياف الضوئية
أخبار سوق الألياف الضوئية والتطورات الأخيرة
يتم تقييم سوق الألياف الضوئية من خلال جمع البيانات النوعية والكمية بعد البحث الأولي والثانوي، والتي تتضمن منشورات الشركات المهمة وبيانات الجمعيات وقواعد البيانات. فيما يلي بعض التطورات في سوق الألياف الضوئية:
- افتتحت شركة Corning Incorporated منشأة جديدة لتصنيع الألياف الضوئية في Mszczonów، بولندا، لتلبية الطلب المتزايد على الاتصال عالي السرعة في الاتحاد الأوروبي والمناطق المحيطة. تعد المنشأة، التي تعد واحدة من أكبر مصانع الألياف الضوئية في الاتحاد الأوروبي، أحدث استثمارات شركة Corning في سلسلة من الاستثمارات العالمية في تصنيع الألياف والكابلات بقيمة إجمالية تزيد عن 500 مليون دولار أمريكي منذ عام 2020، بدعم من الطلب المتزايد والالتزامات القوية تجاه العملاء. (المصدر: Corning Incorporated، بيان صحفي، سبتمبر 2023)
تقرير سوق الألياف الضوئية والتغطية والمخرجات
يتم تقدير توقعات سوق الألياف الضوئية بناءً على نتائج بحثية ثانوية وأولية مختلفة، مثل منشورات الشركات الرئيسية وبيانات الجمعيات وقواعد البيانات. يوفر تقرير السوق "حجم سوق الألياف الضوئية والتوقعات (2020-2030)" تحليلاً مفصلاً للسوق يغطي المجالات التالية-
- حجم سوق الألياف الضوئية وتوقعاته على المستويات العالمية والإقليمية والوطنية لجميع قطاعات السوق الرئيسية التي يغطيها النطاق
- اتجاهات سوق الألياف الضوئية، بالإضافة إلى ديناميكيات السوق مثل المحركات والقيود والفرص الرئيسية
- تحليل مفصل لقوى PEST/Porter الخمس وSWOT
- تحليل سوق الألياف الضوئية يغطي اتجاهات السوق الرئيسية والإطار العالمي والإقليمي والجهات الفاعلة الرئيسية واللوائح والتطورات الأخيرة في السوق
- تحليل المشهد الصناعي والمنافسة الذي يغطي تركيز السوق، وتحليل خريطة الحرارة، واللاعبين البارزين، والتطورات الأخيرة في سوق الألياف الضوئية
- ملفات تعريفية مفصلة للشركة.
- التحليل التاريخي (سنتان)، السنة الأساسية، التوقعات (7 سنوات) مع معدل النمو السنوي المركب
- تحليل PEST و SWOT
- حجم السوق والقيمة / الحجم - عالميًا وإقليميًا وقطريًا
- الصناعة والمنافسة
- مجموعة بيانات Excel


Report Coverage
Revenue forecast, Company Analysis, Industry landscape, Growth factors, and Trends

Segment Covered
This text is related
to segments covered.

Regional Scope
North America, Europe, Asia Pacific, Middle East & Africa, South & Central America

Country Scope
This text is related
to country scope.
الأسئلة الشائعة
Some of the customization options available based on the request are additional 3–5 company profiles and a country-specific analysis of 3–5 countries of your choice. Customizations are to be requested/discussed before making final order confirmation, as our team would review the same and check the feasibility.
The report can be delivered in PDF/PPT format; we can also share an Excel dataset based on the request.
Growing demand for high-speed internet and developments in telecommunications infrastructure are the major trends in the market.
Corning Inc, Prysmian SpA, Jiangsu Zhongtian Technology Co Ltd, Yangtze Optical Fibre and Cable Joint Stock Ltd, Fiberhome Telecommunication Technologies Co Ltd, Furukawa Electric Co Ltd, CommScope Holding Co Inc, Nexans SA, Sumitomo Electric Industries Ltd
Other players considered are STL Tech, Finisar Corporation, Prysmian Group, Incab, Molex, Delaire USA, LEONI AG, RS Components Pte Ltd, Glenair, Inc., Extron, and Coherent Corp are the major market players.
The global Optical Fiber market was estimated to grow at a CAGR of 9.1% during 2022 - 2030.
The increase in adoption of Fiber-to-the-Home (FTTH) connectivity and increasing demand for high-speed internet are the major factors that drive the global Optical Fiber market.
The List of Companies - Optical Fiber Market
- Corning Inc
- Prysmian SpA
- Jiangsu Zhongtian Technology Co Ltd
- Yangtze Optical Fibre and Cable Joint Stock Ltd
- Fiberhome Telecommunication Technologies Co Ltd
- Furukawa Electric Co Ltd
- CommScope Holding Co Inc
- Nexans SA
- Sumitomo Electric Industries Ltd
- Coherent Corp
The Insight Partners performs research in 4 major stages: Data Collection & Secondary Research, Primary Research, Data Analysis and Data Triangulation & Final Review.
- Data Collection and Secondary Research:
As a market research and consulting firm operating from a decade, we have published and advised several client across the globe. First step for any study will start with an assessment of currently available data and insights from existing reports. Further, historical and current market information is collected from Investor Presentations, Annual Reports, SEC Filings, etc., and other information related to company’s performance and market positioning are gathered from Paid Databases (Factiva, Hoovers, and Reuters) and various other publications available in public domain.
Several associations trade associates, technical forums, institutes, societies and organization are accessed to gain technical as well as market related insights through their publications such as research papers, blogs and press releases related to the studies are referred to get cues about the market. Further, white papers, journals, magazines, and other news articles published in last 3 years are scrutinized and analyzed to understand the current market trends.
- Primary Research:
The primarily interview analysis comprise of data obtained from industry participants interview and answers to survey questions gathered by in-house primary team.
For primary research, interviews are conducted with industry experts/CEOs/Marketing Managers/VPs/Subject Matter Experts from both demand and supply side to get a 360-degree view of the market. The primary team conducts several interviews based on the complexity of the markets to understand the various market trends and dynamics which makes research more credible and precise.
A typical research interview fulfils the following functions:
- Provides first-hand information on the market size, market trends, growth trends, competitive landscape, and outlook
- Validates and strengthens in-house secondary research findings
- Develops the analysis team’s expertise and market understanding
Primary research involves email interactions and telephone interviews for each market, category, segment, and sub-segment across geographies. The participants who typically take part in such a process include, but are not limited to:
- Industry participants: VPs, business development managers, market intelligence managers and national sales managers
- Outside experts: Valuation experts, research analysts and key opinion leaders specializing in the electronics and semiconductor industry.
Below is the breakup of our primary respondents by company, designation, and region:

Once we receive the confirmation from primary research sources or primary respondents, we finalize the base year market estimation and forecast the data as per the macroeconomic and microeconomic factors assessed during data collection.
- Data Analysis:
Once data is validated through both secondary as well as primary respondents, we finalize the market estimations by hypothesis formulation and factor analysis at regional and country level.
- Macro-Economic Factor Analysis:
We analyse macroeconomic indicators such the gross domestic product (GDP), increase in the demand for goods and services across industries, technological advancement, regional economic growth, governmental policies, the influence of COVID-19, PEST analysis, and other aspects. This analysis aids in setting benchmarks for various nations/regions and approximating market splits. Additionally, the general trend of the aforementioned components aid in determining the market's development possibilities.
- Country Level Data:
Various factors that are especially aligned to the country are taken into account to determine the market size for a certain area and country, including the presence of vendors, such as headquarters and offices, the country's GDP, demand patterns, and industry growth. To comprehend the market dynamics for the nation, a number of growth variables, inhibitors, application areas, and current market trends are researched. The aforementioned elements aid in determining the country's overall market's growth potential.
- Company Profile:
The “Table of Contents” is formulated by listing and analyzing more than 25 - 30 companies operating in the market ecosystem across geographies. However, we profile only 10 companies as a standard practice in our syndicate reports. These 10 companies comprise leading, emerging, and regional players. Nonetheless, our analysis is not restricted to the 10 listed companies, we also analyze other companies present in the market to develop a holistic view and understand the prevailing trends. The “Company Profiles” section in the report covers key facts, business description, products & services, financial information, SWOT analysis, and key developments. The financial information presented is extracted from the annual reports and official documents of the publicly listed companies. Upon collecting the information for the sections of respective companies, we verify them via various primary sources and then compile the data in respective company profiles. The company level information helps us in deriving the base number as well as in forecasting the market size.
- Developing Base Number:
Aggregation of sales statistics (2020-2022) and macro-economic factor, and other secondary and primary research insights are utilized to arrive at base number and related market shares for 2022. The data gaps are identified in this step and relevant market data is analyzed, collected from paid primary interviews or databases. On finalizing the base year market size, forecasts are developed on the basis of macro-economic, industry and market growth factors and company level analysis.
- Data Triangulation and Final Review:
The market findings and base year market size calculations are validated from supply as well as demand side. Demand side validations are based on macro-economic factor analysis and benchmarks for respective regions and countries. In case of supply side validations, revenues of major companies are estimated (in case not available) based on industry benchmark, approximate number of employees, product portfolio, and primary interviews revenues are gathered. Further revenue from target product/service segment is assessed to avoid overshooting of market statistics. In case of heavy deviations between supply and demand side values, all thes steps are repeated to achieve synchronization.
We follow an iterative model, wherein we share our research findings with Subject Matter Experts (SME’s) and Key Opinion Leaders (KOLs) until consensus view of the market is not formulated – this model negates any drastic deviation in the opinions of experts. Only validated and universally acceptable research findings are quoted in our reports.
We have important check points that we use to validate our research findings – which we call – data triangulation, where we validate the information, we generate from secondary sources with primary interviews and then we re-validate with our internal data bases and Subject matter experts. This comprehensive model enables us to deliver high quality, reliable data in shortest possible time.
 احصل على عينة مجانية لهذا التقرير